ISSN 1678-6343 Programa de Pós-graduação em Geografia
Caminhos de Geografia Uberlândia v. 12, n. 39 set/2011 p. 271 - 282 Página 271 URBANIZATION AND SPATIAL CHANGES IN DEMOGRAPHIC CHARACTERISTICS IN
MONTERREY METROPOLITAN REGION1
Arun kumar Acharya acharya_77@yahoo.com Prof. Dr. do Instituto de Investigações Sociais Universidade Autónoma de Nuevo León - Campus Mederos, UANL
ABSTRACT
This paper tries to explore the process of urbanization and spatial changes in demographic features in the Monterrey Metropolitan Region (MMR), Mexico. This city is the third largest urban sector in Mexico which has around 4 million population. It is also the industrial and economic capital of the country. The present study found that rapid urbanization in the metropolitan region has a close association with process of industrialization. In population distribution and composition, study found that the metropolitan region had its “demographic transition” during the years seventies and currently the region is taking advantages of demographic bonus cohort, i.e. a higher concentration of population in economic active groups compare to children and old age population. However, this paper indentified a higher imbalance in metropolitan demographic scenario. On the one hand, there is di-populization in the city center region and in other there is a steady increment of population in peri-urban region. Key words: Urbanization, Spatial change in population, Di-populization, Monterrey, Mexico.
INTRODUCTION
The rapid urbanization is shaped by trends in economic development mainly by the process of industrialization and population growth. Twentieth century was the century of rapid population growth and at least 2 billion additional inhabitants and perhaps close to 3 billion more people can be expected to be added in world over the next five decades. Today world population stands at 6.4 billion, and is growing at a rate of 1.2 percent per year (United Nations Populations Division, 2006). The enormous growth of world population that began in middle of the 20th century is not yet over and potential for huge population increases remains high (ibid.). During the year 1975, 37 percent (one in three persons) world population was living in urban areas, which reaches to 50 percent in 2007 at a growth rate of 2 percent per annum and this is also superior to the world total population growth rate as cited by UN population division (United Nations, 2007).
Urbanization is accompanied by shifts of labor force from the rural sector to urban sector. In most developed countries, the urbanization process is completed while in many developing countries or regions this process is still under way. Statistics indicates that in 2007-2008, 39 percent population in Africa is living in urban sectors, whereas in Europe nearly 73 percent, in Latin American and Caribbean 78 percent and in North America 81 percent.
Urbanization processes are basic elements in the dynamic of human societies. During the pos-industrial revolution the urbanization process began because of high rural-urban migration. Town and cities were become more attractive for the rural migrants due to better job opportunity, amenities and public services than the village as explained by Harris-Todaro (Harris and Todaro, 1970). While, Becker, Mill and Williamson (Becker, et.al. 1986) empirically analyzed the urban growth taking example of India and described that scarcity of agricultural land relative to rural population has been a strong push factor of rural-urban migration.
On the other hand, Brueckner (Brueckner, 1990) made a simple but clear cut analysis, interpreting the realized urbanization rate as the result of a general equilibrium in a monocentric
1
Recebido em 01/02/2011
Caminhos de Geografia Uberlândia v. 12, n. 39 set/2011 p. 271 - 282 Página 272
city model. In that model, urban population, city size and utility level of residents are
endogenously determined. The theoretical analysis is followed by an empirical analysis with cross section data on 24 developing countries and in this analysis Brueckner shows that rural-urban income ratio is the main contribution of rural-urbanization rate. Considering the Brueckner model in Mexico, it is seen that the urbanization process is polarized in three main poles (Mexico DF, Guadalajara and Monterrey) due to higher rural-urban and urban-urban income difference. Data indicates that during the year 1950, 43 percent of Mexican population was living in urban areas and it reaches to 78 percent in 2008. Out of total urban population in the country, 40 percent lives only in three cities, such as; Mexico DF, Guadalajara and Monterrey. Since 1950, Monterrey has possesses its importance in the country because of higher industrialization and it is well known as economic capital of the country. Monterrey, is capital of Nuevo León state, was founded in 1596 and is located in north-east Mexico, 200 kilometers from the border with Texas in the United States (see map 1). When Mexico won the war of independence against Spain in 1821, Monterrey had a population of 11,044. This figure rose to 35,356 in 1880 when the city’s industrial development began. During the first half of the 20th
century, Monterrey’s population grew from 62,000 in 1900 to 354,000 in 1950, the year during which the metropolitan area began to form, expanding from the central municipality of Monterrey to the municipality of Guadalupe and San Nicolas de los Garza. Till 2005, Monterrey Metropolitan Region expanded into nine municipalities with a total population of 3.5 million inhabitants, placing in 81th position among the 100 most populated cities in the world (United Nations, 2005).
Map 1: Map of Mexico with state of Nuevo Leon
Monterrey Metropolitan Region is one among the rapid growing urban center in Mexico (see map 2). The better employment opportunities, good quality of life are some of the reason behind the accelerating urbanization.
This city is not only a place of attraction for the people of northern Mexico, but also for the people of central and southern Mexico. Though during the last few years the process of urbanization in Monterrey and its metropolitan regions has goes beyond the limit, still there is no systematic study has been conducted to understand the demographic scenario of the city. Thus, the present study has attempted to analyze the process of urbanization with emphasis to its trend and level and its impact on demographic changes in the metropolitan region. Also, this research tries to describe how the pace of urbanization leading Monterrey Metropolitan region to a monocentric zone in the state as well as in the country.
Caminhos de Geografia Uberlândia v. 12, n. 39 set/2011 p. 271 - 282 Página 273 Map 2: Map of Monterrey Metropolitan Region
Process of urbanization in Mexico
Urbanization in Mexico is a multidimensional process within the society’s overall historical-structural transformation. Its demographic, economic, ecological, political and socio-cultural components must be examined within a unified framework that reflects the temporal and spatial diversity of the Mexican experience. Between 1521 and 1820, the Spaniards created hundreds of cities and new towns in the country. This urban expansion was not carried out just to assure military and political control, but to create a system for exploiting its human, mineral, and agricultural resources for the benefit of the country. The colonial urban system consisted of variety of settlement types by the administrative-military cities such as Mexico City, Guadalajara and Merida, the port towns such as Veracruz, Acapulco and Mazatlan, and the mining centers such as Guanajuato, Pachuca, Zacatecas, San Luis Potosi and Taxco (Kemper, 1979).
Following to independence, the Mexican government attempted to establish firmer control over the northern frontier area by encouraging colonization by foreigners and Mexican alike. The ineffectiveness of these policies is reflected in the loss of almost half of the national territory through conflicts in Texas, California, and the rest of what came to be US Southwest. The geographical and political marginality of the northern zone, heightened by the lack of a large indigenous population capable of being exploited and by the natural disadvantages of lack of water and good agricultural lands, cause the settlers to develop a frontier spirit of self-reliance and entrepreneurship unlike that found anywhere else in Mexico (ibid.).
As Balán et. al (1973, in Kemper, 1979) point out, Monterrey is thoroughly within the spirit of the North. There is no doubt of the mystique of Monterrey in the Mexican context: it is hard work and industriousness. The development of Monterrey as the principal city and industrial center of northern Mexico during the latter part of the 19th century belies its humble origins and demonstrates, once again, the importance of external events in the Mexican urbanization process during the national period.
In 1803, Monterrey was a small town with just 7,000 inhabitants and few prospects for future greatness. Cattle ranching and derivative activities dominated the local scene, compared to other northern towns, mining was of no great importance. The town participated in a regional
Caminhos de Geografia Uberlândia v. 12, n. 39 set/2011 p. 271 - 282 Página 274 urban economic system weakly articulated to the central Mexican area. After the war for independence and during the period of Liberal reform, Monterrey began to emerge as an important regional commercial center. The war with Texas in the 1830s and the subsequent war with the United States in the 1840s simply set the stage for Monterrey’s role as intermediary during the US civil war in 1860s. The active commerce with the confederates also reflects the increased manufacturing activities in the city (Kemper, 1979).
After declining in importance somewhat in the 1870s as a result of losing its distribution function to the port of Matamoros, Monterrey surged ahead during the Porfirian era. The capitalist and entrepreneurs of Nuevo León, for whom it served as state capital and principal urban center, took advantage of special tax laws in developing a large commercial and industrial sector in the country during the last decades of 19th century. In 1880, the city had only 30,000 residents and this figure doubled by 1900. The energetic leadership of General Bernardo Reyes helped the coming of the railroads, which linked Monterrey with the port city of Tampico, with the United States, and with Mexico City. As we have seen with urbanization throughout Mexico during this period, the railroad network proved critical in establishing the city’s position at the head of a large regional urban system (ibid.).
Foreign capital was attracted to local industrial opportunities during the latter part of the Porfiriato. The availability of a relatively skilled work force, the proximity to U.S. markets, and an adequate supply of water proved important as a foundation on which the distinctive entrepreneurial spirit of the regiomontanos might flourish. The substantial and diversified growth of Monterrey illustrates the impact of period of political consolidation and capital accumulation. In the 1890s and in the first decade of the 20th century, a number of new industrialists expanded to make Monterrey a center for banking and commerce. The economic expansion had its demographic parallel: the urban population reached 1900 in 1910 and Monterrey became the fourth largest city in Mexico (Bassols Batalla, 1978, in Kemper, 1979).
The Revolution had a great impact on Monterrey and its region. Nuevo León was a center for conflicts between the forces of Villa and Carranza, but even in the worst of times the industrial development was not bought to a halt. The population in 1921 reached 88,000 as new furniture and food industries were established. After the Revolution, industrialization and urbanization continued. Despite the problems caused by the depression, and the weakness generated by Monterrey’s ties to the United States and world economies, many more companies continued to be established.
Man firms were fused into conglomerates that combined industrial capacity with banking and commercial expertise to dominate national markets. The changes in the national economic structure as a result of the labor and land reforms of the 1930s also had a certain effect on Monterrey. Of special importance was the expropriation of the oil industry in the Tampico-Huastecas and Reynosa areas, which guaranteed a steady supply for the region (Kemper, 1979). By the year 1940, when the overall political and economic climate in Mexico was encouraging massive industrialization, Monterrey was well positioned to take advantage of the opportunity. During and after this period the urban population grew steadily and the city became the third largest urban hierarchy, thanks to better supplies of gas, oil and electricity. Migrants became a constant factor in the population expansion, especially from within the Nuevo León and from the adjacent states such as San Luis Potosi, Coahuila, Tamaulipas and Zacatecas (ibid.).
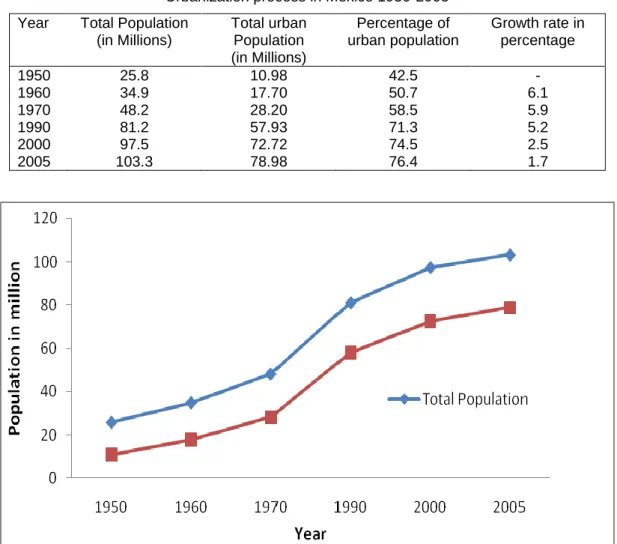
On the other hand, urbanization in Mexico shares most characteristics features of developed countries. Mexican census (INEGI) classifies a region as an urban area where more than 2,500 people are living. As can be seen in the table 1, the percentage of urban population grows systematically with total population (see figure 1). For example during the year 1950 Mexico 42.5 percent population were living in urban areas, which reaches to 76 percent in 2005. Nevertheless, Mexico experienced a higher growth rate in urbanization process till 1950, but subsequently the rate gradually declining.
Data shows that during the years 2000-2005 the urbanization growth rate in the country was 1.7 per cent. Observing the table 1 and figure 1, it can be conclude that higher urbanization in Mexico is predominance due to higher rural-urban migration, although in recent year growth rate has decline due to higher international migration and greater urban saturation.
Caminhos de Geografia Uberlândia v. 12, n. 39 set/2011 p. 271 - 282 Página 275 Table 1
Urbanization process in Mexico 1950-2005 Year Total Population
(in Millions) Total urban Population (in Millions) Percentage of urban population Growth rate in percentage 1950 1960 1970 1990 2000 2005 25.8 34.9 48.2 81.2 97.5 103.3 10.98 17.70 28.20 57.93 72.72 78.98 42.5 50.7 58.5 71.3 74.5 76.4 - 6.1 5.9 5.2 2.5 1.7
Figure 1: Urbanization process in Mexico Urbanization in Nuevo León state
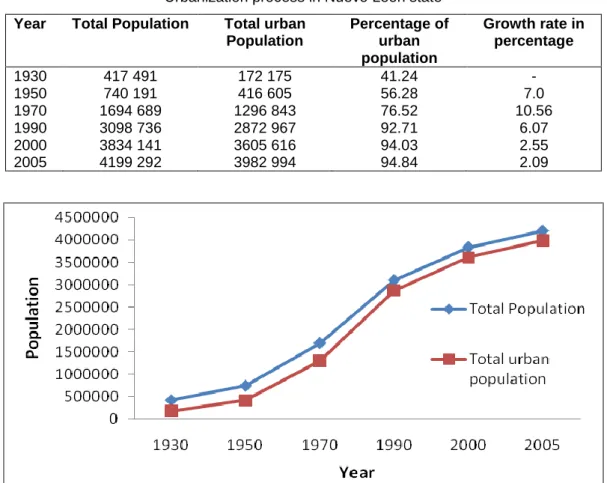
Nuevo León is one of the most urbanized state in Mexico. In the year 1930, 41 percent of the state population was living in urban areas and it reaches to 95 percent in 2005. The state observed its higher urbanization rate during 1950-70, afterwards the growth rate has declined due to greater staturation as well as higher international migration from Mexico to United states of America as well as in particular from Nuevo León, thus in 2005 the growth rate was only 2.09 percent.
In Nuevo León major part (85 percent) of the state population and 90 percent of the total state urban population concentrated in Monterrey Metropolitan Region. Monterrey Metropolitan Region is conform with 9 out of 51 districts of the state.
Trend of urbanization in Monterrey Metropolitan Region
The Monterrey Metropolitan Region (MMR) is the third largest city in Mexico after the Mexico DF and Guadalajara. As we have seen in earlier discussion; it comprises major part of the state’s population. In the table 3 and figure 3, I have analyzes the total population of MMR and its share in overall state’s population. In the year 2005, the Monterrey Metropolitan region had 3.6 million population out of 4.1 million state’s population (86 percent) and 90 percent of the total state urban population.
This higher concentration of population in one center dominates MMR as a Monocentric urban
zone in the state. The larger concentration of urban population in MMR is accompanied by an
Caminhos de Geografia Uberlândia v. 12, n. 39 set/2011 p. 271 - 282 Página 276 Table 2
Urbanization process in Nuevo León state Year Total Population Total urban
Population Percentage of urban population Growth rate in percentage 1930 1950 1970 1990 2000 2005 417 491 740 191 1694 689 3098 736 3834 141 4199 292 172 175 416 605 1296 843 2872 967 3605 616 3982 994 41.24 56.28 76.52 92.71 94.03 94.84 - 7.0 10.56 6.07 2.55 2.09
Figure 2: Urbanization process in Nuevo León state
Table 3
Trend of urbanization in Monterrey Metropolitan Region
Year Total Population Total urban Population Total population of MMR Share of population of MMR in state population Share of population MMR in state urban population 1930 1950 1970 1990 2000 2005 417491 740191 1694689 3098736 3834141 4199292 172175 416605 1296843 2872967 3605616 3982994 164210 389629 1254691 2573527 3243466 3598597 39.0 52.6 74.0 83.0 84.6 86.0 95.3 93.5 96.7 89.6 90.0 90.1
The trend of urbanization in MMR cannot be understood properly without analyzing the spatial dimension of urbanization and urban growth of the region. As it is describes earlier, the metropolitan region is conform with nine municipalities of 51, such as: Monterrey, San Pedro Garza Garcia, San Nicolas de los Garza, Guadalupe, Santa Catarina, Juarez, General Escobedo, Apodaca and Garcia. In table 4, I have presented the trends of population growth in metropolitan region according to municipalities. We can see that in 1930 the total population of the region was 164210 and after the 75 years (in 2005) the population increases 22 times and reaches to 3598597.
Caminhos de Geografia Uberlândia v. 12, n. 39 set/2011 p. 271 - 282 Página 277 Figure 3: Trend of urbanization in Monterrey Metropolitan Region
Whilst on regional distribution of population, we can see that during 1930 only municipality of Monterrey had more than 100 thousands population and it was the mostly populated comparable to municipalities of city center and peri-urban region. After the year 1930, the population in all municipalities started growing due to economic miracle in the region and today all municipalities have more than 150 thousands population. For example municipality of Monterrey has more than 1 million population.
Table 4
Population growth in Monterrey Metropolitan Region
Districts 1930 1950 1970 1990 2000 2005
MMR Apodaca García
San Pedro Garza García Guadalupe
Monterrey
San Nicolás de los Garza Juárez Santa Catarina General Escobedo 164210 4636 5178 2082 3174 137388 2937 3707 3799 1309 389629 4915 4769 5228 12610 339282 10543 2839 7377 2066 1254691 18564 6477 45983 159930 858107 113074 5656 36385 10515 2573527 115913 13164 113040 535560 1 069238 436603 28014 163848 98147 3243466 283497 28974 125978 670162 1 110997 496878 66497 227026 233457 3598597 418784 51658 122009 691931 1133 814 476761 144380 259896 299364
Nevertheless, the spatial population distribution in metropolitan region indicates that, till 1970, the City center region (Monterrey, San Nicolas de los Garza, Guadalupe and San Pedro Garza Garcia) was holding the m ajor part of the metropolitan population (94 percent) (table 5). However, in 2005 the scenario changed, only 67 percent of the metropolitan population is living in city center region and 33 percent residing in peri-urban region (Apodaca, Garcia, Juarez, Santa Catarina and General Escobedo). This steady change in spatial population distribution as well as the di-populization in the City center region is due to some important factors; such as; 1. changes in land -use pattern in city center region (for example, conversion of residential areas to business centers) causing migration of people to peri-urban region, 2. concentration of new comers population in peri -urban region (see the table 10 ), because of lower cost of living, lower pollution and lower urban vio lence, 3. higher availability of green and open space (lower density of people and housing) in peri -urban region and 4. availability of employment opportunities due to appearance of new industrial parks.
Caminhos de Geografia Uberlândia v. 12, n. 39 set/2011 p. 271 - 282 Página 278 Table 5
Spatial population distribution in Monterrey Metropolitan Region
Region 1930-70 1970-2005
Total Pop. Percentage Total Pop. Percentage City center region*
Peri-urban region** 1177094 77597 93.6 6.4 2424515 1174082 67.3 32.7 *
includes San Pedro Garza García, Guadalupe, Monterrey and San Nicolás de los Garza
**
includes Apodaca, Garcia, Juarez, Santa Catarina and General Escobedo
On the other hand, to describe the real changes in demographic scenario of the metropolitan region, I have analyzed the population growth rate in table 6 for Monterrey and its metropolitan region. Table indicates that during 1930-50 the metropolitan population was growing at 7 percent per annum and in the same period the city center region was growing more steadily than the peri-urban region. For example, urban population in Guadalupe and San Nicolas de los Garza was growing more than 12 percent per annum. But the city center region could sustain this growth rate till 1970, after that the pressure of population growth shifted to peri-urban region. Data indicates that currently peri-urban population is growing at more than 20 percent per annum. However, it is necessary to pointed out that San Pedro Garza Garcia (-0.63 in 2005) and San Nicolas de los Garza (-0.80) are currently have negative population growth rate. In San Pedro Garza Garcia the reason of declining population is fall in fertility rate. Data reflects that in 1970 the fertility rate was 2.4, which declined to 1.8 in 2005. It is significant to note that San Pedro Garza Garcia is the only municipality in the state, which has below replacement fertility rate, but in case of San Nicolas de los Garza, urban land saturation and environmental pollution are responsible for out migration and negative population growth.
Table 6
Population growth rate in Monterrey Metropolitan Region
Districts 1930-50 1950-70 1970-90 1990-2000 2000-05
MMR Apodaca García
San Pedro Garza García Guadalupe
Monterrey
San Nicolás de los Garza Juárez Santa Catarina General Escobedo 6.86 0.30 -0.39 7.55 14.86 7.34 12.94 -1.17 4.70 2.89 11.10 13.88 1.79 38.97 58.41 7.64 48.62 4.96 19.66 20.44 5.25 26.21 5.16 7.29 11.74 1.23 14.30 19.76 17.51 41.66 2.60 14.45 12.01 1.14 2.51 0.39 1.38 13.73 3.85 13.78 2.18 9.54 15.65 -0.63 0.64 0.41 -0.80 23.42 2.89 5.64
Demographic composition and transition in Monterrey Metropolitan Region
The sex composition of the metropolitan region indicates that, in the year 1930, there were more female than the male. Whereas, after the years this trend gradually changes and in 2005 both male and female shares equal proportion of the metropolitan population (see table 7). The increasing number of male population in the region is attributed by the higher male migrants. Though in the last few years, we can observe a thick wave of female dominates migrants to the region (Durin, et.al, 2007), but it is less than the male migrants wave.
The demographic composition of the metropolitan region I have analyzed in the table 8. From the table we can observe an increasing trend of population till 1970 among the age groups 0-4 and 5-14 and decreasing trend of the same age groups population after 1970. These changes observed because of effective measures taken to reduce the total fertility rate through the family planning program during the years 70s.
Caminhos de Geografia Uberlândia v. 12, n. 39 set/2011 p. 271 - 282 Página 279 On the other hand, the adult and aged population of the metropolitan region showing a decline trend between 1930 to1970 and increasing trend after 1970. Whereas the population of 15-29 age group does not reflect a consistent trend, as this group is known as “floating population” because of in and out migration.
Table 7
Population distribution according to sex in Monterrey Metropolitan Region
Year Male Female
1930 1950 1970 1990 2000 2005 48.2 48.3 49.8 49.5 49.5 49.6 51.8 51.7 50.2 50.5 50.5 50.4
The table 8 provides a significant demographic scenario for Monterrey Metropolitan region. We can analyze that currently we have fewer children and young population, and more adult and aged population in the metropolitan region. Between the years 1930 to 1990 the growth rate of aged population (60+) was almost zero, whilst after 90s this group population started increasing, and during 1990-2005 around 2 percent new aged population added. However, the figure 4 indicates that in 1970 the metropolitan region had its “demographic transition”, since then the child and young population started declining steadily, and at the same time the adult (economically active population) and old age population started escalating. Thus, the demographic scenario of the metropolitan region illustrate that at present city is enjoying its “demographic bonus cohort” because of higher concentration of population in economically active ages, which will continue 30 to 45 years.
Table 8
Population distribution according to age groups in Monterrey Metropolitan Region Age group 1930 1950 1970 1990 2000 2005 0-4 5-14 15-29 30-59 60 and more 12.4 21.8 31.7 28.5 5.4 14.2 23.4 29.2 27.8 5.2 17.0 27.4 27.5 19.0 5.0 10.7 23.0 32.7 27.6 5.5 10.3 19.1 30.1 32.7 6.6 9.4 18.5 26.9 35.6 7.5 Phenomenon of migration
Migration to Monterrey Metropolitan Region is an important phenomenon for the rapid population growth in the city. As a result of rapid industrialization and economic miracle after the decades 30-50s, Monterrey and its metropolitan region experienced heavy rural urban as well as interstate migration. For decades spatial population movement were dominated by this flow of migration. As a part of interstate migration and rural-urban migration the inter-urban has gained significance role in the urbanization process in Monterrey. The table 9 and figure 5 indicates that during the year 1940 in the region there were 57,160 migrants, which was nearly 26 percent of the metropolitan population, and till 1970s the proportion of migrants to total population reached 30 percent.
However, after 70s, the proportion of migrants started decline. It is mainly because of two factors; 1. Changes in economic structure from industrial to service sector after 70s, which affect in quality of migrants, 2. Appearance of new industrial poles after 70s in neighboring states, such as Saltillo in Coahuila, Reynosa in Tamaulipas, which were attracted migrants. Though, there is no denying of the fact that migration played a very significant role in the growth of the city, however, at the present migration is losing its importance.
Caminhos de Geografia Uberlândia v. 12, n. 39 set/2011 p. 271 - 282 Página 280 Figure 4 - Population distribution in Monterrey Metropolitan Region
Table 9
Number of migrants in Monterrey Metropolitan Area Year Total Number of migrants Percentage migrants out
total population 1940 1950 1970 1990 2000 2005 57160 114758 370154 649374 746225 298152 25.6 29.5 30.0 25.2 23.0 8.0
Figure 5 - Percentage distribution of total migrants in Monterrey Metropolitan Region
As it is stated earlier, migration in urbanization process in Monterrey Metropolitan Region is a significant contributing factor, so I have analyzed the regional distribution of migrants in the metropolitan region. I have classified the metropolitan region into two categories; such as: City center region (San Pedro Garza Garcia, Guadalupe, Monterrey and San Nicolas de los Garza) and Peri-urban region (Apodaca, Garcia, Juarez, Santa Catarina and General Escobedo). The
Caminhos de Geografia Uberlândia v. 12, n. 39 set/2011 p. 271 - 282 Página 281 table 10 indicates that, at present City center region is not a favorable destination for migrants. Till 1970, around 95 percent of migrants were habiting in City center region, because of lower distance to their work place. Whereas, at present 60 percent migrants living in Peri-urban region. Basically the new arrival migrants prefer to stay at outskirt region because of easy availability of housing facilities as well as lower housing and living cost.
Table 10
Regional distribution of migrants in Monterrey Metropolitan Region
1940 1950 1970 1990 2000 2005
City center region
Peri-urban region 96.2 (54965) 3.8 (2195) 96.1 (110246) 3.9 (4512) 94.6 (350327) 5.5 (19827) 82.0 (537710) 18.0 (111664) 73.4 (547722) 26.6 (198503) 40.2 (119743) 59.8 (178409) Conclusion
The above analysis suggests that Mexico has passed the phase of rapid urbanization. Today, 76 percent of country’s population is living in different urban centers. In the last three decades the urban population growth rate has slowdown steadily, probably because of higher international migration and fall in natural growth rate. In Nuevo León which is country’s most urbanized state, nearly 95 percent population lives in urban areas, and 90 percent of them only resides in Monterrey Metropolitan Region. This demographic and economic concentration has made the metropolitan region as a monocentric zone in the state.
As it is stated earlier, Monterrey Metropolitan Region is the third largest city after Mexico DF and Guadalajara. Due to availability of better employment opportunity and quality of life, Monterrey and its metropolitan region has remain a center of attraction for many local, national and international migrants. Though, the pace of urbanization in the metropolitan region indicates that growth rate has declined in last few years (5.25 percent in 1970-90 to 2.18 percent in 2000-05). However, the above presented data reflects that that Monterrey and its metropolitan region still an attracted center for many Mexican; because of employment opportunities and better quality of life compared to other Mexican metropolis (Garza, 1996).
On the other hand, Monterrey Metropolitan constitutes nine municipalities. Though all municipalities are experiencing population growth, but the City center region (Monterrey, San Pedro Garza Garcia, San Nicolas de los Garza and Guadalupe) comprises nearly 70 percent of the metropolitan population, are currently observing a declining trend in population growth. As we have seen in the discussion that San Pedro Garza Garcia and San Nicolas de los Garza are currently have negative growth rate. On the contrary, Peri-urban region is experiencing high population growth rate because of migration of people from City center region to periphery, higher employment opportunity and concentration of fresh migrants in the region.
In population distribution and composition, it has concluded that in the year 1970 the metropolitan region obtained the “demographic transition”. Data indicates that the metropolitan region enjoying its demographic bonus cohort i.e. a higher concentration of population in economic active groups compare to children and old age population. However, this paper indentified that there is higher imbalance in the demographic scenario in the metropolitan region. On the one hand, we have there is di-populization in the city center region and in other we have steady increment of population in the peri-urban region.
REFERENCES
BECKER, M, MILLS, E.S AND WILLIAMSON, J.G. "Modeling Indian migration and city growth: 1960-2000". Economic Development and Cultural Change, No. 35, 1986
Caminhos de Geografia Uberlândia v. 12, n. 39 set/2011 p. 271 - 282 Página 282 BRUECKNER, J.K. "Analyzing third world urbanization: a model with empirical evidence".
Economic Development and Cultural Change, No. 38, 1990.
DURIN, SEVERIN, MORENO, REBECA AND SHERIDAN CECILIA. "Rostros desconocidos: Perfil socio demográficos de las Indígenas en Monterrey". Trayectorias: Revista de Ciencias
Sociales, Año IX, No. 23, Instituto de Investigaciones Sociales, Mexico, 2007.
GARZA, GUSTAVO. "Social economic imbalances in the Metropolitan Area of Monterrey".
Environment and Urbanization, Vol. 8, No. 2, October, 1996.
HARRIS, J.R. AND TODARO, M.P. "Migration, unemployment and development: a two sector analysis". The American Economic Review, No. 60, 1970.
KEMPER, V., ROBERT. "Mexican Urbanization Since 1821: A Macro-Historical Approach".
Urban Anthropology, Vol. 8, No. 3-4: pp. 267-289, 1979.
UNITED NATIONS POPULATION DIVISION. World Population Prospects, New York: United Nations, 2006 http://www.un.org/esa/population/publications/wpp2000.PDF
UNITED NATIONS. World Urbanization Prospects: The 2007 Revision, New York: United Nations, 2007 http://www.un.org/esa/population/publications/wup2007/2007wup.htm (consulted on 10/08/2010).
UNITED NATIONS. List of metropolitan areas by population, 2005, http://en.allexperts.com/e/l/li/list_of_metropolitan_areas_by_population.htm (consulted on 18/09/2010).