Received 06 Dec., 2013 Accepted 16 Jan., 2014 (006299)
1 Department of Chemical and Food Engineering – EQA, Technological Center, Federal University of Santa Catarina – UFSC, Florianópolis, SC, Brazil, e-mail: [email protected]
2 Department of Food Engineering, University of São Paulo – USP, Pirassununga, SP, Brazil *Corresponding author
Crossflow microfiltration of sugarcane juice – effects
of processing conditions and juice quality
Katia REZZADORI1*, Leo SERPA1, Frederico Marques PENHA1,
Rodrigo Rodrigues PETRUS2, José Carlos Cunha PETRUS1
1 Introduction
Sugarcane is a raw material of great versatility and economic viability. Its productive success is due to its easy adaptation to Brazilian climate and soil, and it is cultivated in the entire national territory. Brazilian production of sugarcane in 2013 was approximately 652 million tons, characterizing this culture as one of the major economic activities of the country. This product can be used in the manufacturing of many different products. One of them is sugar, with annual production of 40 million tons, followed by ethanol (25 million tons) and others (Companhia Nacional de Abastecimento, 2014). In addition to those products, sugarcane juice is a very popular beverage in Brazil, and as long as properly exploited, it has a high market potential (Nogueira et al., 2009).
Sugarcane juice, known in Brazil as “caldo de cana” or
“garapa”, is a non-alcoholic energy juice, which is very popular in Brazil and consumed particularly during the hottest periods of the year. The juice is obtained by extraction using electric roller mills and can be consumed pure or with acidic fruits, such as passion fruit. The current sugarcane market is characterized by street venders, almost always without the appropriate hygiene/sanitary conditions required for the handling of food products (Duarte et al., 2010).
Accordingly, the industrialization of sugarcane juice is an attractive alternative for the food industry, given that the processed product is not available on the market. Furthermore,
the demand for high quality products has led the food industry to develop and improve nutritious products without the use of chemical preservatives and with sensorial attributes which are pleasing to the consumers (Nogueira et al., 2009).
As an alternative to the traditional preservation methods, membrane separation processes allow the elimination of the conventional clarification stages and do not require the use of chemical agents or heat, reducing the energy costs associated with the processing. Thus, separation techniques involving thermolabile compounds, such as vitamins, are advantages since they preserve the sensorial and nutritional properties of the fresh product (lack of cooked flavor), which are important to the quality of the final product (Cassano et al., 2011; Moreno et al., 2012).
Preliminary studies conducted by Rezzadori et al. (2013) showed good sensorial acceptance of microfiltered sugarcane juice with passion fruit pulp, reaching a level of acceptance of over 80%. In addition, cold-process membrane technologies represent an alternative to high-temperature treatments. Tangential microfiltration has been successfully applied to some highly thermosensitive juices, resulting in a microbiologically stabilized and clarified product that preserves most of the original aroma of the fruit.
However, membrane technology does have some limitations, such as low permeate flux, resulting from physicochemical
Abstract
Sugarcane juice with passion fruit pulp was clarified using microfiltration under different T (temperature), P (pressure), and V (tangential velocity). The effects of these processing parameters were evaluated applying a rotational central composite experimental design (RCCD) and response surface methodology (RSM). The tests were performed at a filtration pilot plant
using a polyamide hollow-fiber membrane with an average pore diameter of 0.4 μm and filtration area of 0.723 m2. In addition,
the resistances to the permeate flux during the microfiltration were investigated according to the series resistance. The final
permeate flux ranged from 7.05 to 17.84 L·h–1·m–2. There was a rapid decline in flux (50%) in the initial stages of microfiltration.
T and V were the major variables responsible for the flux increase. The concentration polarization showed the greatest influence
on the flux decline, and highest values for the flux decline rate (λ) were found when low pressures were used. In the clarified
juice there was a reduction in the contents of total solids, proteins, vitamin C, and acidity, while the soluble solids, pH, and ash contents did not change. Finally, membrane process could produce high quality filtered sugarcane juice with substantial flux
and increased luminosity improving organoleptical properties.
2.3 Microfiltration
The tests were carried out in a pilot microfiltration unit operating in crossflow mode with temperature and pressure control. An organic (polyimide) membrane in a hollow fibre configuration, with an average pore size of 0.4 µm and filtration
area of 0.7 m2 (PAM Membranas Seletivas, RJ, Brazil), was used.
This study was carried out employing a 23 rotational central
composite design (RCCD) (Montgomery, 2005), comprised of eight linear experimental runs with coded levels (–1 and +1), four axial runs (α=1.6818), and three runs with central values (0), totalizing 17 experimental runs. In order to obtain the best final permeate flux, the following independent variables were
studied: pressure (P) (bar), tangential velocity (Vt) (m·s–1), and
temperature (T) (°C), and their levels and codes are shown in Table 1. The values for the independent variables were chosen based on preliminary studies and data available in the literature for similar products, as proposed by Nogueira & Venturini Filho (2007) and Carvalho et al. (2008). Moreover, technical limitations of the equipment and the microfiltration membrane were also respected.
Experimental procedure
In each run, twelve litres of sugarcane juice were added to the feed tank of the pilot unit, varying the operational parameters according to the experimental design. An aliquot of the permeate was collected at regular intervals, and at the end of each run, samples of the permeate and the retentate were collected for the determination of analytical parameters.
After each sample processing, the membrane was cleaned using a CIP (clean-in-place) system, according to the manufacturer’s recommendations.
phenomena which occur during the process, i.e. concentration polarization, the formation of a polarized layer and fouling of the membrane (Mulder, 2006). Systems operating with high permeate fluxes are of economic importance since they require smaller filtration areas. In order to achieve this, more studies are needed to evaluate the best operational conditions of the process.
The objective of this study was to clarify sugarcane juice with passion fruit pulp using different process conditions. The effects of temperature (°C), pressure (bar), and tangential
velocity (m·s-1) were evaluated using the final permeate flux as a
parameter applying a rotational central composite experimental design (RCCD). The resistances to the permeate flux during the microfiltration were also investigated, and the physicochemical characteristics of the clarified juice were evaluated under the best processing conditions.
2 Materials and methods
2.1 Raw materials
Sugarcane (Sacharum officinarum), cultivar SP 3250
(Tecnocana Tecnologia em Cana Ltda., SP, Brazil) and frozen
pulp of the yellow passion fruit (Passiflora edulis) (DeMarchi
Indústria e Comércio de Frutas Ltda., SP, Brazil) were used.
2.2 Juice preparation
The juice extraction was carried out using an electric roller mill (Maqtron, SC, Brazil). Immediately after extraction, 5% (m/m) of passion fruit pulp was added to the sugarcane juice in order to minimize the enzymatic browning reaction and improve sensorial characteristics. This concentration was selected based on studies by Prati et al. (2005).
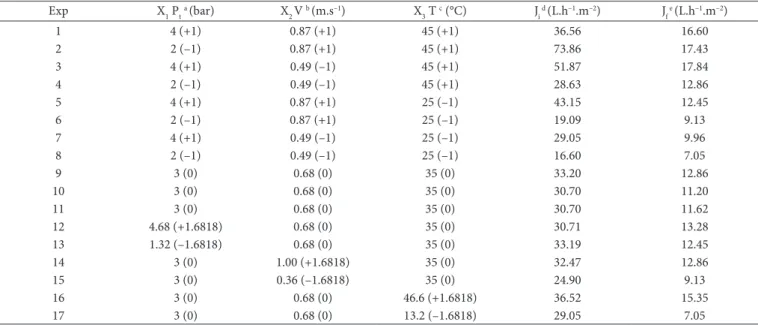
Table 1. Experimental design (23)with the real and coded values for the independent variables, and the values obtained for the initial flux (J i) and the response final flux (Jf).
Exp X1 Pta (bar) X
2 V b (m.s–1) X3 T c (°C) Ji d(L.h–1.m–2) Jf e(L.h–1.m–2)
1 4 (+1) 0.87 (+1) 45 (+1) 36.56 16.60
2 2 (–1) 0.87 (+1) 45 (+1) 73.86 17.43
3 4 (+1) 0.49 (–1) 45 (+1) 51.87 17.84
4 2 (–1) 0.49 (–1) 45 (+1) 28.63 12.86
5 4 (+1) 0.87 (+1) 25 (–1) 43.15 12.45
6 2 (–1) 0.87 (+1) 25 (–1) 19.09 9.13
7 4 (+1) 0.49 (–1) 25 (–1) 29.05 9.96
8 2 (–1) 0.49 (–1) 25 (–1) 16.60 7.05
9 3 (0) 0.68 (0) 35 (0) 33.20 12.86
10 3 (0) 0.68 (0) 35 (0) 30.70 11.20
11 3 (0) 0.68 (0) 35 (0) 30.70 11.62
12 4.68 (+1.6818) 0.68 (0) 35 (0) 30.71 13.28
13 1.32 (–1.6818) 0.68 (0) 35 (0) 33.19 12.45
14 3 (0) 1.00 (+1.6818) 35 (0) 32.47 12.86
15 3 (0) 0.36 (–1.6818) 35 (0) 24.90 9.13
16 3 (0) 0.68 (0) 46.6 (+1.6818) 36.52 15.35
17 3 (0) 0.68 (0) 13.2 (–1.6818) 29.05 7.05
aP t: pressure;
bV: tangential velocity; cT: temperature; dJ
i: initial permeate flux; eJ
(mg citric acid·100mL–1); non–reducing sugars; vitamin C (mg
citric acid ·100 mL–1) (Instituto Adolfo Lutz, 2005), and total
protein (g·100 mL–1 ; 991.20) (Association of Official Analytical
Chemists, 2005). The total carbohydrates were determined by difference, and the calorific value of the samples was calculated using the conversion factors according to the method described in RDC 360 (Brasil, 2001). The pH measurements were carried out at 25°C with a potentiometer (QUIMIS Q 400A, SP, Brazil), and the soluble solids (°Brix) using refractometer readings at 20°C (QUIMIS Q767A1, SP, Brazil). All analyses were carried out in triplicate. The colour parameters were measured with a previously calibrated CR-400 colorimeter (Konica Minolta, Osaka, Japan), adjusted to operate with a D65 illuminant and an observation angle of 10°. Luminosity (L*), red colour intensity (a*), and yellow colour intensity (b*) were measured.
2.5 Statistical analysis
The data were evaluated using experimental design (DOE) and analysis of variance (ANOVA). The average and standard deviation were also determined, and the Tukey test was applied (5% significance). The software STATISTICA version 7.0 (Statsoft Inc., 2001) was used for the statistical analysis.
3 Results and discussion
3.1 Microfiltration
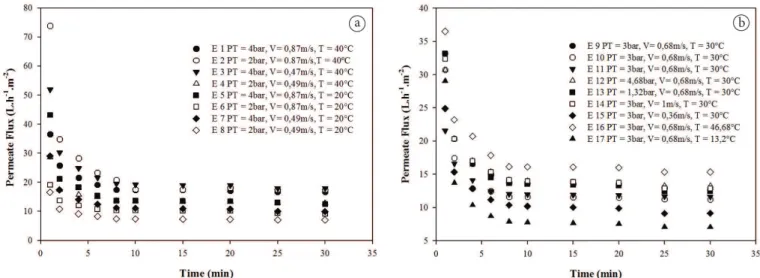
The results shown in Figure 1, obtained from the experimental design (Table 1), show the typical behaviour of a decline in the permeate flux during the first few minutes of the process due to phenomena which have been exhaustively studied in relation to membrane filtration processes. However, it was observed that regardless of the operational conditions, the permeate flux stabilized after 10 minutes of the process.
The phenomena involved in the reduction of the permeate flux observed in Figure 1 include concentration polarization, incrustation, and/or clogging of the membrane pores
(Cassano et al., 2010). According to Habert et al. (2006), in
operations with tangential flux there is generally an initial decline in the flux values which subsequently stabilize during the process.
During the first few minutes of the process, a reduction in the initial flux of over 55% was observed, characterizing concentration polarization. After 15 min of process, the flux dropped to a value which remained almost constant until the end of the experiment, which, according to Habert et al. (2006), corresponds to the fouling consolidation stage.
Table 1 shows the results of the flux observed in the 23
RCCD, obtained through the use of an experimental matrix comprised of 17 experimental runs. It is known that the economic viability and efficiency of clarification by membranes is evaluated mainly through the final permeate flux values. Therefore, the initial and final fluxes are presented. In many cases, the latter values were obtained after 1 h of filtration.
The highest initial fluxes were 73.86 L·h–1·m–2 (run 2)
and 51.87 L·h–1·m–2 (run 3). In addition, it can be observed
The permeate flux was expressed in J (L·h–1·m–2), calculated
according to Equation 1, and for each test a curve for the permeate flux as a function of time was obtained.
/ p p
J=V tA (1)
where: VP is the permeate volume (L) obtained in time t (h),
and AP is the membrane permeation area (m2).
The model of Constenla and Lozano (Constenla & Lozano, 1997), described by Equation 2, was fitted to the experimental data for the permeate flux obtained for each run. The computational software Statistica 7.0 was used for the regression analysis of the experimental data to obtain the value for the flux
decline rate λ (min–1) and the regression coefficient R2.
( ) t
f i f
J=J + J −J e−λ (2)
where: Jf is the final flux, Jithe initial flux, λ the flux decline rate, and t the filtration time.
Analysis of the resistance to permeate flux
The resistances were calculated for each run according to Jiraratananon and Chanachai (1996). The resistances which affect the flow rate, the fouling and polarization, were determined based on the cleaning of the membrane using water. The total resistance RT (m–1) was calculated using the values for
the final flux Jf (L·h–1·m–2), the permeate viscosity μ
P (mPa.s)and
the pressure P (bar) (Equation 3).
.( ) ( )
t t
f T
P T P f
P P
J R
R J
µ µ
= ⇒ = (3)
The membrane resistance RM (m–1) was calculated, using
pure water as the flux through a clean membrane Jw, as shown
in Equation 4.
.( ) ( )
t t
W M
W M W W
P P
J R
R J
µ µ
= ⇒ = (4)
The resistance promoted by fouling RF (m–1) was determined
by Equation 5 using the pure water flux after processing and
rinsing with water JWF (L·h–1·m–2) to remove the reversible
barriers (concentration polarization and polarized layer), leaving only the incrustation caused by the fouling.
( ) ( )
t t
Wf F M
W M F W Wf
P P
J R R
R R J
µ µ
= ⇒ = −
+ (5)
Since RT (m–1) is the sum of all of the resistances, the
resistance caused by concentration polarization RP (m–1) was
obtained by difference, as shown in Equation 6.
T M F P P T M F
R =R +R +R ⇒R =R −R −R (6)
2.4 Physicochemical analysis
The samples were analysed to determine the total solids
content (g·100 mL–1); lipid content (g·100 mL–1); fixed mineral
conditions need to be evaluated. The pressure, under the conditions studied, did not influence the final flux significantly (p > 0.05). The results of the analysis of variance (ANOVA)
of the variables studied through the 23 RCCD can be seen in
Table 2 and show that the linear effects of temperature and
tangential velocity on the final flux (L·h–1·m–2) were significant
at the 95% level.
3.2 Constenla and Lozano model
Values for the flux decline rate (λ) and the coefficient of
determination (R2) were obtained for each study condition and
are shown in Table 3. The flux decline rate (λ) is related to the accentuation of the decrease in the permeate flux and, in most cases, the higher the value of (λ), the steeper the curve at the beginning of the process.
It can be observed that the R2 values were high (above 92%),
demonstrating that the model of Constenla and Lozano provides a good fit with the experimental data. Values of the flux decline that the final permeate flux values after 30 min of processing
varied between 17.84 and 7.05 L·h–1·m–2. The high content of
carbohydrates present in sugarcane may explain, in part, the low fluxes obtained since they potentially cause fouling in processes in which membranes are used (Gan, 2001).
The effects of the pressure, tangential velocity, and temperature on the fluxes were estimated by statistical analysis of the results and are represented by the Pareto chart shown in Figure 2. It can be observed that the variables show a significant effect (p < 0.05) on the final permeate flux were the temperature (L = linear) and the tangential velocity (L). This means that the higher the value for the effect observed, the greater the influence on the response. The linear effects of temperature and velocity were positive, indicating that with an increase in temperature or tangential velocity, the final flux values increase.
The positive effect of the increase in the temperature on the final flux was expected since higher temperatures reduce the viscosity of the juice and increase its ability to permeate through the membrane (Mulder, 2006). Furthermore, the temperature affects the mobility of the polymeric chains of the membrane, making the polymeric material more flexible, allowing larger species to permeate the membrane (Goosen et al., 2002). However, the variation in the temperature of the feed stream must be applied following certain criteria in order to avoid the degradation or loss of the product nutrients. The temperature limit also needs to be established as a function of the thermoresistance of the membrane and economic aspects related to the energy consumption.
The effect of the tangential velocity on the final flux can be explained by the fact that this parameter generates a shear force on the membrane surface, reducing the formation of the polarized layer, and also by the turbulence generated, which increases the mass transfer, resulting in greater fluxes (Jiraratananon & Chanachai, 1996). High tangential velocity tends to prevent fouling and facilitate the subsequent membrane cleaning process. However, the increase in the tangential velocity requires more energy, and thus the optimum operation
Figure 1. Behaviour of the permeate flux during the microfiltration of sugarcane juice with passion fruit pulp added for (a) runs 1 to 8; (b) runs 9 to 17.
3.3 Determination of the resistances to permeate flux
According to Table 3, it can be seen that most of the flux resistance is attributable to concentration polarization and the polarized layer (51.3 to 82.66%), while the resistance due to fouling is responsible for 2.06 to 43.26%, and the resistance
rate of 0.1305 to 0.1481·min–1 were found when low pressure
was used in combination with low tangential velocities and temperatures (runs 4, 6, 8, 13 and 15). Under these conditions, the initial flux was low and stabilized within a short period, probably due to insufficient turbulence to promote high removal of particulates and to the likely increase in the concentration of macromolecules on the membrane surface. However, in run 2, even with low pressures, the flux decline rate was greater. This occurred due to the high initial flux, followed by a reduction of approximately 50 % in the flux in the first moments of the process.
In general, the flux decline rate is slightly higher (0.1732
to 0.2077 min–1) when there is an increase in the driving force,
that is, an increase in the pressure. This leads to a higher initial flux and the tendency toward fouling (runs 1, 3, 5, 7, and 12).
Figure 3 shows the fitting of the data from run 1 (Pt = 4 bar;
Vt = 0.87m·s–1 , and T = 45 °C) using the model of Constenla and
Lozano. It can be observed in Figure 3 that this model explains well the behaviour of the flux values. This tendency had been previously observed through the analysis of the R² values. The graph also shows that this model is predictive for the whole range of the process. The other runs showed similar behaviour,
as can be observed from the R2 values shown in Table 3.
Table 2. Analysis of variance (ANOVA) for the effects of the variables studied on the final permeate flux.
Sum of squares Degrees of freedom Mean square F P
(1) Pressure (L) 10.1540 1 10.1540 4.16595 0.080586
Pressure (Q) 4.3197 1 4.3197 1.77227 0.224820
(2) Velocity (L) 14.7088 1 14.7088 6.03471 0.043685
Velocity (Q) 0.0200 1 0.0200 0.00821 0.930339
(3) Temperature (L) 117.7372 1 117.7372 48.30497 0.000221
Temperature (Q) 0.0104 1 0.0104 0.00426 0.949790
(L): Linear; (Q): Quadratic.
Table 3. Values of resistance to permeate flux obtained by the model of resistances in series and values of the flux decline rate (λ) and regression coefficient (R2) obtained by the fitting of the Constenla & Lozzano model.
E µ* (mPa·s) RTx10–13 (m–1) R Mx10
–12 (m–1) R Fx10
–13 (m–1) R Px10
–13 (m–1) % R
M % RF % RP λ (min–1) R 2 (%)
1 0.86 9.56 1.87 1.61 7.77 1.96 16.81 81.23 0.1886 97.00
2 0.86 5.02 1.88 1.44 3.39 3.74 28.76 67.50 0.1876 96.00
3 0.86 9.34 1.90 1.70 7.45 2.03 18.19 79.78 0.2077 96.28
4 0.86 6.48 1.89 1.70 4.59 2.92 26.24 70.85 0.1307 94.45
5 1.39 8.07 1.89 1.80 6.07 2.35 22.37 75.28 0.1732 95.21
6 1.39 5.68 1.89 1.61 3.89 3.32 28.26 68.41 0.1305 96.41
7 1.39 10.4 1.89 1.81 8.42 1.81 17.33 80.86 0.1795 96.13
8 1.39 7.36 1.87 1.70 5.47 2.55 23.13 74.33 0.1406 92.88
9 1.09 7.73 1.90 1.52 6.02 2.46 19.65 77.90 0.1463 95.60
10 1.09 8.88 1.87 1.61 7.08 2.11 18.10 79.79 0.1538 94.00
11 1.09 8.56 1.87 1.52 6.85 2.19 17.78 80.03 0.1503 94.95
12 1.09 11.7 1.89 1.92 9.57 1.62 16.46 81.93 0.1774 96.00
13 1.09 3.51 1.89 1.52 1.81 5.37 43.26 51.37 0.1302 96.78
14 1.09 7.73 1.89 1.61 5.94 2.44 20.76 76.79 0.1398 96.07
15 1.09 10.9 1.85 1.70 9.00 1.70 15.64 82.66 0.1481 96.00
16 0.82 8.58 1.89 1.70 6.69 2.20 19.81 77.98 0.1355 96.03
17 1.68 9.12 1.88 1.81 7.12 2.06 19.81 78.13 0.1450 94.70
*permeate viscosity (Rezzadori et al., 2013).
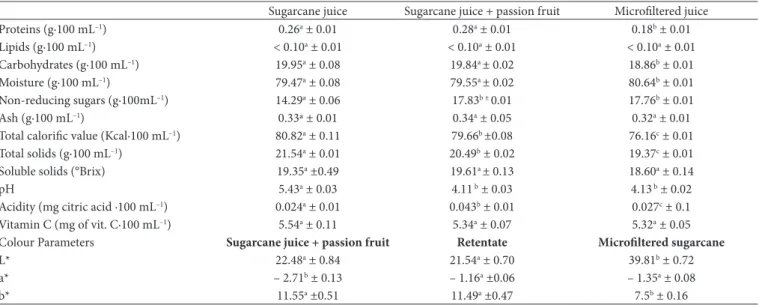
highly perishable. The addition of 5% passion fruit pulp to the sugarcane juice led to a drop in the pH value to 4.11 and, consequently, an increase in the acidity. The acidity is an important characteristic in terms of microbial control.
The microfiltration of the sugarcane juice with passion fruit pulp resulted in a permeate with slightly lower values (p > 0.05) of total solids, proteins, and carbohydrates. According to Carvalho et al. (2008), it is common for some of the product constituents to reduce during the clarification process using membranes, particularly those of higher molar mass such as pectin and starch. In general, it can be observed that the original sugarcane juice with passion fruit pulp and the microfiltered juice did not show significant differences (p > 0.05) in their composition. However, regarding the acidity, there was a reduction of around 62 % (0.043 to 0.027 mg citric acid·100
mL–1), indicating that during the microfiltration process there
is a concentration of non–dissociated acids without changing the concentration of hydrogen ions (Ushikubo et al., 2007).
The results of the parameters L*, a*, and b* of the different sugarcane juice samples also are given in Table 4. It can be observed that the sugarcane juice in the permeate stream has a greater luminosity in relation to the natural sugarcane juice and the retentate stream (p < 0.05), the L* value was higher by a factor of approximately 2. This tendency was expected since the microfiltration retains a large part of the macromolecules (starches and pectins) responsible for the turbidity. Nevertheless, the luminosity of all samples had a tendency to be dark (the L* scale varies from 0 to 100, from black to white), which may be related to the occurrence of enzymatic darkening reactions which lead to the formation of dark coloured compounds in the sugarcane juice immediately after extraction.
The a* values indicated that all of the samples tended toward a light green colour since the values obtained were negative but very close to zero. All of the samples had a b* value which indicated a tendency toward a yellow colour. Furthermore, a reduction in the b* value of around 65% was observed after caused by the membrane represented only 1.81 to 5.37% of the
total resistance.
It can also be observed in Table 3 that, in general, there is an increase in the resistance caused by concentration polarization and by the polarized layer when greater pressures are used (runs 1, 3, 5, 7, 11 and 12). As the pressure increases, the deposition of solutes on the membrane surface can occur, increasing the thickness of the polarized layer and, consequently, leading to an increase in the resistance. The strong influence of the resistance caused by concentration polarization and by the polarized layer, in this study, may be related to the presence of polysaccharides which are naturally present in sugarcane juice. According to Youn et al. (2004), polysaccharides, proteins and colloidal material are present in the solid fraction of juices. Thus, with an increase in the concentration of these constituents, crystals or gels are formed which, in turn, accumulate on the surface forming a secondary filtration layer that enhances the increase in the flux resistance.
It can also be noted that the total resistance to the permeate flux decreased with high temperatures and tangential velocities and also with lower pressures (runs 2, 6, and 13). This behaviour can be explained by the reduction in viscosity and increase in turbulence inside the channels of the hollow fibre module and the lower compaction of the polarized layer, generating less resistance to flow.
Since the second run (P= 2 bar; V= 0.87 m·s–1 e T= 45 °C)
showed one of the highest final permeate flux values, an average
flux of approximately 27 L·h–1·m–2, and lower total resistance to
the permeate flux, this run was selected for the evaluation of the physicochemical analysis.
3.4 Physicochemical analysis
As shown in Table 4, the soluble solids content (SS) was 19.35 °Brix, and sugarcane juice was shown to be slightly acid, with a pH close to 5.4. These pH values associated with the presence of high concentrations of sugars make the product
Table 4. Physicochemical characteristics of the sugarcane juice samples: pure (natural), with passion fruit pulp, and microfiltered.
Sugarcane juice Sugarcane juice + passion fruit Microfiltered juice
Proteins (g·100 mL–1) 0.26a ± 0.01 0.28a ± 0.01 0.18b ± 0.01
Lipids (g·100 mL–1) < 0.10a ± 0.01 < 0.10a ± 0.01 < 0.10a ± 0.01 Carbohydrates (g·100 mL–1) 19.95a ± 0.08 19.84a ± 0.02 18.86b ± 0.01
Moisture (g·100 mL–1) 79.47a ± 0.08 79.55a ± 0.02 80.64b ± 0.01
Non-reducing sugars (g·100mL–1) 14.29a ± 0.06 17.83b ± 0.01 17.76b ± 0.01
Ash (g·100 mL–1) 0.33ª ± 0.01 0.34a ± 0.05 0.32a ± 0.01
Total calorific value (Kcal·100 mL–1) 80.82a ± 0.11 79.66b ±0.08 76.16c ± 0.01
Total solids (g·100 mL–1) 21.54a ± 0.01 20.49b ± 0.02 19.37c ± 0.01
Soluble solids (°Brix) 19.35a ±0.49 19.61a ± 0.13 18.60a ± 0.14
pH 5.43a ± 0.03 4.11 b ± 0.03 4.13 b ± 0.02
Acidity (mg citric acid ·100 mL–1) 0.024a ± 0.01 0.043b ± 0.01 0.027c ± 0.1 Vitamin C (mg of vit. C·100 mL–1) 5.54a ± 0.11 5.34a ± 0.07 5.32a ± 0.05 Colour Parameters Sugarcane juice + passion fruit Retentate Microfiltered sugarcane
L* 22.48a ± 0.84 21.54a ± 0.70 39.81b ± 0.72
a* – 2.71b ± 0.13 – 1.16a ±0.06 – 1.35a ± 0.08
b* 11.55a ±0.51 11.49a ±0.47 7.5b ± 0.16
References
Association of Official Analytical Chemists – AOAC. (2005). Official methods of analysis of the association analytical chemists (18th ed.). Maryland: AOAC International.
Brasil, Ministério da Saúde, Agência Nacional de Vigilância Sanitária. (2001). Aprova o Regulamento Técnico sobre padrões microbiológicos para alimentos (Resolução RDC n° 12, 2 jan. 2001). Diário Oficial da República Federativa do Brasil. Seção 1, p. 17.
Carvalho, L. M. J., Castro, I. M., & Silva, C. A. B. (2008). A study of retention of sugars in the process of clarification of pineapple juice (Ananas comosus, L. Merril) by micro and ultrafiltration. Journal of Food Engineering, 87, 447-454. http://dx.doi.org/10.1016/j. jfoodeng.2007.12.015
Cassano, A., Conidi, C., & Drioli, E. (2010). Physico-chemical parameters of cactus pear (Opuntia ficus-indica) juice clarified by microfiltration and ultrafiltration processes. Desalination, 250, 1101-1104. http://dx.doi.org/10.1016/j.desal.2009.09.117
Cassano, A., Conidi, C., & Drioli, E. (2011). Clarification and concentration of pomegranate juice (Punica granatum L.) using membrane processes. Journal of Food Engineering, 107, 366-373. http://dx.doi.org/10.1016/j.jfoodeng.2011.07.002
Companhia Nacional de Abastecimento - CONAB. (2014). Safra de cana-de-açúcar 2013/14. Brasília: CONAB. Retrieved from http:// www.conab.gov.br.
Constenla, D. T., & Lozano, J. E. (1997). Hollow fibre ultrafiltration of apple juice: macroscopic approach, LWT- Food Science and Technology, 30, 373-378. http://dx.doi.org/10.1006/fstl.1996.0192 Duarte, D. L., Vieira, D. A. P., Machado, S. S., & Viana, V. M. (2010).
Caldo de cana consumido em vias públicas: uma revisão. In Anais do 2º Simpósio de Educação, Tecnologia e Sociedade, Goiás, Brasil. Gan, Q. (2001). Beer clarification by cross-flow microfiltration - effect
of surface hydrodynamics and reversed membrane morphology.
Chemical Engineering and Processing: Process Intensification, 40, 413-419. http://dx.doi.org/10.1016/S0255-2701(00)00127-6 Goosen, M. F. A., Sablania, S. S., Al-Maskaria, S. S., Al-Belushia, R.
H., & Wilfb, M. (2002). Effect of feed temperature on permeate flux and mass transfer coefficient in spiral-wound reverse osmosis systems. Desalination, 14, 367-372. http://dx.doi.org/10.1016/ S0011-9164(02)00345-4
Habert, A. C., Borges, C. P., & Nóbrega, R. (2006). Processos de Separação com Membranas.Rio de Janeiro: E-papers Serviços Editoriais. 180 p.
Instituto Adolfo Lutz – IAL. (2005). Normas analíticas do Instituto Adolfo Lutz (4. ed.). São Paulo: IAL.
Jiraratananon, R., & Chanachai, A. (1996). A study of fouling in the ultrafiltration of passion fruit juice. Journal of Membrane Science, 111, 39-48. http://dx.doi.org/10.1016/0376-7388(95)00270-7 Montgomery, D. C. (2005). Design and analysis of experiments (6. ed.).
USA: John Wiley & Sons. 643 p.
Moreno, R. M. C., Oliveira, R. C., & Barros, S. T. D. (2012). Comparison between microfiltration and addition of coagulating agents in the clarification of sugar cane juice. Acta Scientiarum Technology, 3, 413-419.
Mulder, M. (2000). Basic principles of membrane technology. Netherlands: Kluwer Academic Publishers. p. 564.
Nogueira, A. M. P., & Venturini Filho, W. G. (2007). Clarificação de caldo de cana por micro e ultrafiltração: comprovação de viabilidade técinica em experimentos preliminares. Brazilian Journal of Food Technology, 10, 57-62.
microfiltration (p < 0.05), indicating low intensity of the yellow colour of the permeate stream.
4 Conclusions
The results obtained in the experimental design suggest that certain processing conditions, such as, a temperature of 45 °C
and tangential velocity of 0.87 m·s–2, may increase the permeate
flux since the temperature and tangential velocity showed positive effects on the final permeate flux. The mathematical model proposed by Constenla & Lozano (1997) provided a good fit with the experimental data for the permeate flux and showed that the low pressure caused highest flux decline at the beginning of filtration. In general, the values for the flux decline rate were greater when higher pressures were applied. The resistance caused by concentration polarization and the polarized gel layer was, in most cases, the most important resistance. This phenomenon is reversible by cleaning with water and it does not change the membrane lifespan, such as fouling. There was a slightly increase in retention of soluble solids, protein, and carbohydrates when compared to the original sugarcane juice. In addition, the microfiltered juice had greater luminosity and a slight tendency toward a yellow colour, yet not expressively modifying the original aspect of the sugarcane juice. Therefore, it can be inferred that microfiltration is a viable technique to clarify sugarcane juice using milder temperature, resulting in lower energy costs and the maintenance of the product sensory characteristics.
Acknowledgements
The authors thank CAPES and FAPESP for the financial support.
Nomenclature
P pressure (bar)
Vt tangential velocity (m·s–1)
T temperature (°C)
J permeate flux (L·h–1·m–2)
VP permeate volume (L)
t filtration time (h)
AP membrane permeation area (m2) λ flux decline rate (min–1)
R² regression coefficient
Jf final flux (L·h–1·m–2)
Ji initial permeate flux (L·h–1·m–2)
RT total resistance (m–1)
RM membrane resistance (m–1)
RF fouling resistance (m–1)
RP concentration polarization resistance (m–1)
μP permeate viscosity (mPa.s)
μw water viscosity (mPa.s)
JW water flux in clean membrane(L·h–1·m–2)
JWF water flux after processing and water rinsing (L·h–1·m–2)
Engineering, 48, 1-9. http://doi/10.1111/j.1365-2621.2012.03124.x/ abstract
StatSoft Inc. (2001). Statistica (version 6.0). Tulsa: StatSoft Inc. Ushikubo, F. Y., Watanabe, A. P., & Viotto, L. A. (2007). Microfiltration
of umbu (Spondias tuberosa Arr. Cam.) juice. Journal of Membrane Science, 288, 61-66. http://dx.doi.org/10.1016/j.memsci.2006.11.003 Youn, K.-S., Hong, J.-H., Bae, D.-H., Kim, S.-J., & Kim, S.-D. (2004).
Effective clarifying process of reconstituted apple juice using membrane filtration with filter-aid pretreatment. Journal of Membrane Science, 228, 179-186. http://dx.doi.org/10.1016/j. memsci.2003.10.006
Nogueira, F. S., Ferreira, K. S., Carneiro Junior, J. B., & Passoni, L. C. (2009). Minerals in sugar cane syrup and cane juice. Ciência e Tecnologia de Alimentos, 29, 727-731. http://dx.doi.org/10.1590/ S0101-20612009000400005
Prati, P., Moretti, R. H., & Cardello, H. M. A. B. (2005). Elaboração de bebida composta por mistura de garapa parcialmente clarificada e sucos de frutas ácidas. Ciência e Tecnologia de Alimentos, 25, 147-152. http://dx.doi.org/10.1590/S0101-20612005000100024 Rezzadori, K., Petrus, R. R., Benedetti, S., Carminatti, C. A., & Petrus, J.