Original
Received 4/2/2010 Accepted 3/11/2010 (004642)
1 Embrapa Brasileira de Pesquisa Agropecuária, Embrapa Soja, CP 231, CEP 86001-970, Londrina, PA, Brazil, e-mail: [email protected] 2 Departamento de Ciência e Tecnologia de Alimentos, Universidade Estadual de Londrina – UEL, Londrina, PR, Brazil
* Corresponding author
A statistical approach to define some tofu processing conditions
Uma abordagem estatística para definir algumas condições para processamento de tofu
Vera de Toledo BENASSI1*, Fábio YAMASHITA2,Sandra Helena PRUDENCIO2
1 Introduction
Tofu is a white to pale yellow colored product and has a texture somewhat like a soft white cheese or firm yogurt (EVANS; TSUKAMOTO; NIELSEN, 1997). It is a protein coagulum obtained from soymilk.
Tofu processing has changed little in the last 2000 years (HOU; CHANG; SHIH, 1997). The processing techniques may vary according to the manufacturer, but the basic steps include soybean soaking and grinding, soymilk boiling, and the addition of one or more coagulants (CUI et al., 2004). The ground soybean material or the soymilk obtained after filtration is heated in order to denature the proteins. Next, a coagulant is added to form the protein matrix that gives the product the appropriate texture (POYSA; WOODROW; YU, 2004).
Soymilk heating for tofu production aims to decrease the microbial flora, deactivate anti-nutritional compounds, and denature the protein. Denaturation is an essential phenomenon in the formation of the protein gel. Heating causes the globular native structure of soybean protein to unfold, thus exposing functional groups formerly hidden inside the molecule and
allowing for protein-protein and protein-water interactions to take place; the three-dimensional network that makes up the gel depends on the balance among these interactions (DAMODARAN, 1997; FENNEMA, 1996; KOHYAMA; SANO; DOI, 1995; LIU et al., 2004; OAKENFULL; PEARCE; BURLEY, 1997).
The type of gel formed by proteins is mainly influenced by the amino acid composition although the medium conditions (pH and ionic force) can also affect it. Proteins containing over 31.5% non-polar amino acid residues per mol tend to form opaque and irreversible coagulum-type gels, as it happens with soybean proteins; proteins with a high content of polar residues form translucent gels (DAMODARAN, 1997; FENNEMA, 1996; OAKENFULL; PEARCE; BURLEY, 1997).
Another requirement for the formation of gels is the presence of coagulants. Tofu is usually produced by coagulating soybean soymilk with either salts (CaSO4 or MgCl2) or acids (usually glucone-δ-lactone, GDL). The coagulants are used either alone or in combination to obtain specific tofu texture Resumo
O objetivo deste trabalho foi produzir tofu a partir da cultivar de soja BRS 267, utilizando diferentes condições de processamento, e avaliar
a influência dos tratamentos sobre a qualidade do produto. Utilizou-se um planejamento experimental do tipo fatorial fracionário 25-1, no
qualas variáveis independentes (tratamento térmico, concentração de coagulante, tempo de coagulação, corte do coágulo e tempo de dessora) foram testadas em dois diferentes níveis. A variável resposta analisadas foram dureza, rendimento, teor de sólidos totais e de proteínas do tofu, sendo obtidos modelos polinomiais para cada uma delas. As condições de processamento escolhidas para a obtenção de tofu com
as características desejadas (~4N de dureza, rendimento de 306 g tofu.100 g–1 grãos, 12g proteínas.100 g–1 tofu e 22 g sólidos.100 g–1 tofu)
foram: tratamento térmico longo (após a ebulição, aquecer por mais 10 minutos, em banho-maria), 2% p/p de coagulante sulfato de cálcio di-hidratado, 10 minutos de coagulação, corte do coágulo e 30 minutos de dessora.
Palavras-chave: soja (Glycinemax); dureza; sulfato de cálcio di-hidratado; rendimento; formação de gel; dessora. Abstract
The aim of this work was to make tofu from soybean cultivar BRS 267 under different processing conditions in order to evaluate the influence
of each treatment on the product quality. A fractional factorial 25-1 design was used, in which independent variables (thermal treatment,
coagulant concentration, coagulation time, curd cutting, and draining time) were tested at two different levels. The response variables studied were hardness, yield, total solids, and protein content of tofu. Polynomial models were generated for each response. To obtain tofu
with desirable characteristics (hardness ~4 N, yield 306 g tofu.100 g–1 soybeans, 12 g proteins.100 g–1 tofu and 22 g solids.100 g–1 tofu), the
following processing conditions were selected: heating until boiling plus 10 minutes in water bath, 2% dihydrated CaSO4 w/w, 10 minutes
coagulation, curd cutting, and 30 minutes draining time.
content, total solids, and tofu yield using a fractional factorial design 25-1.
2 Material and methods
2.1 Material
Soybean cultivar BRS 267 was harvested in Ponta Grossa, Paraná State, Brazil in 2006/2007 and was used to produce tofu. This cultivar was developed by the Embrapa Soybean Genetic Improvement Program and has several desirable characteristics for the production of tofu such as large-sized beans (22-25 g/100 beans), a light-colored seed coat and hilum, and a mild and pleasant flavor (EMBRAPA, 2008).
Dihydrated CaSO4 from Wako (Japan) was used as a coagulant.
Commercial tofu samples were purchased in grocery stores in Londrina, Paraná, Brazil. Two samples purchased from the same industrialized brand had the following information on their package labels: extra soft tofu (silken type) coagulated with calcium sulfate and soft tofu (momen type) produced using GDL. The other two commercial products were handmade using magnesium sulfate (Epsom salt) and were labeled “handmade 1” (soft) and “handmade 2” (firm).
The experiments were carried out at the Embrapa Soybean laboratories and the Food Sci.&Tech. Department of the University of Londrina, Paraná, Brazil.
and flavor characteristics (EVANS; TSUKAMOTO; NIELSEN, 1997; CUI et al., 2004).
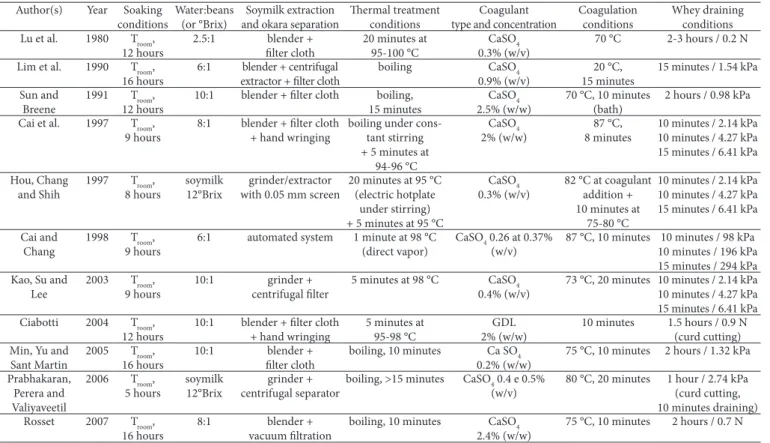
Important variables in tofu processing include soybean soaking time and temperature, soybean-to-water ratio during soaking, soybean grinding method, filtration before or after heating, thermal treatment time and temperature, coagulation time and temperature, coagulant type and concentration, stirring time and speed before coagulation, and draining time and pressure (CAI et al., 1997). Some conditions that have been employed by researchers worldwide are described in Table 1.
The two main types of tofu are called silken and momen.
Silken tofu is formed by the coagulation of soymilk in the
product package itself, while momen tofu is obtained by cutting curd and then pressing it into a mold to partially drain whey. Depending on the amount of whey drained, the resulting tofu may be more or less firm; however, momen tofu is always firmer than silken tofu and has a less homogeneous texture since the curd is cut and reshaped under pressure (EVANS; TSUKAMOTO; NIELSEN, 1997; CUI et al., 2004). Consumer preferences for tofu type and texture vary according to cultures and personal tastes. Most Chinese, for example, prefer firm tofu that can be cut into pieces, which is known as Chinese-style tofu (TSAI et al., 1981).
Considering that there are important sensory, nutritional, and technological features that affect the acceptance of tofu, the objective of this work was to produce tofu from soybean cultivar BRS 267 by different processing conditions and assess the influence of experimental variables on hardness, protein
Table 1. Momen tofu production conditions employed in several studies.
Author(s) Year Soaking conditions
Water:beans (or °Brix)
Soymilk extraction and okara separation
Thermal treatment conditions
Coagulant type and concentration
Coagulation conditions
Whey draining conditions Lu et al. 1980 Troom,
12 hours
2.5:1 blender + filter cloth
20 minutes at 95-100 °C
CaSO4
0.3% (w/v)
70 °C 2-3 hours / 0.2 N Lim et al. 1990 Troom,
16 hours
6:1 blender + centrifugal extractor + filter cloth
boiling CaSO4
0.9% (w/v)
20 °C, 15 minutes
15 minutes / 1.54 kPa Sun and
Breene
1991 Troom, 12 hours
10:1 blender + filter cloth boiling, 15 minutes
CaSO4 2.5% (w/w)
70 °C, 10 minutes (bath)
2 hours / 0.98 kPa
Cai et al. 1997 Troom,
9 hours
8:1 blender + filter cloth + hand wringing
boiling under cons-tant stirring + 5 minutes at
94-96 °C
CaSO4
2% (w/w)
87 °C, 8 minutes
10 minutes / 2.14 kPa 10 minutes / 4.27 kPa 15 minutes / 6.41 kPa
Hou, Chang and Shih
1997 Troom,
8 hours
soymilk 12°Brix
grinder/extractor with 0.05 mm screen
20 minutes at 95 °C (electric hotplate
under stirring) + 5 minutes at 95 °C
CaSO4
0.3% (w/v)
82 °C at coagulant addition + 10 minutes at
75-80 °C
10 minutes / 2.14 kPa 10 minutes / 4.27 kPa 15 minutes / 6.41 kPa
Cai and Chang
1998 Troom,
9 hours
6:1 automated system 1 minute at 98 °C (direct vapor)
CaSO4 0.26 at 0.37%
(w/v)
87 °C, 10 minutes 10 minutes / 98 kPa 10 minutes / 196 kPa 15 minutes / 294 kPa Kao, Su and
Lee
2003 Troom, 9 hours
10:1 grinder + centrifugal filter
5 minutes at 98 °C CaSO4 0.4% (w/v)
73 °C, 20 minutes 10 minutes / 2.14 kPa 10 minutes / 4.27 kPa 15 minutes / 6.41 kPa Ciabotti 2004 Troom,
12 hours
10:1 blender + filter cloth + hand wringing
5 minutes at 95-98 °C
GDL 2% (w/w)
10 minutes 1.5 hours / 0.9 N (curd cutting) Min, Yu and
Sant Martin
2005 Troom, 16 hours
10:1 blender + filter cloth
boiling, 10 minutes Ca SO4 0.2% (w/w)
75 °C, 10 minutes 2 hours / 1.32 kPa Prabhakaran,
Perera and Valiyaveetil
2006 Troom, 5 hours
soymilk 12°Brix
grinder + centrifugal separator
boiling, >15 minutes CaSO4 0.4 e 0.5% (w/v)
80 °C, 20 minutes 1 hour / 2.74 kPa (curd cutting, 10 minutes draining) Rosset 2007 Troom,
16 hours
8:1 blender + vacuum filtration
boiling, 10 minutes CaSO4 2.4% (w/w)
chemical results was carried out using the “ANOVA” module of the Statistica software.
Tofu production and yield
Soybeans (150 g) were soaked at room temperature for 12 hours in 500 mL of distilled water. The beans were then drained and weighed to assess the amount of absorbed water.
Distilled water at 100 °C was added to the soaked beans resulting in a final bean-to-water ratio of 1:8 (w/w). The amount of water added was enough to make up 1200 mL; the water absorbed during soaking was also taken into account. Hot grinding was performed with a domestic blender (Arno, Performa Magiclean model, Brazil) for 3 minutes at speed 3 on a scale of 1 to 4.
Soymilk and residue (okara) were separated by vacuum filtration for 10 minutes in a 2 L Kitasato flask and Büchner funnel (15 cm i.d.) lined with a thin nylon fabric (cheesecloth). The fractions were weighed to assess the soymilk yield.
Next, an 8200 mL aliquot of soymilk was thermally treated in a covered aluminum pot directly heated on a semi-industrial butane stove (Dako, Couraçado model, Brazil). After heating, the soymilk was transferred to a 4 L plastic beaker and allowed to cool to about 75 °C, the suitable coagulation temperature.
The soymilk and the coagulant were homogenized in a 2 L glass beaker and then placed in a Dubnoff water bath at 30 °C (Nova Técnica, Brazil). The coagulant was prepared in advance by dissolving dihydrated CaSO4 in 40 mL of distilled water at 50 °C.
The curd was cut using a lyre-shaped domestic cutter in two slow cross movements.
Trapezoidal plastic molds with approximate volume of 500 mL and top area of about 85 cm2 were used to shape the curd. The molds had perforations on sides and bottom, and were lined with cheesecloth, which was fixed onto the outer rim with an
2.2 Methods
Experimental design
A 2-level factorial experimental design with five factors was used to obtain polynomial models as follows (Equation 1):
Y=b
0 + b1x1 + b2x2 + b3x3 + b4x4 + b5x5 + b12x1x2 + b13x1x3 +
+ b
14x1x4 + b15x1x5 + b23x2x3 + b24x2x4 + b25x2x5 +
+ b
34x3x4 + b35x3x5 + b45x4x5
(1)
where: Y is the dependent variable (or response), x1 to x5 are independent variables (or factors), x1x2 to x4x5 are two-way interactions, bn are coefficients, and b0 (independent term) is the mean experimental value for the response. A 25-1 fractional factorial experimental design has been carried out affording resolution V and accuracy in the analysis of the first and second order effects (or two-way interactions).
Soaking and grinding conditions, coagulant type, coagulation temperature, and whey draining pressure were established according to data in the literature (Table 1) and preliminary unpublished trial data. Thermal treatment conditions, coagulant concentration, coagulation time, curd cutting (or not), and draining time were selected as independent variables in the present experiment. Each of these variables was tested at two different levels, and were coded as +1 (maximum) and –1 (minimum). Tofu hardness, yield, total solids, and protein content were chosen as dependent variables (or responses). The experimental design comprised 16 previously randomized runs, as shown in Table 2.
Statistical analysis
Responses (tofu hardness, yield, total solids, and protein content) were analyzed using the “Experimental Design” module of Statistica 5.0 software (STATSOFT, 1995). The effects of coded independent variables (+1, –1) and the respective significance levels (p) were calculated. Variance analysis of physical and
Table 2. Fractional factorial design 25-1 for tofu production with the values of coded and uncoded variables.
Run Thermal treatment(1) Coagulant concentration (2) (%) Coagulation time (minutes) Curd cutting Draining time (minutes)
1 short (–1) 2.0 (–1) 10 (–1) no (–1) 60 (+1)
2 long (+1) 2.0 (–1) 10 (–1) no (–1) 30 (–1)
3 short (–1) 2.5 (+1) 10 (–1) no (–1) 30 (–1)
4 long (+1) 2.5 (+1) 10 (–1) no (–1) 60 (+1)
5 short (–1) 2.0 (–1) 20 (+1) no (–1) 30 (–1)
6 long (+1) 2.0 (–1) 20 (+1) no (–1) 60 (+1)
7 short (–1) 2.5 (+1) 20 (+1) no (–1) 60 (+1)
8 long (+1) 2.5 (+1) 20 (+1) no (–1) 30 (–1)
9 short (–1) 2.0 (–1) 10 (–1) yes (+1) 30 (–1)
10 long (+1) 2.0 (–1) 10 (–1) yes (+1) 60 (+1)
11 short (–1) 2.5 (+1) 10 (–1) yes (+1) 60 (+1)
12 long (+1) 2.5 (+1) 10 (–1) yes (+1) 30 (–1)
13 short (–1) 2.0 (–1) 20 (+1) yes (+1) 60 (+1)
14 long (+1) 2.0 (–1) 20 (+1) yes (+1) 30 (–1)
15 short (–1) 2.5 (+1) 20 (+1) yes (+1) 30 (–1)
16 long (+1) 2.5 (+1) 20 (+1) yes (+1) 60 (+1)
3 Results and discussion
3.1 Comparison of experimental and commercial tofu
Tofu yield varied with experimental runs ranging from 173 to 308 g tofu.100 g–1 beans (Table 3). The literature reports results from 169 g.100 g–1 beans (LU; CARTER; CHUNG, 1980) to 552 g.100 g–1 beans (CAI et al., 1997). Intermediate values were found by several authors, such as Lim et al. (1990), Sun and Breene (1991), Hou, Chang and Shih (1997), Cai and Chang (1998), Kao, Su and Lee (2003), Min, Yu and Sant Martin (2005) and Prabhakaran, Perera and Valiyaveetil (2006).
The wide diversity of results is due to the different conditions employed by researchers, ranging from soybean cultivars to processing parameters. The experimental values were close to those found for Brazilian cultivars. Cultivars BRS 133 and BRS 213, according to Ciabotti (2004), yielded 275 and 287 g tofu.100 g–1 beans, respectively. Using BRS 267, Rosset (2007) obtained 217 g tofu.100 g–1 beans.
Experimental tofu hardness varied from 1.8 to 5.6 N (Table 3), while for commercial tofu, it ranged from 3.2 to 7.1 N (Table 3). With the exception of run 5, all treatments resulted in hardness values similar to those of commercial tofu, which indicates that the texture of experimental tofu would probably be accepted by potential consumers.
Hardness values in the literature varied widely. This variability cannot be attributed only to cultivars and the different tofu processing conditions employed by the several elastic band. A 9.8 N force was uniformly applied on the whole
surface of the product, thus producing a pressure of 1.15 kPa.
The tofu yield was calculated according to the following equation, which gives the tofu-to -soybean mass ratio corrected to the partial volume of soymilk employed (Equation 2):
100 820
soymilk tofu
soybeans
m m
Tofu yield m
= × × (2)
Assessment of experimental and commercial tofu
Tofu hardness (expressed in Newtons) was measured in a TA.XT2i texturometer (Stable Micro Systems, England) using a 35 mm diameter cylindrical aluminum probe (P35) and cylindrical samples (30 mm diameter x 22 mm height) compressed up to 73% deformation. The pre-test, test, and post-test speeds used were 2.0, 2.0, and 4.0 mm/s, respectively (ROSSET, 2007).
Total solids and protein content in tofu were assessed by standard methods (ASSOCIATION…, 1995). One gram of tofu was dried in an oven heated to 105 °C until constant weight was reached (about 16 hours), and total solids were expressed as g solids.100 g–1 tofu. Protein content, expressed in g protein.100 g–1 tofu (as is) was calculated by multiplying the nitrogen content by a correction factor of 6.25. Tofu nitrogen was measured by Kjeldahl method using an automated apparatus (FOSS, Tecator 2400 model, Denmark) for distillation and titration.
Table 3. Characteristics of commercial and experimental tofu.
Samples Yield (g tofu.100 g–1 beans) Hardness (N) Protein content (g.100 g–1tofu) Total solids (g.100 g–1tofu)
Commercial(1)
Extra soft - 3.2 ± 0.2 6.7 ± 0.3 15.1 ± 0.6
Soft - 3.7 ± 0.2 8.3 ± 0.0 15.3 ± 0.6
Handmade 1 - 4.3 ± 1.3 9.5 ± 0.3 18.3 ± 0.5
Handmade 2 - 7.1 ± 0.4 10.9 ± 0.1 21.5 ± 0.3
Experimental(2)
1 237.5 3.5 ± 0.2 11.2 ± 0.1 20.4 ± 2.2
2 282.3 3.7 ± 0.2 8.0 ± 0.4 18.4 ± 1.3
3 249.3 3.9 ± 0.3 9.8 ± 0.2 17.4 ± 0.1
4 172.7 3.5 ± 0.2 8.7 ± 0.3 17.3 ± 0.2
5 294.1 1.8 ± 0.2 5.5 ± 0.8 14.4 ± 0.5
6 260.2 3.9 ± 0.7 7.0 ± 0.1 13.1 ± 0.4
7 258.4 3.3 ± 0.3 9.8 ± 1.2 18.7 ± 1.1
8 279.9 3.7 ± 0.3 9.9 ± 0.7 20.1 ± 1.0
9 258.3 5.6 ± 0.6 12.3 ± 1.5 20.1 ± 0.1
10 255.1 4.3 ± 0.3 9.5 ± 2.8 19.4 ± 1.9
11 255.4 4.5 ± 0.3 9.5 ± 0.8 20.5 ± 0.9
12 277.7 4.3 ± 0.3 10.2 ± 0.2 18.9 ± 0.5
13 239.7 4.6 ± 0.3 11.1 ± 1.1 17.9 ± 0.4
14 308.2 3.8 ± 0.2 10.6 ± 1.1 18.5 ± 0.8
15 247.1 4.6 ± 0.2 8.2 ± 0.2 16.2 ± 0.0
16 235.2 5.1 ± 0.4 10.5 ± 0.7 20.4 ± 0.3
(1)data for hardness, protein content and total solids are means + SD of five, two, and two repetitions, respectively. (2)data for hardness, protein content and total solids are means + SD
SOLIDS =18.31 + 0.51x
1 + 0.59x2 –0.65x3 + 0.56x4 +
+ 0.56x
5 + 0.80x1x3 + 0.14x1x4 –1.03x1x5 + 1.35x2x3 –
–0.79x
2x4 –0.09x2x5 + 0.33x3x5 –0.19x4x5
(6)
These equations allow estimating response values as a function of five factors within the studied range of each factor.
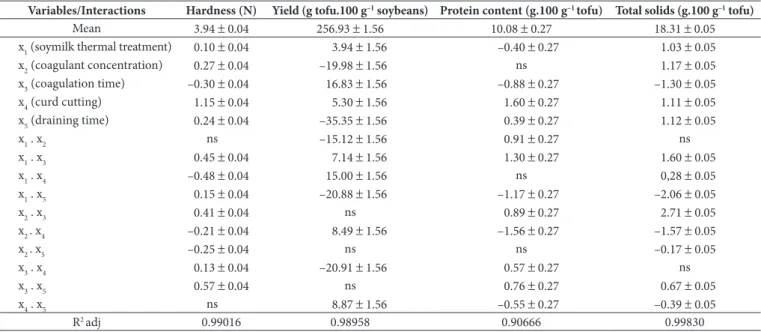
3.3 Effects of the factors on the responses
The calculated effects of each factor on the responses are shown in Table 4.
All treatments resulted in the formation of tofu structure, which means that all the different tested conditions resulted in tofu although that of assay 5 was not fit for a momen-type product.
As can be seen in Table 4, factor x1 (thermal treatment) showed a positive correlation with tofu solids, hardness and yield, which increased by 1 g.100 g–1 tofu (5.6%), 0.1 N (2.5%), and 3.9 g tofu.100 g–1 beans (1.5%) from its lowest to its highest level. However, it was negatively correlated with the protein content, showing a decrease of about 0.4 g.100 g–1 tofu (4%). The impact of this factor was small, possibly because the range between levels –1 and +1 was narrow causing almost no difference when x1 was carried out at one level or another.
However, it is important to point out that at both levels, the degree of denaturation was suitable for tofu production since insufficient thermal treatment would not have provided conditions for gel formation, whereas overtreatment would have caused excessive protein denaturation, which in turn would not lead to the formation of a three-dimensional structure, but to an insoluble precipitate due to many interactions between unfolded protein chains instead of protein-water binding (OAKENFULL; PEARCE; BURLEY, 1997).
As for the coagulant concentration (x2), its variation had an impact mainly on the tofu yield. It can be noted that an increase in coagulant from 3 g to 3.75 g resulted in an undesirable decrease in tofu yield, about 20 g tofu.100 g–1 beans, or about 8% less than the average amount. However, other effects of increased amount of coagulant would be advantageous, such as a potential increase of 0.27 N in hardness (6.9%) and 1.17 g solids.100 g–1 tofu (6.4%).
Other researchers also reported a negative correlation between yield and the amount of coagulant. Prabhakaran, Perera and Valiyaveetil (2006), quoting the earlier study by Sun and Breene (1991), attributed it to increased syneresis and loss of curd whey since a greater concentration of calcium ions intensifies protein-protein interactions by forming a greater number of salt bridges, thus making the matrix more compact. Both studies, as well as the present one, substantiated this hypothesis based on increased tofu hardness. The two coagulant levels adopted in this work are the same as those used by Prabhakaran, Perera and Valiyaveetil (2006), which allows comparison of the experimental results of these researchers with those calculated by the theoretical model. Increasing the amount of coagulant from 0.4 to 0.5% (w/v) caused yield to fall by 3.6 g.100 g–1 (about 3%); in contrast, the total solids rose by authors. The hardness assessment methods also varied, since
equipment operating conditions were study-specific and were not standardized. The shape and size of the samples varied, as did the measurement sites (outer or inner parts of the product). Sun and Breene (1991) and Min, Yu and Sant Martin (2005) found values close to 1 N, whereas Lu et al. (1980) reported 11.5 N and Cai et al. (1997) obtained products with hardness ranging from 14 to 37 N. Despite the discrepancies found in the literature, most studies reported values from 2.5 to 7.25 N (HOU; CHANG; SHIH, 1997; CAI; CHANG, 1998; KAO; SU; LEE, 2003; CIABOTTI, 2004; PRABHAKARAN; PERERA; VALIYAVEETIL, 2006; ROSSET, 2007), which are close to those obtained for both experimental and commercial tofu samples.
Experimental tofu solids varied from 13.1 to 20.5 g.100 g–1, while the commercial sample values were between 15.1 and 21.5 g.100 g–1 (Table 3). With the exception of assays 5 and 6, the values found for all the treatments fell within the commercial product ranges. Lim et al. (1990) obtained tofu with 23.8 g solids.100 g–1, in agreement with the current results. However, values as low as 10.1 g.100 g–1 (CAI; CHANG, 1998) have also been reported. Other authors such as Lu et al. (1980), Cai et al. (1997), Kao, Su and Lee (2003), Min, Yu and Sant Martin (2005), Prabhakaran, Perera and Valiyaveetil (2006), and Rosset (2007) found intermediate results.
Experimental tofu protein content varied from 5.5 to 12.3 g.100 g–1, while commercial tofu values ranged from 6.7 to 10.9 g.100 g–1 (Table 3). Assays 1, 9, and 13 resulted in tofu protein contents above commercial tofu range, which is an advantage from the nutritional point of view. These results agree with those in the literature, which varied from 4.5 (ROSSET, 2007) to 12.2 g protein.100 g–1 tofu (LIM et al., 1990), while Lu et al. (1980), Cai et al. (1997), Cai and Chang (1998), and Min, Yu and Sant Martin (2005) found intermediate values.
Among all experimental runs, assay 5 was an exception since it showed the lowest hardness and protein values, the second lowest solids content, but the second highest yield. These results indicate that the combination of conditions used in this particular run resulted in a product with large water retention capacity and very low hardness (56% of that of commercial extra soft tofu).
3.2 Factorial design analysis
The analysis of each dependent variable or response in isolation resulted in the following mathematical models, with R2
adj values ≥ 0.90 (Equations 3, 4, 5, 6):
HARDNESS = 3.94 + 0.05x
1 + 0.14x2 –0.15x3 + 0.58x4 +
+ 0.12x
5 + 0.22x1x3 –0.24x1x4 + 0.08x1x5 + 0.20x2x3 –
– 0.11x
2x4 –0.13x2x5 + 0.06x3x4 + 0.29x3x5
(3)
YIELD = 256.93 + 1.97x
1 –9.99x2 + 8.41x3 + 2.65x4 –
– 17.67x
5 –7.56x1x2 + 3.57x1x3 + 7.50x1x4 –10.44x1x5 + + 4.25x
2x4 – 10.46x3x4 + 4.43x4x5
(4)
PROTEIN = 10.08 –0.20x
1 –0.44x3 + 0.80x4 + 0.20x5 +
+ 0.45x
1x2 + 0.65x1x3 – 0.59x1x5 + 0.45x2x3 –0.78x2x4 + 0.28x
3x4 + 0.38x3x5 –0.27x4x5
Both the studies by Ciabotti (2004) and Prabhakaran, Perera and Valiyaveetil (2006) employed curd cutting in tofu processing. In the former, although GDL was used as a coagulant, the yield was similar to that obtained in the current study, while the latter reported values almost twice as high.
Draining time (x5) is the time during which the curd is submitted to an external pressure in order for it to release whey. Therefore, the longer the draining time is, the more whey the curd loses due to the mechanical action applied. It can be seen in Table 4 that this factor had a great impact on tofu yield decreasing it by 35 g.100 g–1 beans (13.6%) when the draining time was increased from 30 to 60 minutes. Total solids, hardness, and protein content showed a positive correlation with draining time since the decrease in liquid caused a proportional increase in solid matter (6.1%) and protein content (3.9%) and helped increase hardness (6.1%) (PRABHAKARAN; PERERA; VALIYAVEETIL, 2006). Both the obtained yield and the draining conditions employed by Ciabotti (2004) were similar to those of the current experiment.
3.4 Determination of the tofu processing conditions
The interpretation of the data in Table 4, in light of the analysis of the relative importance of first and second order effects and the value ranges desired for each response, allowed for the determination of the best conditions for tofu production.
Among experimental responses, texture is the only measure related to the product sensory acceptance; thus, it takes priority over the others. The current study aims at obtaining a tofu texture which is neither too soft nor too firm, with hardness values above the experimental average, but under that of firm commercial tofu (handmade 2), that is, between 3.94and 7.1 N. Therefore, the assessment of the hardness of the commercial products afforded a reference for the assessment of experimental tofu. It is not possible to define an ideal hardness value, since 0.3 g.100 g–1 (1.4%), and hardness, by 0.4 N (8.9%). Although
the effects observed by Prabhakaran, Perera and Valiyaveetil (2006) were different in intensity, they followed the same general trends of the results of the current study.
Coagulation time (x3) influenced mainly tofu yield, which increased about 17 g.100 g–1 of beans (6.6%) when the coagulation time was increased from 10 to 20 minutes. Hardness and total solids showed negative correlations with this factor, that is, they decreased 0.3 N (7.6%) and 0.9 g.100 g–1 (4.9%), respectively. The results suggest that the increase in the coagulation time leads to the balance between protein-protein and protein-water interactions, thus contributing to both the formation of the three-dimensional protein network and water retention. High retention of water in the curd would be responsible for a proportional reduction in solids and protein content of tofu due to a higher yield and lower gel density and hardness. Prabhakaran, Perera and Valiyaveetil (2006) compared sulfates and chlorides as coagulants and found that at the same concentration, sulfates act more slowly than chlorides upon contact with soymilk requiring at least 8 minutes before coagulation can be observed.
Curd cutting (x4) is an optional step in tofu processing depending on the desired product. Physical rupture of the three-dimensional curd network allows for the release of the water retained inside the pores by capillarity (FENNEMA, 1996). In the current study, cutting affected mainly tofu hardness, increasing it by 1.15 N (29%). Tofu protein content and total solids also showed a positive correlation with curd cutting (potential increases of 16 and 6%, respectively), meaning water loss and minimal solid leaching took place. Tofu yield variation was not consistent with this explanation since the effect of curd cutting, however small, was positive, indicating that cutting can increase tofu yield by about 5 g.100 g–1 beans (2%).
Table 4. Effects of independent variables (factors) on dependent variables (responses).
Variables/Interactions Hardness (N) Yield (g tofu.100 g–1 soybeans) Protein content (g.100 g–1 tofu) Total solids (g.100 g–1 tofu)
Mean 3.94 ± 0.04 256.93 ± 1.56 10.08 ± 0.27 18.31 ± 0.05
x1 (soymilk thermal treatment) 0.10 ± 0.04 3.94 ± 1.56 –0.40 ± 0.27 1.03 ± 0.05 x2 (coagulant concentration) 0.27 ± 0.04 –19.98 ± 1.56 ns 1.17 ± 0.05 x3 (coagulation time) –0.30 ± 0.04 16.83 ± 1.56 –0.88 ± 0.27 –1.30 ± 0.05 x4 (curd cutting) 1.15 ± 0.04 5.30 ± 1.56 1.60 ± 0.27 1.11 ± 0.05 x5 (draining time) 0.24 ± 0.04 –35.35 ± 1.56 0.39 ± 0.27 1.12 ± 0.05
x1 . x2 ns –15.12 ± 1.56 0.91 ± 0.27 ns
x1 . x3 0.45 ± 0.04 7.14 ± 1.56 1.30 ± 0.27 1.60 ± 0.05
x1 . x4 –0.48 ± 0.04 15.00 ± 1.56 ns 0,28 ± 0.05
x1 . x5 0.15 ± 0.04 –20.88 ± 1.56 –1.17 ± 0.27 –2.06 ± 0.05
x2 . x3 0.41 ± 0.04 ns 0.89 ± 0.27 2.71 ± 0.05
x2 . x4 –0.21 ± 0.04 8.49 ± 1.56 –1.56 ± 0.27 –1.57 ± 0.05
x2 . x5 –0.25 ± 0.04 ns ns –0.17 ± 0.05
x3 . x4 0.13 ± 0.04 –20.91 ± 1.56 0.57 ± 0.27 ns
x3 . x5 0.57 ± 0.04 ns 0.76 ± 0.27 0.67 ± 0.05
x4 . x5 ns 8.87 ± 1.56 –0.55 ± 0.27 –0.39 ± 0.05
R2 adj 0.99016 0.98958 0.90666 0.99830
4 Conclusions
For soybean cultivar BRS 267, the most convenient laboratory conditions found for tofu production are: long thermal treatment (after boiling, heat for another 10 minutes in water bath), 3 g of dihydrated calcium sulphate coagulant, 10 minutes of coagulation, curd cutting, and 30 minutes of draining.
References
ASSOCIATION OF OFFICIAL ANALYTICAL CHEMISTS - AOAC.
Official Methods of Analysis of AOAC International. 16.
ed.Arlington: AOAC International, 1995.
CAI, T. D. et al. Comparison of bench and production scale methods
for making soymilk and tofu from 13 soybean varieties. Food
Research International, v. 30, n. 9, p. 659-668, 1997. http://dx.doi. org/10.1016/S0963-9969(98)00032-5
CAI, T. D.; CHANG, K. C. Characteristics of production-scale tofu as affected by soymilk coagulation method: propeller blade size, mixing
time and coagulant concentration. Food Research International,
v. 31, n. 4, p. 289-295, 1998. http://dx.doi.org/10.1016/S0963-9969(98)00091-X
CIABOTTI, S. Aspectos químico, físico-químico e sensorial de
extratos de soja e tofus obtidos de soja convencional e livre de lipoxigenase. 2004. 122 f. Dissertação (Mestrado em Ciência dos Alimentos)-Universidade Federal de Lavras, Lavras, 2004. CUI, Z. et al. Breeding specialty soybeans for traditional and new
soyfoods. In: LIU, K. (Ed.). Soybeans as functional foods and
ingredients. Champaign: AOCS Press, 2004. p. 290-295. http:// dx.doi.org/10.1201/9781439822203.ch14
DAMODARAN, S. Food proteins: an overview. In: DAMODARAN,
S.; PARAF, A. (Eds.). Food proteins and their aplications. New
York: Marcel Dekker, 1997. p. 1-24.
EMBRAPA. Cultivares de Soja 2007-2008 região centro-sul. Londrina: Embrapa Soja, Fundação Meridional, 2008. 80 p. (Embrapa Soja, Documentos, n. 299).
EVANS, D. E.; TSUKAMOTO, C.; NIELSEN, N. C. A small scale
method for the production of soymilk and silken tofu. Crop Science,
this will depend on the type of tofu, personal preferences, and the intended use of the product.
Tofu yield is the process parameter of greatest interest, from both the technological and the economic points of view; thus, the yield must be as high as possible without compromising the other quality characteristics of the product. Solid components may be lost along with water during whey draining; therefore, it is not enough to take yield into account. Solids retention in tofu, mainly proteins, is also important. It is desirable that these values are as high as possible, since they affect the product yield and nutritional value. Their acceptable range begins at the average value obtained in the experiments.
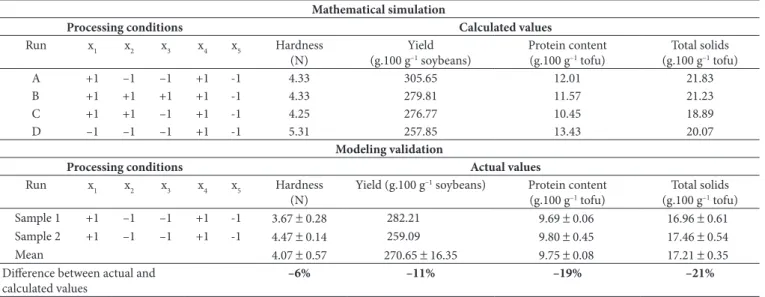
The four polynomial models obtained that describe each response were employed in a mathematical simulation in which the values of variable x were replaced with either +1 or –1 in all possible combinations (25 = 32). The calculated results were arranged in ascending order. Within the ranges defined for each response, treatments A, B, C, and D (Table 5) were chosen as those that best meet hardness, yield, protein content, and total solids requirements, respectively. Treatment A was chosen because its conditions would afford the best product with protein content and total solid s almost 20% greater than the experimental average. The expected increase in hardness was lower, but it was still about 10% above the average, which would place this product within the range accepted by consumers, according to commercial tofu values (Table 3).
Two experiments were performed using cultivar BRS 267, and the processing conditions were chosen in order to validate the statistical analysis and mathematical modeling results. The actual results were lower (from 6 to 21%) than those calculated using the polynomial models (Table 5). This difference is both acceptable and expected since the objective of this work was not process optimization; factorial design was used to determine the most adequate tofu processing conditions among those investigated.
Table 5. Mathematical simulation and modeling validation results.
Mathematical simulation
Processing conditions Calculated values
Run x1 x2 x3 x4 x5 Hardness (N)
Yield (g.100 g–1 soybeans)
Protein content (g.100 g–1 tofu)
Total solids (g.100 g–1 tofu)
A +1 –1 –1 +1 -1 4.33 305.65 12.01 21.83
B +1 +1 +1 +1 -1 4.33 279.81 11.57 21.23
C +1 +1 –1 +1 -1 4.25 276.77 10.45 18.89
D –1 –1 –1 +1 -1 5.31 257.85 13.43 20.07
Modeling validation
Processing conditions Actual values
Run x1 x2 x3 x4 x5 Hardness (N)
Yield (g.100 g–1 soybeans) Protein content
(g.100 g–1 tofu)
Total solids (g.100 g–1 tofu)
Sample 1 +1 –1 –1 +1 -1 3.67 ± 0.28 282.21 9.69 ± 0.06 16.96 ± 0.61
Sample 2 +1 –1 –1 +1 -1 4.47 ± 0.14 259.09 9.80 ± 0.45 17.46 ± 0.54
Mean 4.07 ± 0.57 270.65 ± 16.35 9.75 ± 0.08 17.21 ± 0.35
Difference between actual and calculated values
–6% –11% –19% –21%
MIN, S.; YU, Y.; SANT MARTIN, S. Effect of soybean varieties and growing locations on the physical and chemical properties of
soymilk and tofu. Journal of Food Science, v. 70, n. 1, p.
C8-C12, 2005. http://dx.doi.org/10.1111/j.1365-2621.2005.tb09026.x OAKENFULL, D.; PEARCE, J.; BURLEY, R. W. P. Protein gelation. In:
DAMODARAN, S.; PARAF, A. (Eds.). Food proteins and their
aplications. New York: Marcel Dekker, 1997. p. 111-142.
POYSA, V.; WOODROW, L.; YU, K. Effect of soy protein subunit composition on tofu quality. In: INTERNATIONAL SOYBEAN PROCESSING UTILIZATION CONFERENCE, 4., 2004, Foz do
Iguaçu. Anais... Londrina: Embrapa Soja, 2004. p. 68.
PRABHAKARAN, M. P.; PERERA, C. O.; VALIYAVEETIL, S. Effect of different coagulants on the isoflavone levels and physical properties
of prepared firm tofu. Food Chemistry, v. 99, n. 3, p. 492-499, 2006.
http://dx.doi.org/10.1016/j.foodchem.2005.08.011
ROSSET, M. Distribuição de ácido fitico e minerais durante o
processamento de extrato hidrossolúvel de soja e tofu. 2007. 78 f. Dissertação (Mestrado em Ciência de Alimentos)-Universidade Estadual de Londrina, Londrina, 2007.
STATSOFT. Statistica for Windows. Tulsa: Statsoft, Inc., 1995.
Computer program manual.
SUN, N.; BREENE, W. M. Calcium sulfate concentration influence
on yield and quality of tofu from five soybean varieties. Journal
of Food Science, v. 56, n. 6, p. 1604-1607, 1991. http://dx.doi. org/10.1111/j.1365-2621.1991.tb08651.x
TSAI, S. J. et al. Studies on the yield and quality characteristics of tofu. Journal of Food Science, v. 6, p. 734-740, 1981.
v. 37, p. 1463-1471, 1997. http://dx.doi.org/10.2135/cropsci1997.0 011183X003700050008x
FENNEMA, O. R. Food Chemistry. 3. ed. New York: Marcel
Dekker, 1996. p. 391-394.
HOU, H. J.; CHANG, K. C.; SHIH, M. C. Yield and textural
properties of soft tofu as affected by coagulation method. Journal
of Food Science, v. 62, n. 4, p. 824-827, 1997. http://dx.doi. org/10.1111/j.1365-2621.1997.tb15464.x
KAO, F. J.; SU, N. W.; LEE, M. H. Effect of calcium sulfate concentration in soymilk on the microstructure of firm
tofu and the protein constitutions in tofu whey. Journal of
Agricultural and Food Chemistry, v. 51, p. 6211-6216, 2003.
P Mi d : 1 4 5 1 8 9 4 6 . http : / / d x . d oi. org / 1 0 . 1 0 2 1 / j f 0 3 4 2 0 2 1 KOHYAMA, K.; SANO, Y.; DOI, E. Rheological characteristics and
gelation mechanism of tofu (soybean curd). Journal of Agricultural
and Food Chemistry, v. 43, n. 7, p. 1808-1812, 1995. http://dx.doi. org/10.1021/jf00055a011
LIM, B. T. et al. Yield and quality of tofu as affected by soybean
and soymilk characteristics: calcium sulfat coagulant. Journal
of Food Science, v. 55, n. 4, p. 1088-1092, 1990. http://dx.doi. org/10.1111/j.1365-2621.1990.tb01605.x
LIU, Z. S. et al. Efect of selective thermal denaturação of soybean
proteins on soymilk viscosity and tofu´s physical properties. Food
Research International, v. 37, n. 8, p. 815-822, 2004. http://dx.doi. org/10.1016/j.foodres.2004.04.004
LU, J. Y., CARTER, E.; CHUNG, R. A. Use of calcium salts for soybean
curd preparation. Journal of Food Science, v. 45, p. 32-34, 1980.