SURFACE METHODOLOGY
Daniela A. Viana Marques1; Márcia N. Carneiro Cunha2; Janete M. Araújo3; José L. Lima-Filho2; Attilio Converti4; Adalberto Pessoa-Jr1*; Ana L. Figueiredo Porto5
1
Departamento de Tecnologia Bioquímico-Farmacêutica, Universidade de São Paulo, São Paulo, SP, Brasil; 2Laboratório de
Biotecnologia, LIKA, Universidade Federal de Pernambuco, Recife, PE, Brasil; 3Departamento de Antibióticos, Universidade
Federal de Pernambuco, Recife, PE, Brasil; 4CAPES Fellowship/Brazil, Department of Chemical and Process Engineering,
University of Genoa, Via Opera Pia 15, 16145 Genoa, GE, Italy; 5Departamento de Morfologia e Fisiologia Animal, Universidade
Federal Rural de Pernambuco, Dois Irmãos, PE, Brasil.
Submitted: August 18, 2010; Approved: January 13, 2011.
ABSTRACT
Clavulanic acid is a -lactam antibiotic which has a potent -lactamase inhibiting activity. In order to
optimize its production by the new isolate Streptomyces DAUFPE 3060, the influence of two independent
variables, temperature and soybean flour concentration, on clavulanic acid and biomass concentrations was
investigated in 250 mL-Erlenmeyers according to a 22 central composite design. To this purpose,
temperature and soybean flour (SF) concentration were varied in the ranges 26-34°C and 10-50 g/L,
respectively, and the results evaluated utilizing the Response Surface Methodology. The experimental
maximum production of clavulanic acid (629 mg/L) was obtained at 32°C and 40 g/L SF after 48 h, while
the maximum biomass concentration (3.9 g/L) at 30°C and 50 g/L soybean flour, respectively. These values
are satisfactorily close to those (640 mg/L and 3.75 g/L, respectively) predicted by the model, thereby
demonstrating the validity of the mathematical approach adopted in this study.
Key words: Clavulanic acid, response surface methodology, production, optimization, streptomyces sp.
INTRODUCTION
Clavulanic acid (CA) is a -lactamase inhibitor that is
administered in combination with penicillin group antibiotics
to overcome certain types of antibiotic resistance. Despite
sharing the -lactam ring typical of penicillins, CA has low
intrinsic antimicrobial activity. However, such a similarity in
chemical structure allows it acting as a competitive inhibitor of
-lactamases secreted by certain bacteria to confer resistance to
-lactam antibiotics (30). The combined action as -lactamase
inhibitor and antibacterial agent makes CA very important both
clinically and economically (21).
The pharmacokinetic characteristics of CA supported the
development of combined therapy regimens with amoxicillin
and ticarcillin, and the therapeutic success of these
combination drugs is well recognized. CA formulations have
been used widely and effectively in the treatment of a broad
range of clinical infections for nearly 20 years (11).
Nowadays, the -lactam antibiotics, particularly penicillins
and cephalosporins, represent the world’s major biotechnology
products, with around 65 % of the total world market of
antibiotics (10).
Streptomyces is the largest antibiotic-producing genus in
the discovered microbial world. Species belonging to this
genus still remain an important source of antibiotics. In recent
years, screening of natural products, particularly microbial
products, has fallen out. Nevertheless, it is becoming
increasingly apparent that 99 % of the diverse bacterial species
is still unexplored (10, 28, 37). Thus, the discovery of new
Streptomyces species is a challenge for the improvement of CA
production.
However, closer inspection of metabolite production
patterns among other producers of CA, clavams and
cephamycin C suggests that a strong selective pressure, rather
than mere chance, has created actinomycetes that coproduce
CA and a -lactam antibiotic such as cephamycin C. Among
these, several strains of Streptomyces clavuligerus,
Streptomyces jumonjinensis, Streptomyces katsurahamanus,
and an unclassified Streptomyces sp. are reported to produce
CA (15).
The productivity of microbial metabolites is, in general,
closely related to the fermentation process (6, 12, 18). In order
to reduce the costs of a bioprocess, it is necessary to develop
strains with increased productivity, use inexpensive raw
materials, improve filtration properties, perform the process
under favorable conditions (30), thus requiring its optimization.
Most of previous studies on CA were devoted to the
improvement of its production by S. clavuligerus (36), for
which a final CA concentration of even 1384 mg/L has recently
been reported (31).
However, there are only a few works that deal with high
CA producing mutants of this species or other Streptomyces
species (17, 19) as well as process optimization by statistical
design (35).
Statistical design of experiments is a widely used tool for
process optimization and control. By a factorial design, the
significant factors and their effects can be studied using only a
few experiments, thus saving time and reducing the operating
costs (4). Response surface methodology (RSM), originally
described by Box and Wilson (3), enables evaluation of the
effects of many factors and their interactions on response
variables. The main advantage of RSM is the reduced number
of experimental runs needed to provide sufficient information
for statistically acceptable results (9). Therefore, it is less
laborious and time-consuming compared to full-factorial
experimentation (32).
Aiming at reducing the cost of the process, a new good
producer (Streptomyces DAUFPE 3060) is proposed in this
study for the production of CA, using a minimal medium
composed only of soybean flour and glycerol. In previous
study, the influence of the most important process variables on
CA production by this strain was screened using a 25-2
fractional factorial design, and temperature and soybean flour
concentration resulted to be the most significant ones (34).
Although the new isolate was not yet characterized, its high
performance in CA production with respect to common S.
clavuligerus strains constituted the main novelty of that study.
On the basis of this ground, a 22 central composite design
combined with RSM was used in this work to select the best
values of these two variables able to optimize CA production
by the same strain.
MATERIALS AND METHODS
Reagents
used to obtain the calibration curve needed to determine CA
concentration. The imidazole used in the CA determination
was provided by Sigma Aldrich (São Paulo, São Paulo, Brazil).
The salts, glycerol, bacto-peptone, malt extract, and yeast
extract used to prepare the media were analytical grade
reagents.
Microorganism
The Streptomyces spp. DAUFPE 3060 strain was kindly
provided by the Microorganism Collection of the Department
of Antibiotics of the Federal University of Pernambuco,
Recife-PE, Brazil. The microorganism, which is still at the
stage of characterization, was stored in cryotubes (glycerol 10
%, v/v) at -70 °C and used throughout the present work.
Culture media
The seed medium had the following composition (in g/L
distilled water): glycerol, 15; bacto-peptone, 10; malt extract,
10; yeast extract, 1.0; K2HPO4, 2.5; MgSO4·7H2O, 0.75;
MnCl2·4H2O, 0.001; FeSO4·7H2O, 0.001; and ZnSO4·7H2O,
0.001. The pH of the medium was adjusted to 6.8 with NaOH
5.0 M before autoclaving at 121 °C for 15 min. The inoculum
medium used in the cultivations, based on that proposed by
Maranesi et al. (22), had the following composition (in g/L
distilled water): glycerol, 10; soybean flour (SF), 20; K2HPO4,
1.2; MnCl2·4H2O, 0.001; FeSO4·7H2O, 0.001; ZnSO4·7H2O,
0.001, pH 6.8. The composition of the production medium was
similar to that used for the inoculum, except for the
concentration of glycerol (5.0 g/L) and the SF concentration
that was varied according to the selected experimental design.
Fermentation conditions
Spores of Streptomyces spp.DAUFPE 3060 were obtained
from colonies grown on solid culture medium in Petri plates.
These colonies were withdrawn and grown in liquid culture
medium for 96 h. After determination of initial biomass
concentration by dry weight, the spores were lyophilized and
stored in glycerol 10 % v/v. The seed culture was prepared by
adding the lyophilized spores (6.6g/L dry weight) contained in
a cryotube with glycerol to 25 mL of seed medium in 250
mL-Erlenmeyer flasks that were incubated in an orbital shaker at 28
°C and 200 rpm for 24 h. Afterward, 250 mL-Erlenmeyer
flasks containing 45 mL of inoculum medium were inoculated
with 5.0 mL of the seed culture and incubated in an orbital
shaker under the same conditions. Then, 5.0 mL aliquots of this
suspension with cells at the exponential growth phase (24 h)
were transferred to 250 mL-Erlenmeyer flasks containing 45
mL of the production medium. The exponential phase was
obtained after 24 h. The 14 production runs, which lasted 168
h, were performed in an orbital shaker at 150 rpm at different
temperatures, according to the experimental design described
later.
Analytical methods
The fermentation broth was centrifuged at 5500 x g for 20
min at 4 °C, and the cell pellet was washed twice with distilled
water and dried to constant weight at 80 °C. The CA
concentration in the fermented broth was determined
spectrophotometrically by its reaction with imidazole (2). For
this purpose, the increase in the optical density at 311 nm
consequent to the formation of the product
[1-(8-hydroxy-6-oxo-4-azooct-2-enol)-imidazole] was determined using a
spectrophotometer Ultrospec 3000 pro UV/Visible (GE
Healthcare, Life Sciences, Uppsala, Sweden). Glycerol
concentration was determined according to Hae Bok and
Demain (13). All the analyses were performed in triplicate.
Experimental design and data analysis
In order to quantify the influence of the selected
independent variables, specifically soybean flour concentration
(v1) and temperature (v2), on the responses (concentrations of
CA and biomass), a 22 central composite design with
three-coded levels leading to 14 experiments was used, which
points and star points to allow estimation of the curvature (7).
The range and levels of the variables investigated in this
study are given in Table 1. Six tests at the central point were
performed to estimate the pure error needed for the analysis of
variance, to examine the presence of curvature in the response
surface, and to investigate the suitability of the proposed
models.
The concentrations of CA and biomass were determined
after 48 h, because previous experiments demonstrated that
after this time CA degradation begun. The quadratic model to
predict the optimal point was expressed by the equation:
= b0 + bixi+ biixi2+ bijxixj [1]
where represents the predicted value of the response
variables, b0 is the intercept coefficient, bi are the linear
coefficients, bii are the quadratic coefficients and bij are the
interaction ones.
Table 1. Levels of factors used in the 22 central composite design.
Levels
Coded values
Low
-1
Central
0
High
+1
Axial
(- )
Axial
(+ )
v1 - SF concentration (g/L) 20 30 40 10 50
v2- Temperature (°C) 28 30 32 26 34
The statistical significance of the regression coefficients
was determined by the Student’s t-test, and the second-order
model equation was determined by the Fischer’s test. The
effects of unexplained variability in the observed response due
to extraneous factors were minimized by randomizing the order
of experiments (20).
RESULTS AND DISCUSSION
Experimental design and optimization by RSM
The results of a first attempt to point out the main
variables influencing the CA production by Streptomyces spp.
DAUFPE 3060 were already discussed in previous work (34).
For this purpose, the effects of temperature, agitation intensity,
pH, glycerol and soybean flour (SF) concentrations were
investigated using a 25-2 fractional factorial design. The
regression analysis showed that both SF concentration and
temperature were significant for CA production at probability
levels of 95 and 97%, respectively, thereby proving the mostly
influencing independent variables. However, the simultaneous
variations of five variables in that effort did not enable us to
predict their optimum levels, but only suggested ranges of
temperature and SF concentration within which subsequent
optimization should be focused. This is the objective of the
present optimization work.
The main results obtained by Streptomyces DAUFPE 3060
fermentations according to the 22 central composite design
selected for this study are listed in Table 2. Experiments were
planned so as to obtain quadratic models able to describe the
CA and biomass concentrations as simultaneous functions of
temperature and SF levels.
The maximum CA production (629 mg/L) was achieved at
32 °C and SF = 40 g/L (run 4). Similarly, the maximum
biomass concentration (3.9 g/L) was observed at SF = 50 g/L
Table 2. Level combinations of the two independent variables (temperature and SF concentration) used in the 22 central composite
design, and results of the selected responses (clavulanic acid and biomass concentrations).
Independent variables *Responses
Run Temperature
(°C)
SF (g/L)
Clavulanic acid (mg/L)
Biomass (g/L)
14 (C) 30 30 567 3.4
7 26 30 501 2.4
12 (C) 30 30 566 3.3
10 (C) 30 30 567 3.1
5 30 10 221 1.8
6 30 50 582 3.9
2 32 20 377 2.0
13 (C) 30 30 567 3.5
11 (C) 30 30 568 3.4
4 32 40 629 3.3
9 (C) 30 30 565 3.1
8 34 30 595 2.9
3 28 40 562 3.0
1 28 20 306 1.3
*All values were statistically significant at 95% confidence level.
The experimental data of Table 2 were then used to make
regression analyses fitting both responses. The following
equations, where the variables take their coded values, express
the best models for CA and biomass concentrations,
respectively:
1 = 566.67 + 127.32 x1 – 84.15 x12 + 33.87 x2 – 10.89 x22 –
1.00 x1x2 [3]
2 = 3.30 + 0.75 x1 – 0.31 x12 + 0.21 x2– 0.41 x22 – 0.10 x1x2
[4]
where 1, 2 and x1 are CA, biomass and SF concentrations,
while x2is temperature.
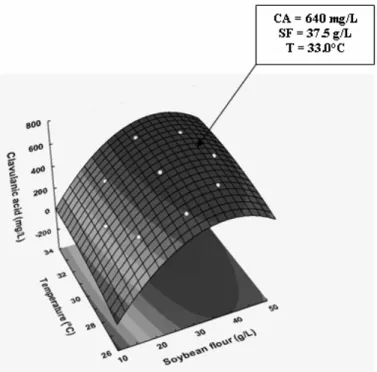
The simultaneous effects of temperature and SF
concentration and their interactions on the CA and biomass
productions are better visualized in three-dimensional (3-D)
graph projections (Figures 1 and 2) using the Response Surface
Methodology (RSM).
Figure 1. Three-dimensional response surface contour plot
showing the simultaneous effects of soybean flour
Figure 2. Three-dimensional response surface contour plot
showing the simultaneous effects of soybean flour
concentration and temperature on biomass concentration.
Although the statistical analysis revealed positive main
linear effects of both independent variables (significant at 95%
confidence level) either on CA or biomass concentrations, the
effect of SF level was the stronger. However, this behavior was
not linear, since the quadratic effects of theses variables were
also significant. This means that the values of both responses
increased up to a certain level when both variables were raised.
As a result, there are two regions of temperature (30-34°C) and
SF concentration (35-45 g/L) where both responses reach
maximum values. Although the interaction term (x1x2) was not
significant, it was kept in the model to allow for the error
determination. Simultaneous regression by eqs. [3] and [4]
provided maximum predicted values of CA concentration (640
mg/L) at 33.0 °C and SF = 37.5 g/L, and of biomass
concentration (3.75 g/L) at 30.2 °C and SF = 41.77 g/L,
respectively. These predicted values are only 1.7 % higher and
3.8% lower than the experimental ones, thus demonstrating the
validity of the models employed.
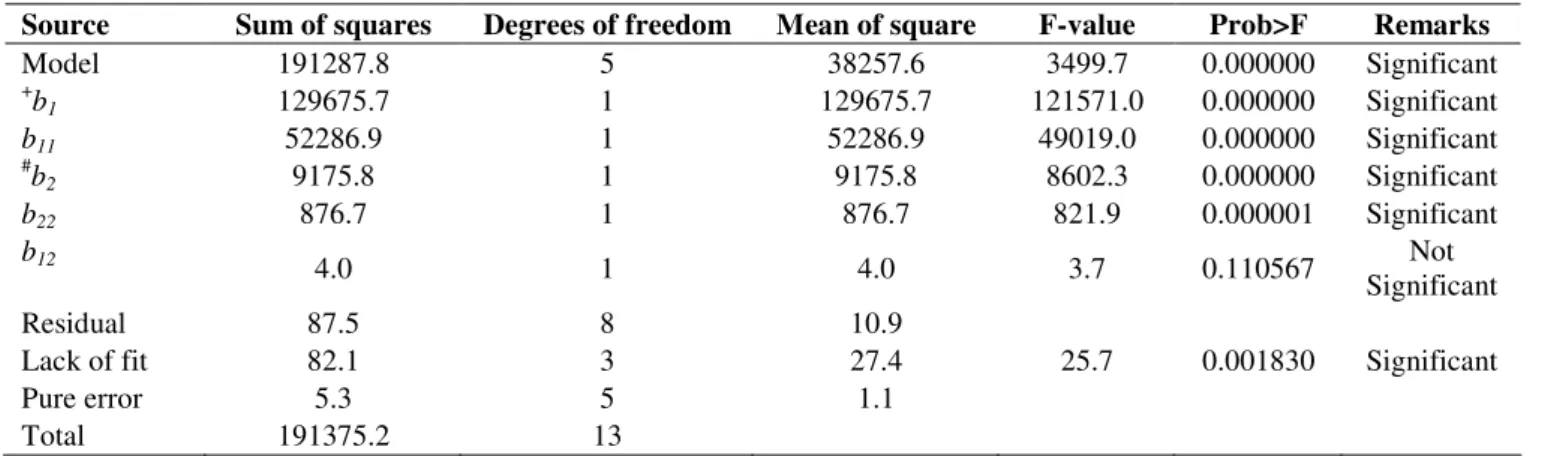
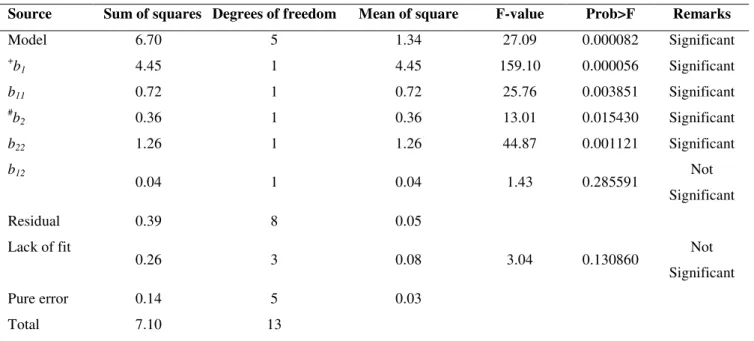
The statistical significance of second-order model
equations was confirmed by the F-test analysis of variance
(ANOVA) and multiple regression (Tables 3 and 4). In fact, the
computed F-values (27.08 for 2 and 3499 for 1) were much
greater than the tabulated ones [F(2,11) = 11.63 and 14.54,
respectively]. Whereas the lack of fit was insignificant for 2 [F
= 3.04 < F(2,11)], that for 1, although significant (F = 25.7),
showed a very low pure error (1.1). In addition, the high values
of the determination coefficients (R2 = 0.97 and 0.99 for
biomass and CA concentrations, respectively) indicate that the
models explained 97-99% of the variability data, and both
regressions were statistically significant (p < 0.0001) at 95%
confidence level.
Table 3. Analysis of variance applied to the regression model used for the CA concentration (R2 = 0.99).
Source Sum of squares Degrees of freedom Mean of square F-value Prob>F Remarks
Model 191287.8 5 38257.6 3499.7 0.000000 Significant
+b
1 129675.7 1 129675.7 121571.0 0.000000 Significant
b11 52286.9 1 52286.9 49019.0 0.000000 Significant
#b
2 9175.8 1 9175.8 8602.3 0.000000 Significant
b22 876.7 1 876.7 821.9 0.000001 Significant
b12
4.0 1 4.0 3.7 0.110567 Not
Significant
Residual 87.5 8 10.9
Lack of fit 82.1 3 27.4 25.7 0.001830 Significant
Pure error 5.3 5 1.1
Total 191375.2 13
Table 4. Analysis of variance applied to the regression model used for the biomass concentration (R2 = 0.97).
Source Sum of squares Degrees of freedom Mean of square F-value Prob>F Remarks
Model 6.70 5 1.34 27.09 0.000082 Significant
+
b1 4.45 1 4.45 159.10 0.000056 Significant
b11 0.72 1 0.72 25.76 0.003851 Significant
#
b2 0.36 1 0.36 13.01 0.015430 Significant
b22 1.26 1 1.26 44.87 0.001121 Significant
b12
0.04 1 0.04 1.43 0.285591 Not
Significant
Residual 0.39 8 0.05
Lack of fit
0.26 3 0.08 3.04 0.130860 Not
Significant
Pure error 0.14 5 0.03
Total 7.10 13
Independent variables: +1 = Soybean flour concentration; #2 = Temperature.
Relationship between CA production and biomass growth
As expected by the above trends, an almost linear
relationship seems to hold between CA and biomass levels
(Figure 3), which demonstrates that this strain is able to
produce CA during growth. These results agree with those of
Mayer and Deckwer (23), who observed that growth and
production occurred simultaneously in the trophophase. CA
production associated to cell growth was already detected
utilizing soybean derivatives as nitrogen sources (21, 16). On
the other hand, other authors observed that CA synthesis
occurred during the trophophase, but the highest CA
concentration was obtained during the stationary one (1, 33).
These results are of particular concern, when compared
with those of Neves et al. (24), who utilized as industrial
inoculum cells at the exponential growth phase after the same
time (24 h) and obtained a maximum CA production of about
100 mg/L after a significantly longer time (about 70 h). CA
production comparable to that of the present study (672-681
mg/L) was observed with S. clavuligerus using 38 g/L soy
meal powder, 0.39 g/L FeSO4·7H2O and 1.18 g/L ornithine
(35).
As suggested by Butterworth (5), soybean proteins are
important nutrients for CA production. The effectiveness of SF
as a nitrogen source is in accordance with the results of Ortiz et
al. (25), who observed CA productions in Erlenmeyer flasks
increasing from 338 to 698 mg/L when 20 g/L SF substituted
10.9 g/L soybean protein isolate as a nitrogen source. Higher
CA levels (up to 1384 mg/L) were obtained in medium
containing glycerol and sucrose as carbon sources
supplemented with amino acids (31), and in a glycerol-based
medium with protein extract of soybean (1178 mg/L) (12).
As far as the effect of temperature is concerned, it is well
known that an increase in this parameter stimulates CA
production (34), even if it is very difficult to evaluate it,
because of the simultaneous occurrence of
temperature-dependent CA degradation. In fact, it has recently been
demonstrated, in experiments with commercial CA, that an
increase in temperature from 15 to 45 °C leads to a
corresponding increase in the first-order degradation constant
Fermentation under the best conditions
Figure 4 shows the time behavior of CA production,
biomass growth and glycerol consumption during the
fermentation that provided the best results (run 4). It should be
noticed that the highest cell concentration (5.06 g/L) and CA
production (629 mg/L) were both obtained before the complete
consumption of glycerol, although after different times (72 and
48 h, respectively). But the most evident result is that the CA
concentration rapidly fell after 48 h, as the likely result of
higher degradation rate when compared to its production. Figure 3. Relationship between
biomass and CA concentrations
obtained after 48 h of Streptomyces
DAUFPE 3060 fermentations carried
out according to the 22 central
composite design of Table 1.
Figure 4. Time course of the
concentrations of biomass ( ),
glycerol ( ) and clavulanic acid ( )
in shaken flasks. Temperature: 32
°C; Soybean flour concentration: 40
g/L; Glycerol concentration: 5.0g/L;
Similar CA production simultaneous to growth,
achievement of maximum CA concentration and subsequent
quick degradation were observed by several authors (8, 23, 26).
In agreement with these findings, Lynch and Yang (21)
observed that the rate of CA degradation during fermentation
was comparable to that of its production and proposed that the
degradation products could have been used by the
microorganism for further production of the antibiotic. It was
proposed that such degradation could be the result of the action
of metabolites or enzymes produced by the strain (16), of
compounds in the culture medium such as amino acids and
inorganic materials (27) or of the autolysis resulting from the
rising pH, microbial decomposition, and re-metabolization
(14).
CONCLUSIONS
These results on the whole suggest that a rigorous control
of the residence time would be a fundamental requisite in
scaling-up an industrial process for continuous clavulanic acid
production by the new isolate Streptomyces DAUFPE 3060.
The next effort in this direction will deal with the attempt to
carry out this process in a bench-scale fermenter.
ACKNOWLEDGEMENT
The authors gratefully acknowledge the financial support
of the Brazilian Research Funding Institutions FAPESP
(process n. 05/60158-0) and CAPES.
REFERENCES
1. Baptista Neto, A.; Hirata, D.B.; Cassiano Filho, L.C.M.; Bellão, C.; Badino Jr, A.C.; Hokka, C.O. (2005). A study on clavulanic acid production by Streptomyces clavuligerus in batch, fed-batch and continuous processes. Braz. J. Chem. Eng. 22, 557–563.
2. Bird, A.E.; Bellis, J.M.; Gasson, B.C. (1982). Spectrophotometric assay of clavulanic acid by reaction with imidazole. Analyst 107, 1241–1245. 3. Box, G.E.P.; Wilson, K.B. (1951). On the experimental attainment of
optimum conditions. J. Roy. Statist Soc. B 13, 1–45.
4. Bruns, R.E.; Scarminio, I.S.; Neto, B.B. (2006). Statistical Design – Chemometrics. Elsevier, Amsterdam.
5. Butterworth, D. (1984). Clavulanic acid: properties biosynthesis, and fermentation. In: Vandamme, E.J. (ed). Biotechnology of Industrial Antibiotics. Marcel Dekker, New York, USA, p. 225–235.
6. Chen, K.C.; Lin, Y.H.; Tsai, C.M.; Hsieh, C.H.; Houng, J.Y. (2002). Optimization of glycerol feeding for clavulanic acid production by
Streptomyces clavuligerus with glycerol feeding. Biotechnol. Lett. 24, 455–458.
7. Chen, Q.H.; He, G.Q.; Mokhtar, A.M.A. (2002). Optimization of medium composition for the production of elastase by Bacillus sp. EL31410 with response surface methodology. Enzyme Microb. Technol.
30, 667-672.
8. Chen, K.C.; Lin, Y.H.; Wu, J.Y.; Hwang, S.C. J. (2003). Enhancement of clavulanic acid production in Streptomyces clavuligerus with ornithine feeding. Enzyme Microb. Technol. 32, 152–156.
9. Chu, B.S.; Quek, S.Y.; Baharin, B.S. (2003). Optimization of enzymatic hydrolysis for concentration of vitamin E in palm fatty acid distillate.
Food Chem., 80, 295–302.
10. Elander, R.P. (2003). Industrial production of -lactam antibiotics. Appl. Microbiol. Biotechnol. 61, 385-392.
11. Finlay, J.; Miller, L.; Poupard, J.A. (2003). A review of the antimicrobial activity of clavulanate. J. Antimicrob. Chemother. 52, 18-23.
12. Gouveia, E.R.; Baptista-Neto, A.; Badino-Jr, A.C.; Hooka, C.O. (2001). Optimisation of medium composition for clavulanic acid production by
Streptomycesclavuligerus. Biotechnol. Lett. 23, 157–161.
13. Hae Bok, S. Demain, A.L. (1977). An improved colorimetric assay for polyols. Anal. Biochem. 81, 18-20.
14. Hu, W.S.; Brana, A.F.; Demain, A.L. (1984). Carbon source regulation of cephem antibiotic production by resting cell of Streptomyces clavuligerus and its reversal by protein synthesis inhibitors. Enzyme Microb. Technol. 6, 155–160.
15. Jensen, S.E.; Paradkar, A.S. (1999). Biosynthesis and molecular genetics of clavulanic acid. Antonie. Van. Leeuwenhoek. 75, 125–133.
16. Kenji, I.; Hung, T.V.; Lee, H.C.; Liou, K.; Shin, C.H.; Yoon, Y.J.; Sohng, J.K. (2006). Degradation of clavulanic acid during the cultivation of Streptomyces clavuligerus; instability of clavulanic acid by metabolites and proteins from the strain. J. Microbiol. Biotechnol. 16, 590–596.
17. Kim, I.C.; Kim, C.H.; Hong, S.I.; Kim, S.W. (2001). Fed-batch cultivation for the production of clavulanic acid by an immobilized
Streptomyces clavuligerus mutant. World J. Microbiol. Biotechnol. 17, 869–872.
limiting substrate affects antibiotic production and associated metabolic flues in Streptomyces clavuligerus. Biotechnol. Lett. 22, 1803–1809. 19. Lee, S.D.; Park, S.W.; Oh, K.K.; Hong, S.I.; Kim, S.W. (2002).
Improvement for the production of clavulanic acid by mutant
Streptomyces clavuligerus. Lett. Appl. Microbiol. 34, 370–375. 20. Liyana-Pathirana, C.; Shahidi, F. (2005). Optimization of extraction of
phenolic compounds from wheat using response surface methodology.
Food Chem. 93, 47–56.
21. Lynch, H.C.; Yang, Y. (2004). Degradation products of clavulanic acid promote clavulanic acid production in cultures of Streptomyces clavuligerus. Enzyme Microb. Technol. 34, 48–54.
22. Maranesi, G.L.; Baptista-Neto, A.; Hokka, C.O.; Badino-Jr, A.C. (2005). Utilization of vegetable oil in the production of clavulanic acid by
Streptomyces clavuligerus ATCC 27064. World J. Microb. Biotechnol.
21, 509–514.
23. Mayer, A.F.; Deckwer, W.D. (1996). Simultaneous production and decomposition of clavulanic acid during Streptomyces clavuligerus
cultivation. Appl. Microbiol. Biotechnol. 45, 41–46.
24. Neves, A.A.; Vieira, L.M.; Menezes, J.C. (2001). Effect of preculture variability on clavulanic acid fermentation. Biotechnol. Bioeng. 72, 628– 633.
25. Ortiz, S.C.A.; Hokka, C.O.; Badino-Jr, A.C. (2007). Utilization of soybean derivatives on clavulanic acid production by Streptomyces clavuligerus. Enzyme Microb. Technol. 40, 1071–1077.
26. Romero, J.; Liras, P.; Martin, J.F. (1984). Dissociation of cephamycin and clavulanic acid biosynthesis in Streptomyces clavuligerus. Appl. Microbiol. Biotechnol. 20, 318–325.
27. Roubos, J.A.; Krabben, P.; De Laat, W.T.A.M.; Babuska, R.; Heijen, J.J. (2002). Clavulanic acid degradation in Streptomyces clavuligerus fed-batch cultivations. Biotechnol. Prog. 18, 451–457.
28. Sánchez, S.; Olson, B. (2005). Microbial diversity - the bright and promising future of microbial manufacturing. Curr. Opin. Microbiol. 8, 229-233.
29. Santos, V.C.; Brandão Pereira, J.F.; Brandão Haga, R.; Rangel-Yagui,
C.O.; Couto Teixeira, J.A.; Converti, A.; Pessoa Jr, A. (2009). Stability of clavulanic acid under variable pH, ionic strength and temperature conditions. A new kinetic approach. Biochem. Eng. J. 45, 89-93. 30. Saudagar, P.S.; Survase, S.A.; Singhal, R.S. (2008). Clavulanic acid: A
review. Biotechnol. Adv. 26, 335–351.
31. Saudagar, P.S.; Singhal, R.S. (2007). A statistical approach using L25 orthogonal array method to study fermentative production of clavulanic acid by Streptomyces clavuligerus MTCC 1142. Appl. Biochem. Biotechnol. 136, 345-359.
32. Tan, C.H.; Ghazali, H.M.; Kuntom, A.; Tan, C.P.; Ariffin, A.A. (2009). Extraction and physicochemical properties of low free fatty acid crude palm oil. Food Chem. 113, 645–650.
33. Teodoro, J.C.; Baptista-Neto, A.; Cruz-Hernández, I.L.; Hokka, C.O.; Badino-Jr, A.C. (2006). Influence of feeding conditions on clavulanic acid production in fed-batch cultivation with medium containing glycerol. Appl. Microbiol. Biotechnol. 72, 450–455.
34. Viana Marques, D.A.; Carneiro Cunha, M.N.; Araújo, J.M.; Barros-Neto, B.; Lima-Filho, J.L.; Converti, A.; Pessoa-Jr, A.; Porto, A.L.F. (2009). Screening of variables influencing the clavulanic acid production by
Streptomyces DAUFPE 3060 strain. Appl. Biochem. Biotechnol., article online: doi 10.1007/s12010-009-8671-3.
35. Wang, Y. H.; Yang, B.; Renb, J.; Donga, M.L.; Liang, D.; Xua, A.L. (2005). Optimization of medium composition for the production of clavulanic acid by Streptomyces clavuligerus. Proc. Biochem. 40, 1161– 166.
36. Watve, M.G.; Tickoo, R.; Jog, M.M.; Bhole, B.D. (2001). How many antibiotics are produced by the genus Streptomyces? Arch. Microbiol.
176, 386-390.
37. Watve, M.G.; Shejval, V.; Sonawane, C.; Rahalkar, M.; Matapurkar, M.; Shouche, Y.; Patole, M.; Phadnis, N.; Champhekar, A.; Damle, K.; Karandikar, S.; Kshirsagar, V.; Jog, M. (2000). The ‘K’ selected oligophilic bacteria: a key to uncultured diversity? Curr. Sci. 78, 1535– 1542.