Received March 2, 2009 and accepted March 5, 2010. Corresponding author: [email protected]
Genetic parameters and phenotypic and genetic trends for weight at
weaning and visual scores during this phase estimated for Angus-Nellore
crossbred young bulls
Ronyere Olegário de Araújo1, Paulo Roberto Nogara Rorato2, Tomás Weber1, Dionéia Magda Everling1, Jader Silva Lopes3, Mariana de Almeida Dornelles4
1Programa de Pós-Graduação em Zootecnia – UFSM, CEP: 97105-900, Santa Maria, RS – Brasil – Bolsita CAPES. 2Departamento de Zootecnia/CCR - UFSM, 97105-900, Santa Maria, RS – Brasil – Bolsista de Produtividade do CNPq. 3CIEx Agropecuário - Sadia S/A – Concórdia, RS – Brasil.
4Programa de Pós -Graduação em Zootecnia – UFSM, CEP: 97105-900, Santa Maria, RS – Brasil – Bolsista CNPq.
ABSTRACT - Genetic parameters and genetic and phenotypic trends were estimated for weight at weaning (WW) and
visual scores (VS) of conformation (C), precocity (P), musculature (M) and navel (N) for Angus × Nellore crossbred calves. It was used 39,676 records from pre-weaning phase of animals born from 1992 to 2002 in mid-western, southeastern and southern Brazil. The components of covariance were estimated using REML, in animal model, considering as random the maternal and direct additive genetic effects, and as fixed, the effects of contemporaneous group, the genetic group of the animal and of the cow, and as covariates the age of the calf at weaning and the age of the cow at calving, both on days and with linear and quadratic effects, besides direct (DH) and maternal heterosis (MH), both with only the linear effect. Estimates of direct and maternal heritability were 0.30 and 0.19, respectively, for WW, whereas VSs ranged from 0.16 to 0.20 and from 0.09 to 0.16, which indicates the possibility to obtain genetic gain through selection. It is expected answer correlated to C, P and for M when selection is practiced for weight at weaning is expected, as well as for P and M when selection is practiced for C. The direct and maternal genetic trends for WW (g/year) and for C, P, M and N (points/year) were: 221.0 and -312.0; 0.0022 and 0.00003; 0.0010 and 0.0001; 0.0013 and -0.0008; 0.0010 and 0.00009, respectively, while the phenotypic were: -685.2; -0.0102; -0.0219; -0.0256 and -0.0453, which highlights the need to adopt criteria for identifying young bulls of higher genetic value for WW and VSs.
Key Words: beef cattle, cross-breeding, genetic evaluation, genetic progress, morphologic evaluation
Parâmetros genéticos e tendências genéticas e fenotípicas para peso a
desmama e escores visuais nessa fase estimados para tourinhos mestiços
Angus-Nelore
RESUMO -Foram estimados parâmetros genéticos e tendências genéticas e fenotípicas para peso a desmama (PD) e para
os escores visuais (EVs) de conformação (C), precocidade (P), musculatura (M) e umbigo (U), para bezerros produtos do cruzamento entre as raças Angus e Nelore. Foram utilizados 39.676 registros da fase pré-desmama, de animais nascidos entre os anos de 1992 e 2002, nas regiões Centro-oeste, Sudeste e Sul do Brasil. Os componentes de (co)variâncias foram estimados utilizando-se o REML, em modelo animal, considerando como aleatórios, os efeitos genéticos aditivos diretos e maternos e, como fixos, os efeitos de grupo de contemporâneos, grupo genético do animal e da vaca e, como covariáveis a idade do bezerro a desmama, a idade da vaca ao parto, ambas em dias e com efeitos linear e quadrático, além da heterose direta (HD) e a heterose materna (HM), ambas somente com efeito linear. As estimativas de herdabilidade diretas e maternas foram 0,30 e 0,19, respectivamente para PD, enquanto que para os EVs variaram de 0,16 a 0,20 e de 0,09 a 0,16, indicando ser possível obter ganho genético através da seleção. É esperada resposta correlacionada em C, P, e M quando a seleção for praticada para PD, bem como em P e M com seleção praticada para C. As tendências genéticas diretas e maternas para PD (g/ano) e para C, P, M e U (pontos/ano) foram: 221,0 e -312,0; 0,0022 e 0,00003; 0,0010 e 0,0001; 0,0013 e -0,0008; 0,0010 e 0,00009, respectivamente, enquanto as fenotípicas foram: -685,2; -0,0102, -0,0219, -0,0256 e -0,0453, evidenciando a necessidade de serem adotados critérios para identificar tourinhos de maior valor genético para PD e os EVs.
Palavras-chave: avaliação genética, avaliação morfológica, bovinos de corte, cruzamento, progresso genético ISSN 1806-9290
Introduction
The global market has exposed the national beef cattle industry to foreign competition, and in this context, competitiveness means permanence in the market and lack of it implies the exclusion from it. So, improving product quality and productivity are challenges faced by the Brazilian beef cattle production to maintain and expand its share in this increasingly demanding market.
Traditionally, features such as body weights and weight gains have been used as selection criteria in various breeding programs for cattle, because they had heritabilities ranging from 0.26 to 0.42 (Marcondes et al., 2000), therefore, with potential to respond effectively to the selection. However, if it is solely based on weight at certain ages and/ or weight gain between two ages, it may prove to be insufficient for the improvement of carcass quality (Kippert et al., 2006), specifically in relation to weight components, as outlined by Long (1973) to propose the Ankony System Evaluation, considering that the breeding program, based solely on weight gain, would be inadequate to meet actual market demands.
The inclusion of visual evaluation by scores or grades in breeding programs is presented as an alternative for improving production of meat and carcass quality, as well as precocity of termination (Costa et al., 2004). These evaluations consist on classifying the animals by assigning scores for conformation, precocity and musculature, with the advantage that its cost is quite low (Fries, 1996). Another important morphological feature, especially for the zebu breeds, is the size of the navel, which is also rated with a score at weaning and at yearling (Koury Filho et al., 2003), thus with easy adoption in breeding programs.
However, an improvement program should be evaluated through the estimation of genetic trends which show the efficiency of adopted selection procedures, besides ensuring that the selection pressure is directed to the trates of greater importance (Weber et al., 2009).
The objective of this study is to estimate genetic parameters for the traits weight at weaning and visual scores of precocity, conformation, musculature and navel, in order to support the recommendation of including these traits in the selection, as well as to estimate the genetic and phenotypic trends for these traits in a multiracial population of Angus-Nellore.
Material and Methods
Records from weight at weaning and visual scores of a multiracial population of Angus-Nellore, consisting of
animals born from 1992 to 2002 in 83 farms located in Central West, Southeast and South Brazil, were analyzed. The studied visual scores were: conformation, indicator of the amount of meat that the animal would produce if it were slaughtered at the time of measurement and, according to Costa et al. (2004), it is closely linked to the limits of deposition of muscle tissue of the animal; precocity, indicator of the deposition of subcutaneous fat and the level of marbling of the animal carcass; musculature, evaluated by convexity of the forms of the animal body, indicating distribution of muscle mass in the carcass and navel, made from a standard reference of its size and of its position in the ventral portion of the body of the animal. The navel is of great importance, especially for Zebu cattle in Brazil, since most animals are raised in grazing system (Conexão Delta G, 2004).
The score in the evaluation of visual scores ranged from 1 to 5, with the extremes representing the minimal and the maximal degree, respectively, of expression of the trait. Each animal was evaluated in relation to its management group, assigning score 3 for the intermediate pattern animal, and the others within the group are evaluated compared to this. It is noteworthy that one implication of this adopted scoring strategy was the occurrence of similarity in frequency distributions of scores for conformation, precocity and musculature (Figure 1). For navel trait, score 1 was assigned to animals with very pendulous navels, away from the ventral region, which is typical of Zebu, and score 5 to animals with short and well targeted navels, which is functionally desired (Koury Filho et al., 2003). Based on this criterion, the assignment of the notes implied in the frequency distribution of animals (Figure 1), whose values indicate the prevalence of the Zebu trait.
The issue of data was performed with SAS statistical software (SAS, 2001). Four stations were set up according
to the date of birth of the animals, specified as it follows: station 1, animals born from January to March; 2, from April and June; 3, from July to September; and 4, from October to December. Contemporaneous groups were created, bringing together animals born on the same farm, in the same year and in the same season of birth and in the same management group. The animals were divided according to their genetic composition in genetic groups (GGA = genetic group of animal) and to the mother of the animal (GGM = genetic group of the mother), both in classes and formed by the contribution of the Angus (A) and Nellore (N) fraction, with five different groups predetermined by the company that supplied the data file for this population (Table 1).
It was eliminated from the work file all animals with no record of weight at weaning or of at least one visual score; castrated females and males; contemporaneous groups with less than five observations; and bulls with less than five offspring. Another exclusion criterion was also imposed: animals outside the limits of ± 2.5 standard deviations from the average of weight at weaning within the population were discarded. So, after editing, the file was made up of 39,676 records of animals, sired by 1,002 bulls and 32,758 cows (Table 1), which were grouped in 792 contemporaneous groups. The mean and standard deviation of age of the animals was 219.82 ± 38.43 days and the relationship matrix was composed of 73,104 animals.
The analysis of variance was performed using the Stepwise procedure, in order to proceed to the choice of the best model for each trait, based on the maximum value of R-squared. This procedure allows the inclusion or exclusion of effect of the analysis model, as well as changes in the order of entry of effects in the model, besides allowing the verification of possible confounding interactions between the effects.
The direct heterozygosity was calculated as: hij = αtiαvj + αtjαvi in which αti and αvi represent the proportion of the gene of the breed “i” in the mother and father of the animal, respectively. The heterozygous mother was estimated following the same reasoning.
The genetic parameter estimation and the prediction of breeding values were obtained using the method of
Restricted Maximum Likelihood Derivative Free, through the MTDFREML program (Boldman et al., 1995), adopting an animal model. The convergence of the analysis was considered when the value of -2LogL suffered no further changes after reboot with the priors from the previous analysis, adopting the convergence criterion of 10-9.
In the model, it was considered as random effect the direct and maternal additive genetic and the residual effects, and as fixed effects, the effect of contemporaneous group and the effects of the genetic group of the animal (GGA) and the mother (GGM) (both in classes). It was considered as covariates the age at weaning and age at calving, both on days and with linear and quadratic effects, in addition to direct and maternal heterosis, both with only linear effect. The mean number of calves per cow was 1.21 and it does not justify the inclusion of permanent environmental effects in the model of analysis.
The variance components for weight at weaning and visual scores were obtained in univariate analyzes, and then the components of covariance between these traits were processed from all possible two-trait analysis. The effects included in the model of analyzes were the same as the previously described ones.
Regarding to the matrix, the equation of mixed models for obtaining the best linear unbiased prediction (BLUP), is described as:
Y = Xβ + Z1a + Z2m + e,
in which Y = vector of observations for each trait (weight at weaning, conformation, precocity, musculature and navel); X = incidence matrix associated with fixed effects (contemporaneous group, animal genetic group and maternal genetic group); β= solution vector to the fixed effects; Z1 = incidence matrix associated with the direct genetic effect of each animal, random; a = vector of solutions to random direct additive genetic effects; Z2 = incidence matrix associated with the maternal additive genetic effect of each animal, random; m = vector of solutions for random maternal additive genetic effects; e = vector of residues, random.
To determine the genetic trend of the traits, it was used the observed values corresponding to the arithmetic means of breeding values of each group of animals, within their
* Number of animals with records in the work file; ** Number of mothers/cows, in pedigree, without records.
Genetic group Constitution Number of animals* Number of mothers/cows** Number of calving
1 0.719A+0.281N to 0.656A+0.344N 3,585 7,768 9,704
2 0.625A+0.375N to 0.563A+0.437N 25,494 4,355 5,425
3 0.437A+0.563N to 0.375A+0.625N 2,216 3,458 4,897
4 0.344A+0.656N to 0.281A+0.719N 6,984 2,436 2,994
5 0.000A+1.000N 1,397 14,741 16,656
respective year of birth, weighted by the number of observations, obtained by PROC REG (SAS, 2001) procedure, using the following equation:
Yi = bo + b1xi + ei,
in which: Yi = breeding value for the evaluated traits of the ith year of birth; b
o = intercept; b1 = angular coefficient;
xi = ith year of birth; ei = random error.
Results and Discussion
The mean observed for weight at weaning, followed by its coefficient of variation (Table 2) was higher than those found by Guterres et al. (2007) (173.35 ± 13.63%) for the Brangus breed and by Pereira et al. (2000), 143 kg for Charolais × Nellore crossbred, both studies conducted in the state of Rio Grande do Sul, and by Cubas et al., 2001 (167.5) for multibreed Angus × Nelore cattle reared at the Experimental Station IAPAR Paranavaí, northwestern region in the state of Paraná. Furthermore, this average is below those reported by Restle et al. (1999) (221 kg) in Braford cattle and by Cruz et al. (2009) (242 kg) for Angus-Nelore crossbreed population reared at the experimental station of Embrapa Southeast Cattle, São Carlos.
The effect of breed of the animal influenced the weight at weaning, even with small amplitude values, which ranged from 176.38 kg (pure Nellore breed – genetic group 5) (Table 1) to 184.21 kg (Brangus breed – genetic group 2) (Table 1). Similarly, the effect of the genetic group of the cow also influenced the expression of this trait, with values that ranged from 181.58 kg (pure Nellore breed – genetic group 5, table 1) to 191.59 kg (Brangus breed – genetic group, table 1), pointing that crossbred cows have higher maternal ability in comparison to the pure ones, possibly because of higher amount of milk for the calf, among other causes, and probably because of the effect of maternal heterosis.
The values found for conformation, precocity and musculature were similar to those obtained by Jorge Jr. et al. (2004) for the Nellore breed. These authors reported means and standard deviations of 3.16 ± 0.94; 3.19 ± 0.96 and 3.07 ± 0.97, respectively and also in relation to those of Forni et al. (2007), who obtained 3.08 ± 0.85; 3.26 ± 0.84 and
3.06 ± 0.87 for the same breed, respectively. On the other hand, Cardoso et al. (2001) reported average values lower than in this study (2.92 ± 1.10; 3.09 ± 1.08; and 2.97 ± 1.06, respectively) for the Angus breed in the State of Rio Grande do Sul. These values are within the expectations since, according to Cardoso et al. (2001), the scores are assigned in relation to contemporaneous group and the considered average animal receives score three.
To navel score, Koury Filho et al. (2003) found a mean of 3.09 for Nellore animals, higher than in this study (2.13). This mean was expected to be higher, since the Angus breed is proportionally present in 76% of the animals of this work, however, there is a predominance of the Zebu breed in the expression of this trait (Figure 1). The discussion of the visual scores refers only to pure breed animals, since no studies addressing these traits in livestock multiracial have been published so far.
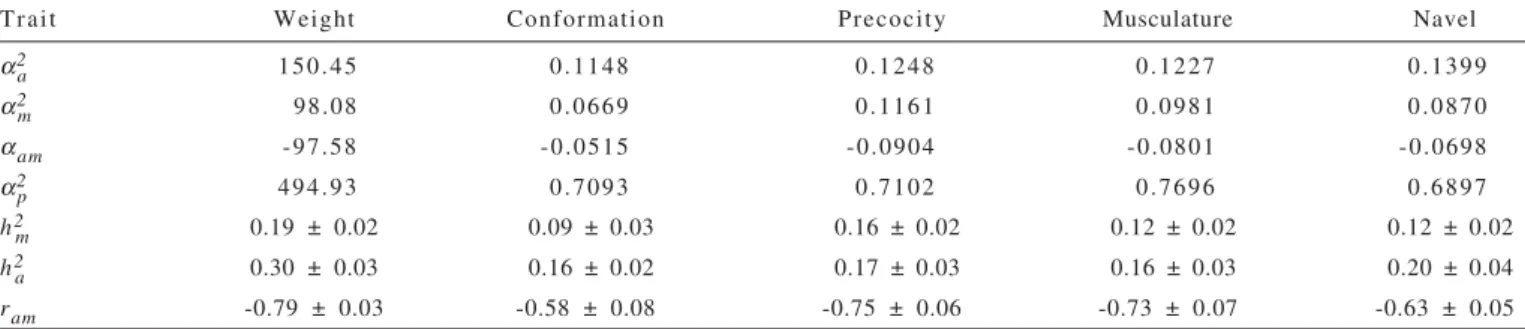
The analyzed traits were influenced by significant maternal additive effects (Table 3). For weight at weaning, maternal effects contributed with about 19% of the total variance, and for visual scores, the influence of this effect varied from 9 to 16%, justifying its inclusion in the analysis model, a fact deemed necessary by Bocchi et al. (2008) to weight traits in the pre-weaning in multi-racial population. The heritability estimate of the maternal additive genetic effect (h2m) for weight at weaning was higher than the values reported by Albuquerque & Meyer (2001) and Koury Filho et al. (2003) for the Nellore cattle, whose values ranged from 0.06 to 0.13, as well as the 0.11 value reported by Weber et al. (2009) for animals from the Angus breed. However, estimates obtained in this work are lower than those published by Ribeiro et al. (2001) and Lopes et al. (2008) for the Nellore cattle from 0.20 to 0.36, and by Everling et al. (2001), of 0.29 for Angus-Nellore cattle. Values similar to this work (0.20) were reported by Bertrand & Benyshek (1987) and Lopes et al. (2009) for the Brangus breed and by Bocchi et al. (2008) for a mixed population, 0.16.
The value of 0.30 estimated for the heritability of direct genetic effect (h2a) for weight at weaning (Table 3) was higher than 0.28 estimated by Bertrand & Benyshek (1987) for the Brangus breed and of 0.23 reported by Everling et al.
Trait No. of observations Mean Standard-deviation (kg) Coefficient of variation (%) Minimum Maximum
Weight (kg) 39,676 182.99 33.43 18.26 9 9 267
Conformation (points) 39,676 3.24 0.95 29.36 1 5
Precocity (points) 39,676 3.19 0.94 28.74 1 5
Musculature (points) 39,676 3.28 0.97 30.51 1 5
Navel (points) 39.676 2.13 0.93 43.70 1 5
(2001) for a multiracial population of Angus-Nelore, but it is equal to the 0.30 value reported by Bocchi et al. (2008) to a mixed breed. On the other hand, it was lower than the values found by Lopes et al. (2009) (0.43) for the Brangus breed and by Pons et al. (1989) for the Hereford breed (0.37). Somehow, the obtained heritability values are included in the range found in the literature for both pure populations and to crossbreed. However, inclusion of maternal effect in the model was essential to better estimate the direct effect, as reported by Bocchi et al. (2008), who affirmed that the estimates are inflated when the maternal effect in the model is not considered.
The heritability estimates obtained for conformation, precocity and musculature (Table 3) were similar and ranged from 0.16 to 0.20 for direct and from 0.09 to 0.16 for maternal effects. This result indicates the existence of moderate genetic variability in the population, therefore, with the possibility of obtaining genetic gain through selection for these traits. However, there is no standardization in the evaluation systems of these scores in different farming systems, which limits its recommendation as a good phenotypic marker for use in selection, whereas even to the Nellore breed, the found variation is wide. Estimates of h2a obtained for the scores were higher than those reported by Forni et al. (2007), whose values were 0.12 for conformation, 0.15 for precocity and 0.12 for musculature, however, they were lower than those reported by Jorge Jr. et al. (2004) of 0.33 for conformation, 0.39 for precocity and 0.34 for musculature; and by Koury Filho et al. (2009), of 0.63 for precocity to 0.48 for musculature of the Nellore breed.
Likewise, genetic variation for the navel score was found, with value of direct heritability lower than the reported by Koury Filho et al. (2003) for Nelore breed (0.29); higher than the described by Viu et al. (2002) for Angus and Brangus breeds (0.06) and close to the obtained by Kriese et al. (1991) for Brahman, Brangus, Beefmaster and Saint
Gertrudis breeds (0.21). Lagos & Fitzhugh Jr. (1970), using the least squares method, found the value 0.35 for products from the crossing of Bos taurus × Bos indicus, values which are quite higher than those verified in this study. Thus, the heritability estimates of average magnitude found in this study indicate that the population would respond significantly to the direct selection by using visual scores as a criterion. It is noteworthy that the estimated values for the navel, by its magnitude, would respond to the selection for navel decrease, which is functionally important, especially for animals with larger zebu constitution, which predominate in this work.
It is noteworthy that the genetic correlations between direct and maternal effects (Table 3) were negative for all traits, ranging from -0.79 to -0.58, which highlights the antagonism among these effects, confirming the need to include these two effects in the model to estimate the parameters, which would make the selection more efficient. However, in this case, one statement by Schaeffer (1996) also deserves attention, because he states that the negative correlation may result from the estimate of maternal effect as a linear function of the direct effect when there are many bulls that do not have their daughters weaning products; so, the present correlation between the direct and maternal effects is equal to minus one (-1), because there was no notice or actual data to estimate the maternal effect; the value was solely based on the direct effect. Another factor to be taken into consideration is the fixation of the covariance between direct and maternal effect as zero, which may have contributed to this antagonism.
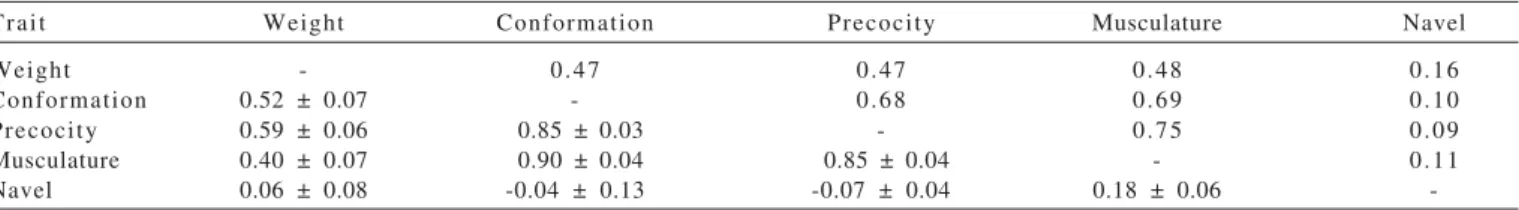
The direct genetic correlations between weight at weaning and conformation, precocity and musculature (Table 4) were moderate, ranging from 0.40 to 0.59, and they indicate the possibility of common genes in determining these traits, and that the selection of one would promote a gene gain in the others.
Trait Weight Conformation Precocity Musculature Navel
α2
a 150.45 0.1148 0.1248 0.1227 0.1399
α2
m 98.08 0.0669 0.1161 0.0981 0.0870
αa m -97.58 -0.0515 -0.0904 -0.0801 -0.0698
α2
p 494.93 0.7093 0.7102 0.7696 0.6897
h2m 0.19 ± 0.02 0.09 ± 0.03 0.16 ± 0.02 0.12 ± 0.02 0.12 ± 0.02
h2
a 0.30 ± 0.03 0.16 ± 0.02 0.17 ± 0.03 0.16 ± 0.03 0.20 ± 0.04
ram -0.79 ± 0.03 -0.58 ± 0.08 -0.75 ± 0.06 -0.73 ± 0.07 -0.63 ± 0.05
α2
a = direct variance; α2m = maternal variance; αam = direct-maternal covariance; αp2 = phenotypic variance; hm2 = maternal heritability; h2a = direct heritability; ram = correlation for the direct/maternal genetic effect.
High correlations, both phenotypic and genetic, were also observed among conformation, precocity and musculature, with amplitude from 0.85 to 0.90 (Table 4). These scores describe the potential for the production of meat from the animal as a whole, i.e., they are direct components of the body weight of the animal; one that proves itself to be easier to measure, with higher heritability and it is less influenced by the evaluator would be recommended as a selection criterion. On the other hand, the genetic correlation of the navel with weight at weaning (Table 4) was low (0.06), similar to the -0.04 observed by Koury Filho et al. (2003) for the Nellore breed, suggesting that these traits can be determined by genes from non-pleiotropic effect, indicating that selection for increase weight does not necessarily lead to higher scores for navel. Low correlations, both genetic and phenotypic, were also observed in relation to other visual scores, where the genetic correlation between navel and visual scores of conformation, precocity and muscles were -0.04, -0.07 and 0.18, respectively.
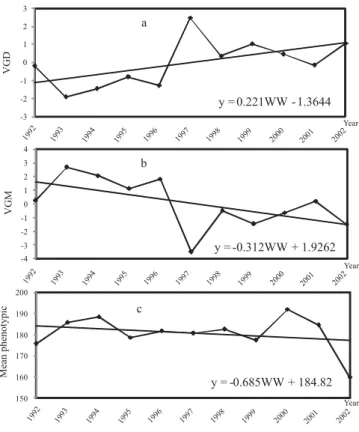
Overall, the average genetic values and mean phenotypes for weight at weaning and visual scores, stratified by evaluated year, varied among years (Table 5). The oscillatory behavior of the annual mean direct genetic value (VGD) for weight at weaning, with difference of more than 4 kg between the most positive (1997) and most negative (1993) direct genetic value may be due to genetic diversity in the studied population, i.e., only the effect of the difference in racial composition among generations because it is a crossbreed, which would limit the statement, at first, that there have been no program directed to the improvement of this trait, since the mean phenotype was negative. The non-significance of direct and maternal genetic trends (P<0.3219 and P<0.2029, respectively), representing 0.02 and 0.03% respectively, of the mean phenotype (Figure 2), also reinforce these arguments, whereas the average weight at weaning around 182 kg (Table 2) was still quite below the upper limit for the cattle.
The direct genetic trend (Figure 2a) was 221.0 g/year, with value higher than those obtained by Corrêa et al. (2006) for the Devon breed, of 55.1 g/year, but similar to that of
220.9 g/year obtained by Weber et al. (2009) for the Aberdeen Angus breed, indicating that the direct genetic gain in the years studied in this population is improving. The maternal genetic trend found in this study was -312.0 g/year, lower than that reported by Corrêa et al. (2006) for the Devon breed (-23.6 g/year). Obtainment of negative estimates for the maternal genetic trend was due to the finding of negative correlation between direct effects and maternal effects (Table 2), indicating inversely proportional quantities, however, in this regard, it should be considered the previously commented arguments by Schaeffer (1996).
However, the phenotypic trend presented significantly (P<0.0001) negative value (-685.2 g/year), representing 0.38% of mean phenotype (Figure 2c), indicating a major contribution from sources of non-genetic variation, for weight at weaning in the period, preventing these animals to express their full phenotype genetic potential, as represented by direct genetic trend. However, another explanation for this trend is the high genetic diversity of the studied population, reducing the number of animals in the latest year and because the data was not adjusted to a standard age, therefore, changes in base had a very big effect on this trait.
However, genetic gains have been moderate in Brazilian cattle, and in this respect, Ferraz Filho et al. (2002) published lower gains of 0.08% of increase in mean phenotype for weight adjusted to 205 days of age for the Tabapuã breed. Also, genetic gains in percentage of the mean phenotypic traits of weight and weight gain until the weaning phase; they have been reported to range from 0.026 to 0.66% respectively, by Fernandes et al. (2002) for the Charolais breed and by Mello et al. (2002) for the Canchim breed.
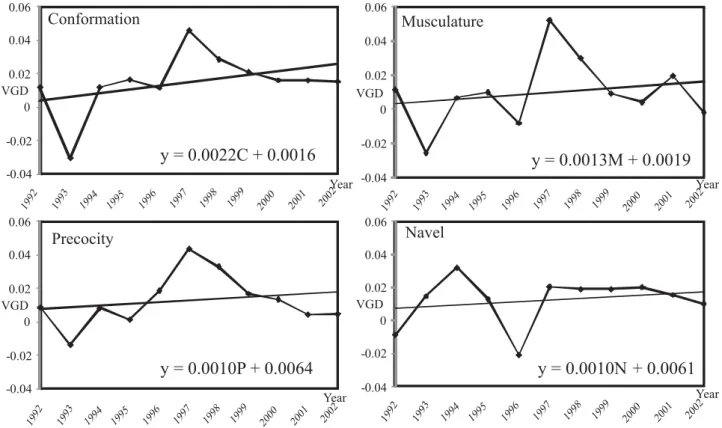
For visual scores, the behavior of direct genetic values were similar to those found in weight at weaning, averaging 0.015 for conformation, 0.013 for precocity, 0.010 for musculature and 0.012 for navel. However, a tendency of mild increases in visual scores (Figure 3) was observed, there was no positive relationship with their mean phenotypes (Figure 5), which remained steadily decreased throughout the period of study.
Trait Weight Conformation Precocity Musculature Navel
Weight - 0.47 0.47 0.48 0.16
Conformation 0.52 ± 0.07 - 0.68 0.69 0.10
Precocity 0.59 ± 0.06 0.85 ± 0.03 - 0.75 0.09
Musculature 0.40 ± 0.07 0.90 ± 0.04 0.85 ± 0.04 - 0.11
Navel 0.06 ± 0.08 -0.04 ± 0.13 -0.07 ± 0.04 0.18 ± 0.06
-1All correlations were significant at P<0.0001.
Estimates of direct genetic trend for conformation, musculature, and precocity were similar, with values of 0.014; 0.010; 0.012, respectively, for the annual genetic gain, representing 0.45; 0.30 and 0.38% of the mean phenotypic, already indicated by the non-significance of these values (P<0.437, P<0.436 and P<0.647, respectively), showing the variability in the genetic progress of this population. For the navel, this value was 0.012, which represented 0.57% of the mean phenotypic, however, even by the scale, this value was not significant (P<0.354). This behavior has been observed in several breeds, as pointed out by Forni et al. (2007), who found similar gains in this study for conformation, musculature and precocity of the order of 0.013, 0.018 and 0.022, respectively, representing 0.42; 0.60 and 0.67% of the mean phenotypic of these traits in the Nellore breed. Weber et al. (2009) had lower results for the Aberdeen Angus breed, with estimates of conformation, musculature and precocity of 0.0046; 0.0044 and 0.003, respectively, for the annual genetic gain, representing 0.15; 0.14 and 0, 09% of the mean phenotype.
For maternal genetic trends (Figure 4), estimates were found very close to zero, indicating that genetic changes resulting from this effect for the four traits were practically null and they represent, in the mean phenotypic, an annual Figure 2 - Genetic trends: (a) direct, (b) maternal and (c) phenotypic, in kilograms, for weight at weaning (WW).
Visual scores and weight at weaning
Year
No. of animals
Weight Conformation Precocity M us cu la tu re Navel per year Direct genetic M ea n Direct genetic Mean Direct genetic Mean D ir ect genetic M ea n Direct genetic M ea n value Phenotypic value Phenotypic value Phenotypic value Phenotypic value Phenotypic 1992 2528 -0.1868 175.82 0.0117 3 .1 3 6 0.0087 3.1191 0.0115 3.1863 -0.0088 2.4126 1993 2675 -1.9134 185.79 -0.0305 3.293 -0.0136 3.3473 -0.0257 3.1699 0.0148 2.4309 1994 4055 -1.4568 188.41 0.0118 3 .4 6 6 0.0083 3.5864 0.0066 3.4618 0.0322 2.3535 1995 2594 -0.7951 178.58 0.0163 3 .3 3 8 0.0012 3.3974 0.0098 3.3144 0.0131 2.0518 1996 2540 -1.2828 181.83 0.0115 3 .3 7 2 0.0185 3.4173 -0.0083 3.2378 -0.0209 1.9893 1997 3351 2.4701 180.79 0.0459 3 .2 6 6 0.0435 3.2933 0.0519 3.2049 0.0206 2.1533 1998 3814 0.3431 182.63 0.0286 3 .2 7 5 0.0327 3.3109 0.0298 3.3009 0.0189 2.1263 1999 5192 1.0274 177.53 0.0211 3 .2 2 8 0.0168 3.2379 0.0089 3.1588 0.0189 2.0797 2000 7016 0.4628 191.94 0.0159 3 .1 5 2 0.0136 3.2048 0.0039 3.1023 0.0202 2.0797 2001 4991 -0.1399 184.59 0.0159 3 .0 7 1 0.0043 3.1523 0.0195 3.0278 0 .0155 1.9356 2002 9 2 0 1.0513 159.86 0.0152 3 .3 4 1 0.0048 3.0251 -0.0019 3.0842 0.0102 1.9431
Table 5 - Year of birth, number of animals per year, annual averages of direct genetic values and phenotypic annual averages fo
contribution of -0.02 (P<0.281); -0.1 (P<0.249); -0.2 (P<0.393) and 0.002% (P<0.659), respectively, for conformation, musculature, precocity and navel. According to Forni et al. (2007), few studies have evaluated changes promoted by maternal effects in beef cattle. For Nellore, these authors found values of -0.002, -0.001 and 0.0009 respectively for conformation, precocity and musculature, which represents a reduction of -0.07; -0.03 and -0.03% in mean phenotype. Genetic trends close to zero, according Euclides Filho et al. (2000), are not uncommon in the available literature, especially when they result from evaluations using data from commercial herds, whose selection criteria are not well defined and, basically, they are not uniform.
However, the phenotypic trend (Figure 5) was opposed to genetics for all visual scores, i.e., there was a decrease of -0.0102; -0.0219; -0.0256 and -0.0453 points/year (all at P<0.0001), for conformation, musculature, precocity and navel, which may be related to inconsistency in the classification of the scores, or even by environmental influences acting on the expression of these traits. Another factor that should be taken into account is the period during which these animals were assessed, which represents 10 years, corresponding to about 2.5 generations.
Moreover, these phenotypic trends for the visual scores of conformation, musculature and precocity may be related to market demand, i.e., there is a demand for animals that fit in this range for these visual scores.
However, more attention should be directed to weight at weaning and navel, in view of the significant decrease of their values during the analysis period, which would decrease the profitability of the system in addition to increasing rates of animals with pendulous belly button.
Conclusions
The heritability coefficient for all traits indicates considerable direct additive genetic variability, showing that it is possible to obtain genetic gain through selection. Genetic correlations among weight and conformation score, precocity and musculature show the possibility of correlated response. Estimated genetic trends indicate the great contribution of sources of non-genetic variation for all traits in the studied period, preventing these animals to express, phenotypically, all their genetic potential. However, it is recommended that further studies should be made with files representing a longer period.
References
ALBUQUERQUE, L.G.; MEYER, K. Estimates of direct and maternal genetic effects for weights from birth to 600 days of age in Nelore cattle. Journal of Animal Breeding and
Genetic, v.118, p.83-92, 2001.
BERTRAND, J.K.; BENYSHEK, L.L. Variance and covariance estimates for maternally influenced beef growth traits. Journal
Animal Science, v.64, n.3, p.728-734, 1987.
BOCCHI, A.L.; OLIVEIRA, H.NO.; FERRAZ, J.B.S. et al. Avaliação genética multirracial para ganho de peso pré-desmama em bovinos de uma população composta. Revista Brasileira de
Zootecnia, v.37, n.7, p.1207-1215, 2008.
BOLDMAN, K.G.; KRIESE, L.A.; Van VLECK, L.D. et al. A manual for use of MTDFREML. A set of program to obtain
estimates of variances and covariances (DRAFT). Lincoln:
Department of Agriculture/Agricultural Research Service, 1995. 120p.
CARDOSO, F.F.; CARDELLINO, R.A.; CAMPOS, L.T. Componentes de (co)variância e parâmetros genéticos para caracteres produtivos à desmama de bezerros Angus criados no estado do Rio Grande do Sul. Revista Brasileira de Zootecnia, v.30, n.1, p.41-48, 2001.
CONEXÃO DELTA G. Sumário de avaliação de reprodutores. Porto Alegre: GenSys Consultores Associados S/C Ltda, 2004. 30p.
CORRÊA, M.B.B.; DIONELLO, NO.J.L.; CARDOSO, F.F. Estimativa de parâmetros genéticos, componentes de (co)variância e tendências genéticas e fenotípicas para características produtivas pré-desmama em bovinos Devon no Rio Grande do Sul. Revista Brasileira de Zootecnia, v.35, n.3, p.997-1004, 2006 (supl.).
COSTA, Z.; MEIRELLES, S.L.; BOCCHI, A.L. et al. Escores visuais de CPM: avaliação da qualidade de carcaça. 2004. Disponível em: <http://www.beefpoint.com.br> Radares Técnicos (Melhoramento Genético) Acesso em: 30/9/2009.
CRUZ, G.M.; RODRIGUES, A.A.; TULLIO, R.R. et al. Desempenho de bezerros da raça Nelore e cruzados desmamados recebendo concentrado em pastagem adubada de Cynodon dactylon cv. Coastcross. Revista Brasileira de Zootecnia, v.38, n.1, p.139-148, 2009.
CUBAS, A.C.; PEROTTO, D.; ABRAHÃO, J.J.S. et al. Desempenho até a desmama de bezerros Nelore e cruzas com Nelore. Revista
Brasileira de Zootecnia, v.30, n.3, p.694-701, 2001.
EUCLIDES FILHO, K.; SILVA, L.O.C.; ALVES, R.G.O. et al. Tendência genética da raça Gir. Pesquisa A g ropecuária
Brasileira, v.35, n.4, p.787-791, 2000.
EVERLING, D.M.; FERREIRA, G.B.B.; RORATO, P.R.N. et al. Estimativas de herdabilidade e correlação genética para características de crescimento na fase de pré-desmama e medidas de perímetro escrotal ao sobreano em bovinos Angus-Nelore.
Revista Brasileira de Zootecnia, v.30, n.6, p.2002-2008,
2001 (supl.).
FERNANDES, H.D.; FERREIRA, G.B.B.; RORATO, P.R.N. Tendências e parâmetros genéticos para características prédesmama em bovinos da raça Charolês criados no Rio Grande do Sul. Revista Brasileira de Zootecnia, v.31, n.1, p.321-330, 2002 (supl.).
FERRAZ FILHO, P.B.; RAMOS, A.A.; SILVA, L.O.C. et al. Herdabilidades e correlações genéticas, fenotípicas e ambientais para pesos em diferentes idades de bovinos da raça Tabapuã.
Archives of Veterinary Science, v.7, n.1, p.75-79, 2002.
FORNI, S.; FEDERICI, J.F.; ALBUQUERQUE, L.G. Tendências genéticas para escores visuais de conformação, precocidade e musculatura à desmama de bovinos Nelore. Revista Brasileira
de Zootecnia, v.36, n.3, p.572-577, 2007.
FRIES, L.A. Uso de escores visuais em programas de seleção para a p r o d u t i v i d a d e e m g a d o d e c o r t e . I n : S E M I N Á R I O NACIONAL - REVISÃO DE CRITÉRIO DE JULGAMENTO E SELEÇÃO EM GADO DE CORTE, 1996, Uberaba. Anais... Uberaba: Associação Brasileira de Criadores de Zebu, 1996. p . 1 - 6 .
GUTERRES, L.F.W.; RORATO, P.R.N.; BOLIGON, A.A. et al. Efeito da inclusão da covariância genética aditiva direta-m a t e r n a n o direta-m o d e l o d e a n á l i s e s o b r e a direta-m a g n i t u d e d a s estimativas de parâmetros e valores genéticos preditos para ganho de peso na raça Brangus. Ciência Rural, v.37, n.6, p.809-814, 2007.
JORGE JR., J.; DIAS, L.T.; ALBUQUERQUE, L.G. Fatores de correção de escores visuais de conformação, precocidade e musculatura, à desmama, para idade da vaca ao parto, data juliana de nascimento e idade à desmama em bovinos da raça N e l o r e . R e v i s t a B r a s i l e i r a d e Z o o t e c n i a, v. 3 3 , n . 6 , p.2044-2053, 2004 (Suppl. 2).
KIPPERT, C.J.; RORATO, P.R.N.; CAMPOS, L.T. et al. Efeito de fatores ambientais sobre escores de avaliação visual à desmama e estimativa de parâmetros genéticos, para bezerros da raça Charolês. C i ê n c i a R u r a l, v.36, n.2, p.579-585, 2 0 0 6 .
KOURY FILHO, W.; JUBILEU, J.S.; ELER, J.P. et al. Parâmetros genéticos para escore de umbigo e características de produção em bovinos da raça Nelore. Arquivo Brasileiro de Medicina
Veterinária e Zootecnia, v.55, n.5, p.594-598, 2003.
KOURY FILHO, W.; ALBUQUERQUE, L.G.; ALENCAR, M.M. et al. Estimativas de herdabilidade e correlações para escores visuais, peso e altura ao sobreano em rebanhos da raça N e l o r e . R e v i s t a B r a s i l e i r a d e Z o o t e c n i a, v. 3 8 , n . 1 2 , p.2362-2367, 2009.
KRIESE, L.A.; BERTRAND, J.K.; BENSYSHEK, L.L. Genetic and environmental growth trait parameter estimates for Brahman and Brahman-derivative cattle. Journal of Animal
S c i e n c e, v.69, p.2362-2370, 1991.
LAGOS, F.; FITZHUGH JR., H.A. Factors influencing preputial prolapse in yearling bulls. Journal Animal Science, v.30, p.949-952, 1970.
L O N G, R . A . E l s i s t e m a d e e v a l u a c i ó n d e A n k o n y y s u
a p l i c a c i ó n e n l a m e j o r a d e l g a n a d o. Colorado: Ankony
Corporation, 1973. 21p.
LOPES, J.S.; RORATO, P.R.N.; WEBER, T. et al. Efeito da interação genótipo x ambiente sobre o peso ao nascimento, aos 205 e aos 550 dias de idade de bovinos da raça Nelore na Região Sul do Brasil. R e v i s t a B r a s i l e i r a d e Z o o t e c n i a, v.37, n.1, p.54-60, 2008.
LOPES, J.S.; RORATO, P.R.N.; WEBER, T. et al. Parâmetros g e n é t i c o s e t e n d ê n c i a s g e n é t i c a e f e n o t í p i c a p a r a características de crescimento em uma população da raça B r a n g u s . R e v i s t a B r a s i l e i r a d e Z o o t e c n i a, v. 3 8 , n . 4 , p.662-669, 2009.
MARCONDES, C.R.; BERGMANN, J.A.G.; ELER, J.P. et al. Análise de alguns critérios de seleção para características de crescimento na raça Nelore. Arquivo Brasileiro de Medicina
Veterinária e Zootecnia, v.52, n.1, p.83-89, 2000.
MELLO, S.P.; ALENCAR, M.M.; SILVA, L.O.C. et al. Estimativas de co(variâncias) e tendências genéticas para pesos em um rebanho Canchim. Revista Brasileira de Zootecnia, v.31, n.3, p.1707-1714, 2002.
P E R E I R A , L . P. ; R E S T L E , J . B R O N D A N I , I . L . e t a l . Desenvolvimento ponderal de bovinos de corte de diferentes grupos genéticos de Charolês x Nelore inteiros ou castrados aos oito meses. C i ê n c i a R u r a l, v.30, n.6, p.1033-1039, 2 0 0 0 .
PONS, S.B.; MILAGRES, J.C.; TEIXEIRA, N.M. Efeitos de fatores genéticos e de ambiente sobre o crescimento e o escore de conformação em bovinos Hereford no Rio Grande do Sul. I - Peso e escore de conformação à desmama. Revista
RESTLE, J.; VAZ, F.N.; BRONDANI, I.L. et al. Estudo da carcaça de machos braford desmamados aos 72 ou 210 dias, abatidos a o s c a t o r z e m e s e s . P e s q u i s a A g r o p e c u á r i a B r a s i l e i r a, v.34, n.11, p.2137-2144, 1999.
RIBEIRO, M.N.; PIMENTA FILHO, E.C.; MARTINS, G.A. et al. Herdabilidade para efeitos direto e materno de características de crescimento de bovinos nelore no Estado da Paraíba.
Revista Brasileira de Zootecnia, v.30, n.4, p.1224-1227,
2 0 0 1 .
STATISTICAL ANALYSIS SYSTEM - SAS - SAS user’s guide: statistical. Cary: Analysis System Institute, 2001. 1290p.
SCHAEFFER, L.R. Tópicos avançados em melhoramento
animal: random regression models (notas do curso). Jaboticabal:
FCAV, p.25-33, 1996.
VIU, M.; TONHATI, H.; CERÓN-MUÑOZ, M.F. et al. Parâmetros genéticos do peso e escores visuais de prepúcio e umbigo em gado de corte. Ars Veterinária, v.18, p.179-184, 2002. WEBER, T.; RORATO, P.R.N.; LOPES, J.S. et al. Parâmetros
g e n é t i c o s e t e n d ê n c i a s g e n é t i c a s e f e n o t í p i c a s p a r a características produtivas e de conformação na fase pré-desmama em uma população da raça Aberdeen Angus. Revista