Bayesian inference in genetic parameter estimation of visual scores
in Nellore beef-cattle
Carina Ubirajara de Faria
1, William Koury Filho
2,Cláudio Ulhôa Magnabosco
3,
Lucia Galvão de Albuquerque
4, Luiz Antônio Framartino Bezerra
5and Raysildo Barbosa Lôbo
6 1Universidade Federal de Goiás, Campus de Jataí, Jataí, GO, Brazil.
2
Brasilcomz Zootecnia Tropical, Jaboticabal, SP, Brazil.
3Embrapa Cerrados, Planaltina, DF, Brazil.
4
Universidade Estadual Paulista, Faculdade de Ciências Agrárias e Veterinárias, Jaboticabal, SP, Brazil.
5
Universidade de São Paulo, Faculdade de Medicina de Ribeirão Preto, Departamento de Genética,
Ribeirão Preto, SP, Brazil.
6
Associação Nacional de Criadores e Pesquisadores, Ribeirão Preto, SP, Brazil.
Abstract
The aim of this study was to estimate the components of variance and genetic parameters for the visual scores which constitute the Morphological Evaluation System (MES), such as body structure (S), precocity (P) and musculature (M) in Nellore beef-cattle at the weaning and yearling stages, by using threshold Bayesian models. The information used for this was gleaned from visual scores of 5,407 animals evaluated at the weaning and 2,649 at the yearling stages. The genetic parameters for visual score traits were estimated through two-trait analysis, using the threshold animal model, with Bayesian statistics methodology and MTGSAM (Multiple Trait Gibbs Sampler for Animal Models) threshold software. Heritability estimates for S, P and M were 0.68, 0.65 and 0.62 (at weaning) and 0.44, 0.38 and 0.32 (at the yearling stage), respectively. Heritability estimates for S, P and M were found to be high, and so it is ex-pected that these traits should respond favorably to direct selection. The visual scores evaluated at the weaning and yearling stages might be used in the composition of new selection indexes, as they presented sufficient genetic vari-ability to promote genetic progress in such morphological traits.
Key words:morphological traits, threshold model, genetic parameters, Nellore. Received: October 22, 2008; Accepted: February 3, 2009.
Introduction
In Brazilian genetic improvement programs, consid-eration has been given to growth traits involving the evalu-ated of weight at different standard ages its gain as criteria for selection in Zebu beef-cattle. The use of these criteria has effectively contributed to the increase in productive performance indices, especially for the Nellore breed. It is noticeable that present day Nellore herds, when it comes to production, are in no way similar to those introduced into Brazil through importation in 1962.
Although, the Nellore population has excelled in body weight, there has been little improvement in finishing precocity and carcass quality. According to Forni et al.
(2007), weight measurements at certain ages are insuffi-cient to evaluate animal yield and carcass quality at the time of slaughter. However, research involving the estimation of
variance components and genetic parameters for traits which are directly involved in the evaluation of carcass quality (longissimus muscle area, backfat thickness, fat thickness and meat tenderness) in Nellore beef-cattle, has shown that there is sufficient genetic variability for such traits, thus paving the way for achieving genetic progress through selection.
Although the carcass quantitative traits, evaluated through ultrasound, allow direct selection for such traits, other indirect measurements can also lead to genetic prog-ress in meat quality. With this in mind, use has been made in various selection programs of information on morpho-logical traits as evaluated by visual scores, with a view to obtaining genetic progress in finishing precocity and car-cass maturity and quality in Zebu beef-cattle. Nonetheless, there are only a few studies on estimating genetic and envi-ronmental parameters for these visual evaluation traits (Eleret al., 1996; Jorge Júnioret al. 2004; Koury Filho, 2005; Kippertet al., 2006; and Fariaet al., 2008a).
www.sbg.org.br
Send correspondence to Carina Ubirajara de Faria. Universidade Federal de Goiás, Campus de Jataí, BR 364, km 192, Caixa Postal 03, 75800-000 Jataí, GO, Brazil. E-mail: [email protected].
According to Lôboet al.(2008), the market trend is to seek animals which are more precocious and economically viable, and that remain less time in pastures or feedlots, thereby shortening the production cycle. With this in mind, the National Association of Breeders and Researchers (Associação Nacional de Criadores e Pesquisadores -ANCP) and the company Brasilcomz developed the Mor-phological Evaluation System (MES, Sistema de Avaliação Morfológica - SAM), which applies modern procedures to collecting data on visual scores for the traits body structure (S), precocity (P), musculature (M) and navel (N), aiming at improving genetic evaluation, and through this, the gen-eration of new selection indexes.
Care must be taken in the genetic evaluation of mor-phological traits, as data do not present a normal distribu-tion. Souza et al. (2000) and Marcondes et al. (2005) recommended the use of threshold models as they present higher efficacy in detecting genetic variability when com-pared to linear models. The threshold model is based on the assumption that classes of observable data are related to the delineation of a normal variable or an underlying continu-ous scale, which is usually called the liability (Sorensenet al., 1995 and Van Tassellet al., 1998). This liability scale is defined by Gianola and Foulley (1983) as the sum of all those environmental and genetic effects influencing the susceptibility of the trait. Thus, it is assumed that there is a non-observable random variable, associated to the levels in each categorical trait and containing the fixed and random effects.
Therefore, the aim of this work was to estimate vari-ance components and genetic parameters for those visual scores which constitute the Morphological Evaluation Sys-tem such as body structure (S), precocity (P) and muscula-ture (M) in Nellore beef-cattle, evaluated at the weaning and yearling stages, through the use of threshold Bayesian models.
Material and Methods
Information was resorted to from visual scores of 5,407 animals evaluated at weaning and 2,649 at the year-ling stage, respectively born to 135 and 224 bulls and 2,274 and 2,314 cows. The animals were of the Nellore breed and belonged to herds which took part in the Brazilian Nellore Program of the National Association of Breeders and Re-searchers (ANCP). The visual scores of MES evaluated in this paper were: body structure (S), precocity (P) and mus-culature (M). The animals were visually evaluated by means of MES methodology (Koury Filho, 2005), in which body length and animal height are evaluated for S, for P the relationship between rib-depth and limb-height and; for M muscle distribution and length.
Scores from one to six points could be attributed to the tested animals for each morphological variable. When compared to its contemporary group, an animal which is considered intermediate (three or four points) for a specific
trait, represents the reference for the classification of those below (one or two points) and above (five or six points) the mean. Data collection for the MES was done by qualified technicians from Brasilcomz.
On applying MES methodology to visual evaluation, the animals from the same management lot were individu-ally evaluated individuindividu-ally by the same technician. Each lot was composed of animals of the same sex and time birth abiding under the same food and sanitary conditions. The entire management lot was taken into consideration, in an attempt to visualize the average profile for each morpho-logical trait evaluated. In this way, visual evaluation was comparative, the score being given to each individual in re-lation to the others. The distribution of scores as a percent-age for each morphological trait is presented Table 1.
Structuring of data files was done by means of the Statistical Analysis System (SAS, 2004) program. In order to guarantee data consistency of morphological traits, the interval in the age of the animals followed a variation from 150 to 270 days in relation to 210 days (age of 7 months) and from 490 to 610 days in relation to 550 days (age of 18 months). GLM and REG procedures from SAS (SAS, 2004) software were used to check environmental effects that influence morphological traits. Weights at 120 days (W120) were included in analyses in order to minimize the effects of selection on visual scores. The individual weight (W120) of 6,169 animals was used, mean and standard de-viation being 130 kg and 19 kg, respectively.
Contemporary groups for categorical morphological traits were defined, taking into account the farm, year, sea-son of birth, management lot and the technician responsible for rating lot. As to weight at 120 days, contemporary groups included animals from the same farm, year and sea-son of birth, sex and management lot, on reaching the stipu-lated age. The effect of season of birth was divided into four classes: animals born in the months of January to March, April to June, July to September and October to December.
Genetic parameters for visual score traits were esti-mated through two-trait analyses by means of the threshold animal model, using Bayesian statistic methodology with MTGSAM (Multiple Trait Gibbs Sampler for Animal Mo-dels) threshold software, developed by Van Tassellet al.
(1998).
For visual score traits, sex and age of the dam (six classes) were considered as fixed effects, contemporary groups as random effects and the age of animal at the mo-ment of data collection as covariate (linear effect). The complete model can be represented in matricial notation as follows:
y=Xb+Z a1 +Z p2 +Z c e3 +
represent additive genetic values from each animal,pis the vector of non-correlated random effects of permanent ma-ternal environmental effects,cis the vector of random ef-fects not correlated to contemporary groups,eis the vector of residual random effects, andX,Z1,Z2andZ3are the
inci-dence matrices which link the observations to fixed and random effects: additive genetic direct and non-correlated (maternal permanent environmental and contemporary group), respectively. The relationship matrix included 26,893 animals from the Nellore breed.
Threshold models usually present certain some prob-lems in estimating variance components and predicting ge-netic values, when there are many levels of fixed effects (Morenoet al., 1997; Varonaet al., 1999; and Luoet al., 2002). In a situation like this, the authors recommend as-suming these effects as random. However, in order to reach convergence, it is also necessary to have a larger amount of data at each level (Varonaet al., 1999). Therefore, the ef-fects of contemporary groups were assumed as being ran-dom, and the sex and age of the cow at calving as fixed effects for genetic analyses of visual scores categorical traits.
In the threshold model, it is assumed that the underly-ing scale presents normal continuous distribution, this be-ing represented as follows:
U| ~q N W I( q s, e)
2
in which U is the vector of the base-scale of order r, q’ = (b’,a’,p’,c’) is the vector of the location parameters of order s withb(defined, from the frequentist view, as fixed effects), and order s witha,pandc(as direct additive ge-netic random effects and non-correlated to permanent ma-ternal environmental and contemporary groups),Wis the known incidence matrix of orderrfor s,Iis the identity ma-trix of orderrforr; andse
2
is the residual variance. Given that the liability variate is unobservable, parameterization se2
1
= is usually adopted in order to achieve identifiability in likely. Such an assumption is standard in threshold model analysis. The conditional probability thatyifalls into
categoryj(j= 1, 2, 3, 4, 5, 6), given the vectorsb,a,p,cand
t(t=tmin,t1, ...,tj-1,tmax) is given by:
Pr( | , , , , ) Pr( | , , , , )
(
y j a p c t t U t a p c t
t X
i j j
j
= = < < =
- ¢
-b 1 b
F i i i i
j i i i i
z a z p z c
t X z a z p z c p y
b b ¢ ¢ ¢ -- ¢ -- ¢ -- ¢ -- ¢ = -) ( ) (
F 1 i| , , , , )b a p c t
Categorical traits are determined by unobservable continuous variables, in underlying scale, this having fixed threshold initial values, in whicht1<t2...<tj-1, witht0= -¥
andtj=¥, wherejis the number of categories. Observable
data are dependent on the underlying variable which is lim-ited between two unobservable thresholds (Gianola and Foulley, 1983). Therefore, the categories or scores of yi
(morphological traits) for each animaliare defined byUiin
the underlying scale:
y
t U t
t U t
t U t
t U t
t U t
t i i i i i i = < < < < < < < < < < 1 2 3 4 5 6 0 1 1 2 2 3 3 4 4 5
5 < < 6 =1
ì í ï ï ï î ï ï ï
Ui t i ,...n
in whichnis the number of observations. After specifying the thresholdst0tot6, it is necessary that one of the
thresh-olds (fromt1tot5) be adjusted to an arbitrary constant. In
the genetic analyses for morphological traits evaluated at the yearling stage, it was assumedt1= 0, in such a way that
the vector of estimable thresholds was defined as:
t t t t t = é ë ê ê ê ê ù û ú ú ú ú 2 3 4 5
For the two-trait analyses of visual scores evaluated at weaning, another parameterization was adopted (Van Tas-sellet al., 1998), the residual variance, as well as the resid-ual covariance being estimable among the traits, and as-suming thatt1= 0 andt2= 1, in such a way that the vector of
estimable thresholds was defined as:
t t t t = é ë ê ê ê ù û ú ú ú 3 4 5
For the two-trait analyses between categorical and continuous ones, according to the Bayesian approach, it was admitted that the initial distribution of genetic random effects, both non-correlated and residual, follows multi-variate normal distribution as below:
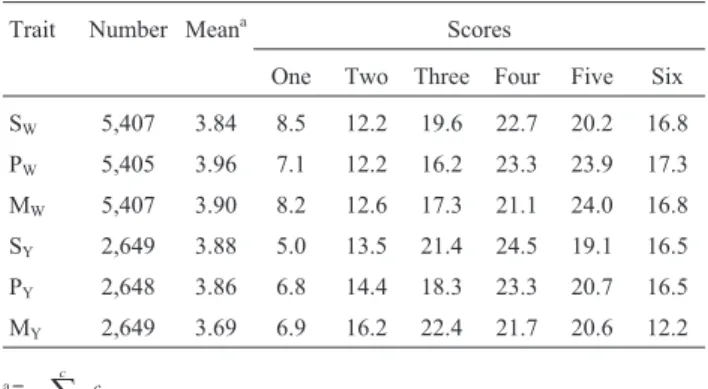
Table 1- Distribution (%) of scores for the traits body structure (S), pre-cocity (P) and musculature (M) evaluated by means of MES methodology at weaning (W) and the yearling stage(Y).
Trait Number Meana Scores
One Two Three Four Five Six
SW 5,407 3.84 8.5 12.2 19.6 22.7 20.2 16.8
PW 5,405 3.96 7.1 12.2 16.2 23.3 23.9 17.3
MW 5,407 3.90 8.2 12.6 17.3 21.1 24.0 16.8
SY 2,649 3.88 5.0 13.5 21.4 24.5 19.1 16.5
PY 2,648 3.86 6.8 14.4 18.3 23.3 20.7 16.5
MY 2,649 3.69 6.9 16.2 22.4 21.7 20.6 12.2
a
p a
a G N G G A p N
1
2
0
0
0 0
é ë ê ù
û ú æ
è ç ç
ö
ø ÷
÷ æéëê ùûú = Ä è
çç ö
ø ÷÷
~ , ~ ( ,Isp)
2
c N I p e
e R N R R I
c
~ ( ,0 ) ~ 0 ,
0
2 1
2
0
s æ
è
çç öø÷÷ æéëê ùûú = Ä è
çç ö
ø ÷÷
in whichG0is the matrix of genetic variances and
cova-riances,R0is the matrix of residual variances,Äis the
di-rect product operator,Ais the parentage matrix andIis the identity matrix.
Initial distribution of (co)variances was assumed as Inverted Wishart for genetic random effects, and non-cor-related and residual in the traits studied, this including mu-tual covariance. Uniform initial distribution was defined as much for fixed as well as for threshold effects. Parameterv
is the degree of freedom corresponding to Inverted Wishart distribution, and indicates the degree of initial distribution trustworthiness. In this study, the value of the parameterv
used was zero, that is, it reflected no degree of knowledge about parameters.
A 1,000,000 total cycle sampler chain, a 300,000 cy-cle burn-in and a 1,000 cycy-cle thinning interval to obtain 700 initial samples, were used implementation of Gibbs Sam-pling. Thereafter, the analysis continued, each time 100,000 cycles being added until estimates obtained in the last analysis were equal to the previous one. This criterion was adopted in order to verify whether convergence had re-ally been achieved. Sample analysis, serial correlation and convergence of the Gibbs chain were undertaken with sup-port from the GIBANAL (Van Kaam, 1998) program.
The Monte Carlo error was estimated by calculating the variance in samples of genetic parameters of traits and dividing this variance by the number of samples (Van Tassellet al., 1998). Thus, the square root of this value is an approximation of the standard deviation of the Monte Carlo error associated to Gibbs chain length.
The solutions of genetic values obtained for each ani-mal were transformed into a probability scale through the SAS PROBNORM (SAS, 2004) function, which resulted in EPDs (expected progeny differences) expressed as a per-centage (%). The PROC CORR procedure from SAS (SAS, 2004) software was applied to verify rank or Spearman rank-order correlations.
Results and Discussion
Descriptive statistics of variance components and ge-netic parameters of morphological traits, evaluated by MES methodology at weaning, are presented in Table 1. It was noted that heritability estimates found for body structure (S), precocity (P) and musculature (M) were high, thus, it is expected that these traits should respond positively to direct selection.
The estimates of heritability for S (0.68), P (0.65) and M (0.62) indicate high genetic variability for visual scores,
which is explained by the differences in biotypes or mor-phological types existent in Nellore cattle. It is important to point out that the application of MES methodology to mor-phological evaluation is novel, and thus selection for the vi-sual scores S, P and M is also relatively recent in Brazil.
A similar result for P heritability was encountered by Koury Filho (2005), in which the estimate was 0.63. Ac-cording to the author, estimated heritability for both P and M was higher than that obtained for body weight and conse-quently, the expected responses for directing the selection of such traits might be superior to those for body weight.
It is important to emphasize that the maternal additive genetic random effect of visual scores evaluated at weaning was not included in the model due to the difficulty in attain-ing Gibbs chain convergence, when applyattain-ing threshold models to an animal model. Other authors (Eleret al., 1996; Jorge Júnioret al., 2004) reported low estimates for herita-bility coefficients calculated for the maternal genetic effect, when considering the traits conformation (C), precocity (P) and musculature (M) in Nellore beef-cattle. According to Forniet al.(2007), no significant changes are expected in visual scores derived from the maternal genetic effect when selecting. Thus, non inclusion of the maternal additive ge-netic effect did not interfere in the results of the estimates herein presented.
Nevertheless, models which do not take maternal ef-fects into consideration may lead to higher estimates of di-rect additive genetic variance, and consequently, higher estimates of heritability (Meyer, 1992). This fact could ex-plain high heritability in S, P and M. Thus, the non-correla-ted permanent maternal environmental effect was included in the model on purpose, so as to avoid this possible overes-timation of direct additive genetic variance, as around 80% of the cows had more than one calf with visual scores data, this permitting the inclusion of this effect in analyses.
Furthermore from Table 2, it can be seen that the pro-portion of permanent maternal environmental random ef-fect was less than 3%, as indication of its low variance. The contrary was presented by Forniet al.(2007), when evalu-ating data from visual scores on in Nellore beef-cattle. They found that the proportion of this same effect on pheno-typical variance of these traits of 14%. According to the lat-ter heritability estimates were 0.12 for C, 0.15 for P and 0.12 for M, when considering linear models on estimating genetic parameters.
ef-fect that visual scores, evaluated in yearlings, respond to di-rect selection.
Regarding the application of Bayesian threshold models, it can be seen from in Tables 2 and 3 that the mean, mode and median of the estimates of genetic parameters were similar for all of the morphological traits evaluated at both weaning and the yearling stage. Such results indicate that Gibbs chain convergence was accomplished, there be-ing posterior marginal distribution of (co)variances compo-nents tending to normal distribution. It is important to note
that symmetry in estimating central tendency measure-ments is indicative of sampling chain convergence, as well as accurate analysis (Silvaet al., 2005). However, it is not necessary for estimates of central tendency measurements of (co)variance components to be similar, as Inverted Wis-hart distribution of posterior marginal densities of (co)vari-ances components is expected (Sorensenet al., 1995; and Van Tassellet al., 1998).
The Monte Carlo error represents a mistake in param-eter estimation due to the number of samples used in the Gibbs chain (Sorensen et al., 1995). According to Van Tassell and Van Vleck (1996), the Monte Carlo error is in-versely proportional to the Gibbs chain-length, knowledge of which being extremely important for evaluating whether the implementation of Gibbs Sampling was adequate or not to generate the posterior means of (co)variance components marginal distribution. It was verified from Tables 2 and 3 that the Monte Carlo error was too small for all of variance components and genetic parameters, thus indicating that the Gibbs chain-length was sufficient to obtain accurate es-timates of posterior means. The Monte Carlo error is con-sidered small when its value, added to the mean estimate of heritability coefficient posterior distribution, does not alter the value of this estimate, when rounded to the second deci-mal place of heritability. Therefore, it may be inferred that application of the Bayesian threshold model was efficient enough to obtain estimates of genetic parameters for cate-gorical morphological traits.
From Table 3, it can be observed that the genetic cor-relations between weight at 120 days and visual scores were 0.94 for S, 0.62 for P and 0.72 for M. Generally, it is expected that direct selection from visual scores leads to a positive correlated response to standard 120-day weight. Nonetheless, the important point to note is that at the year-ling stage the estimate of genetic correlation for S was the highest, as was expected, since the body structure (S) trait is related to animal-size, wich leads one to infer that the two traits (body structure and weight) are significantly influ-enced by the same gene groups. The same did not occur with M, in wherein the estimate of genetic correlation was 0.72, thus even lower than P (0.62), also as expected, since the P trait is set on a relationship between rib depth and limb height and thus a lower association to weight (W120) than S. These results also place in evidence that MES methodol-ogy of visual evaluation was efficient in defining body structure, precocity and musculature, thereby accurately identifying the specifications of each trait.
Nevertheless, as observed, the estimates of genetic correlations between the standard weight at 120 days (W120) and visual scores evaluated at weaning were high for all morphological traits (Table 2). Based on these re-sults, one may infer that at weaning the morphological traits of S, P and M may not be appropriately expressed geneti-cally, and mutual differences not entirely placed in evi-dence. However, the inclusion of visual scores as selection
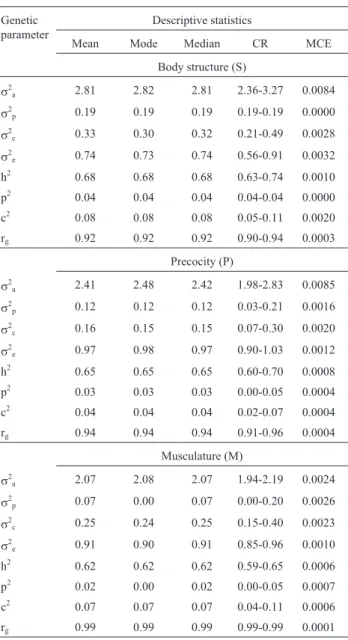
Table 2- Estimates of genetic parameters for the traits body structure (S), precocity (P) and musculature (M) evaluated by MES methodology at weaning, and obtained through Bayesian two-trait analyses with a thresh-old animal model.
Genetic parameter
Descriptive statistics
Mean Mode Median CR MCE
Body structure (S)
s2
a 2.81 2.82 2.81 2.36-3.27 0.0084
s2
p 0.19 0.19 0.19 0.19-0.19 0.0000
s2
c 0.33 0.30 0.32 0.21-0.49 0.0028
s2
e 0.74 0.73 0.74 0.56-0.91 0.0032
h2 0.68 0.68 0.68 0.63-0.74 0.0010
p2 0.04 0.04 0.04 0.04-0.04 0.0000
c2 0.08 0.08 0.08 0.05-0.11 0.0020
rg 0.92 0.92 0.92 0.90-0.94 0.0003
Precocity (P)
s2
a 2.41 2.48 2.42 1.98-2.83 0.0085
s2
p 0.12 0.12 0.12 0.03-0.21 0.0016
s2
c 0.16 0.15 0.15 0.07-0.30 0.0020
s2
e 0.97 0.98 0.97 0.90-1.03 0.0012
h2 0.65 0.65 0.65 0.60-0.70 0.0008
p2 0.03 0.03 0.03 0.00-0.05 0.0004
c2 0.04 0.04 0.04 0.02-0.07 0.0004
rg 0.94 0.94 0.94 0.91-0.96 0.0004
Musculature (M)
s2
a 2.07 2.08 2.07 1.94-2.19 0.0024
s2
p 0.07 0.00 0.07 0.00-0.20 0.0026
s2
c 0.25 0.24 0.25 0.15-0.40 0.0023
s2
e 0.91 0.90 0.91 0.85-0.96 0.0010
h2 0.62 0.62 0.62 0.59-0.65 0.0006
p2 0.02 0.00 0.02 0.00-0.05 0.0007
c2 0.07 0.07 0.07 0.04-0.11 0.0006
rg 0.99 0.99 0.99 0.99-0.99 0.0001
s2
aadditive genetic variance;s2pmaternal permanent environmental vari-ance;s2ccontemporary group variance;s
2
eresidual variance; h 2
criteria is necessary, at least in two phases of the animal’s life, at weaning and the yearling stage.
Fariaet al.(2008a) came to the same conclusions, in Nellore beef-cattle, evaluated for musculature (M), body structure (S) and conformation (C). The authors concluded that, although morphological traits evaluated at weaning presented high heritability estimates, they might possibly not be well defined at this age, and mutual genetic differ-ences might be better detected at a later age. Koury Filho (2005) considers a single-moment decision as premature for evaluating the animals, for if evaluation at weaning is very interesting through not involving pre-selection, at the yearling stage, morphological traits better express the di-rect individual genetic potentiality.
In Table 4, descriptive statistics of EPDs (expected progeny differences) for morphological traits evaluated with MES methodology at weaning and the yearling stage in of Nellore beef-cattle appear. It is noticeable that EPDs are important tools for aiding the breeder when taking deci-sions concerning the selective process in a herd. In Table 4, it can be seen that the means of EPD estimates for all the traits evaluated are below 50%, which indicates little or no selection of such traits in the Nellore herds evaluated. Un-der such conditions, and taking into account the high heri-tability estimates in S. P and M, it is possible to infer that there is a quick response to direct selection for such traits. It
was also verified (Table 4) that genetic variability is similar for all visual score traits (see maximum and minimum val-ues). Similar results were found by Faria et al.(2008b), although the morphological traits evaluated were muscula-ture (M), physical strucmuscula-ture (S) and conformation (C), when considering the application of threshold models to field data in Nellore cattle.
Rank or rather Spearman rank-order correlations of EPDs (expected progeny differences) in morphological traits evaluated through MES methodology at weaning and the yearling stage, are presented in Table 5. It can be seen that traits evaluated at weaning were higher (above 90%) when compared to those among yearlings. Therefore, it
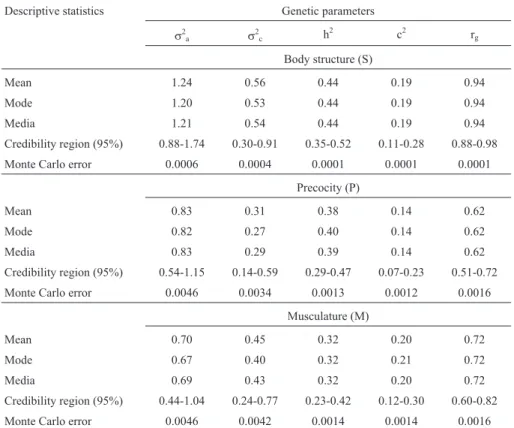
Table 3- Estimates of genetic parameters for the traits body structure (S), precocity (P) and musculature (M) evaluated by MES methodology at the year-ling stage, and obtained through Bayesian two-trait analyses with a threshold animal model.
Descriptive statistics Genetic parameters
s2
a s2c h
2
c2 rg
Body structure (S)
Mean 1.24 0.56 0.44 0.19 0.94
Mode 1.20 0.53 0.44 0.19 0.94
Media 1.21 0.54 0.44 0.19 0.94
Credibility region (95%) 0.88-1.74 0.30-0.91 0.35-0.52 0.11-0.28 0.88-0.98
Monte Carlo error 0.0006 0.0004 0.0001 0.0001 0.0001
Precocity (P)
Mean 0.83 0.31 0.38 0.14 0.62
Mode 0.82 0.27 0.40 0.14 0.62
Media 0.83 0.29 0.39 0.14 0.62
Credibility region (95%) 0.54-1.15 0.14-0.59 0.29-0.47 0.07-0.23 0.51-0.72
Monte Carlo error 0.0046 0.0034 0.0013 0.0012 0.0016
Musculature (M)
Mean 0.70 0.45 0.32 0.20 0.72
Mode 0.67 0.40 0.32 0.21 0.72
Media 0.69 0.43 0.32 0.20 0.72
Credibility region (95%) 0.44-1.04 0.24-0.77 0.23-0.42 0.12-0.30 0.60-0.82
Monte Carlo error 0.0046 0.0042 0.0014 0.0014 0.0016
s2
aadditive genetic variance;s 2
ccontemporary group variance; h 2
heritability; c2proportion of phenotypic variance due to contemporary group; rge ge-netic correlations between the weight at 120 days and visual scores.
Table 4- Descriptive statistics of EPDs (expected progeny differences) for the traits body structure (S), precocity (P) and musculature (M), evalu-ated by MES methodology, at weaning (W) and the yearling stage (Y).
Trait Mean Mode Minimum Maximum
SW 49.1 12.1 25.0 75.0
PW 48.8 11.5 25.0 75.0
MW 49.7 11.1 25.0 75.0
SY 49.4 8.6 25.0 74.8
PY 46.0 6.7 25.4 73.5
might be inferred that genetic differences among the visual scores are more in evidence when evaluated at the yearling stage.
Rank correlations among visual scores evaluated at different ages were 0.78 for S, 0.61 for P and 0.66 for M. These results show that classification or ranking of the ani-mals changed when a certain morphological trait was eval-uated at different ages (weaning and yearling). It was noted that for S, the higher rank correlation (0.78) reflects the in-tense genetic association of this trait with body weight, and that, no matter the age at visual evaluation, genetic expres-sion become evident. The same was not the case with P and M, in which genetic differences were better presented at the yearling stage.
In conclusion, visual scores from the Morphological Evaluation System, evaluated at weaning and the yearling stage, could be used in composing new selection indexes, as they presented sufficient genetic variability to promote genetic progress in such morphological traits.
Acknowledgments
We are grateful to the National Association of Bre-eders and Researchers (Associação Nacional de Criadores e Pesquisadores - ANCP) and the company Brasilcomz Zoo-tecnia Tropical for providing both data and technical-scientific support.
References
Eler JP, Ferraz JBS and Silva PR (1996) Parâmetros genéticos para peso, avaliação visual e circunferência escrotal na raça Nelore, estimados por modelo animal. Arq Bras Med Vet Zootec 48:203-213 (Abstract in English).
Faria CU, Magnabosco CU, Albuquerque LG, Reyes AL, Bezerra LAF and Lôbo RB (2008a) Análise genética para escores de avaliação visual com modelos bayesianos de limiar e linear. Pesq Agropec Bras 43:835-841 (Abstract in English). Faria CU, Magnabosco CU, Albuquerque LG, Reyes AL, Bezerra
LAF and Lôbo RB (2008b) Estimativas de correlações gené-ticas entre escores visuais e caracterísgené-ticas de crescimento em bovinos da raça Nelore utilizando modelos bayesianos linear-limiar. Cienc Anim Bras 9:327-340 (Abstract in Eng-lish).
Forni S, Federici JF and Albuquerque LG (2007) Tendências genéticas para escores visuais de conformação, precocidade e musculatura a desmama de bovinos Nelore. Rev Bras Zootec 36:572-577 (Abstract in English).
Gianola D and Foulley JL (1983) Sire evaluation for ordered cate-gorical data with a threshold model. Genet Sel Evol 15:201-224.
Jorge Júnior J, Dias LT and Albuquerque LG (2004) Fatores de correção de escores visuais de conformação, precocidade e musculatura, à desmama, para idade da vaca ao parto, data Juliana de nascimento e idade à desmama em bovinos da raça Nelore. Rev Bras Zootec 33:2044-2053 (Abstract in English).
Kippert CJ, Rorato PRN and Campos LT (2006) Efeito de fatores ambientais sobre escores de avaliação visual a desmama e estimativa de parâmetros genéticos, para bezerros da raça Charolês. Cienc Rural 36:579-585 (Abstract in English). Koury Filho W (2005) Escores Visuais e suas Relações com
Características de Crescimento em Bovinos de Corte. Uni-versidade Estadual Paulista, Jaboticabal, 80 pp.
Lôbo RB, Bezerra LAF, Faria CU, Magnabosco CU, Albuquer-que LG, Bergmann JAG, Sainz RD and Oliveira HN (2008) Avaliação Genética de Touros e Matrizes da Raça Nelore. ANCP, Ribeirão Preto, 124 pp.
Luo MF, Boettcher PJ and Schaeffer LR (2002) Estimation of ge-netic parameters of calving ease in first and second parities of Canadian Holsteins using Bayesian methods. Livest Prod Sci 74:175-184.
Marcondes CR, Paneto JCC, Silva JAV, Oliveira HN and Lôbo RB (2005) Comparação entre análises para permanência no rebanho de vacas Nelore utilizando modelo linear e modelo de limiar. Arq Bras Med Vet Zootec 57:234-240 (Abstract in English).
Meyer K (1992) Variance components due to direct and maternal effects for growth traits of Australian beef cattle. Livest Prod Sci 31:179-204.
Moreno C, Sorensen D and Garcia-Cortés LA (1997) On biased inferences about variance components in the binary thresh-old model. Genet Sel Evol 29:145-160.
SAS Institute Inc (2004) SAS OnlineDoc® 9.1.3. SAS Institute Inc., Cary.
Silva JAV, Dias LT and Albuquerque LG (2005) Estudo genético da precocidade sexual de novilhas em um rebanho Nelore. Rev Bras Zootec 34:1568-1572 (Abstract in English). Sorensen DA, Andersen S and Gianola D (1995) Bayesian
infer-ence in threshold models using Gibbs sampling. Genet Sel Evol 27:229-249.
Souza WH, Pereira CS, Bergmann JAG and Silva FLR (2000) Estimativas de componentes de variância e de parâmetros genéticos para características de reprodução por intermédio de modelos lineares e de limiar. Rev Bras Zootec 29:2237-2247 (Abstract in English).
Van Tassell CP and Van Vleck, LD (1996) Multiple-trait Gibbs sampler for animal models: Flexible programs for Bayesian and likelihood-based (co)variance component inference. J Anim Sci 74:2586-2597.
Van Tassell CP, Van Vleck LD and Gregory KE (1998) Bayesian analysis of twinning and ovulation rates using a multiple-trait threshold model and Gibbs sampling. J Anim Sci 76:2048-2061.
Table 5- Rank correlation among the EPDs (expected progeny differ-ences) of morphological traits evaluated by the MES methodology at weaning (W) and the yearling stage (Y).
SW PW MW SY PY MY
SW 1 0.92 0.99 0.78 0.57 0.67
PW 1 0.92 0.77 0.61 0.68
MW 1 0.81 0.55 0.66
SY 1 0.61 0.74
PY 1 0.87
Van Kaam JBCHM (1998) Gibanal 2.9: Analyzing Program for Markov Chain Monte Carlo Sequences. Dep. Anim. Sci., Wageningen Agricultural University, Wageningen, The Netherlands.
Varona L, Miztal I and Bertrand JK (1999) Threshold-linear ver-suslinear-linear analysis of birth weight and calving ease
us-ing an animal model: I. Variance Component Estimation. J Anim Sci 77:1994-2002.
Associate Editor: Pedro Franklin Barbosa