Genetic parameters, phenotypic, genotypic and environmental correlations and genetic
variability on sunflower in the Brazilian Savannah
Parâmetros genéticos, correlações fenotípicas, genotípicas e ambientais e variabilidade genética em girassol no Cerrado
Ellen Grippi Lira1 Renato Fernando Amabile2 Marcelo Fagioli1 Ana Paula Leite Montalvão3 ISSNe 1678-4596
INTRODUCTION
Sunflower (Helianthus annuus L.) is an
annual crop that stands out for its production of
high quality oil. The breeding of sunflower in Brazil aims to search for early materials (OLIVEIRA et al.,
2005), short stature, high productivity and resistance
to abiotic and biotic stress in order to use sunflower as a second crop. Researches about sunflower have allowed the expansion of its cultivation to places with different climatic conditions, including the Brazilian Savannah.
1Faculdade de Agronomia e Medicina Veterinária (FAV), Universidade de Brasília (UnB), Brasília, DF, Brasil.
2Empresa Brasileira de Pesquisa Agropecuária, Embrapa Cerrados, 73010-970, Planaltina, DF, Brasil. E-mail: renato.amabile@embrapa.br. Corresponding author.
3Faculty of Agricultural Sciences, University of Göttingen, Göttingen, Lower Saxony, Germany.
ABSTRACT: Sunflower (Helianthus annuus L.) is an annual crop that stands out for its production of high quality oil and for an efficient
selection, being necessary to estimate the components of genetic and phenotypic variance. This study aimed to estimate genetic parameters, phenotypic, genotypic and environmental correlations and genetic variability on sunflower in the Brazilian Savannah, evaluating the characters grain yield (YIELD), days to start flowering (DFL) based on flowering date in R5, chapter length (CL), weight of a thousand achenes (WTA), plant height (H) and oil content (OilC) of 16 sunflower genotypes. The experiment was conducted at Embrapa Cerrados, Planaltina, DF, situated at 15º 35’ 30”S latitude, 47º 42’ 30”W longitude and 1.007m above sea level, in soil classified as dystroferric Oxisol. The experimental design used was a complete randomized block with four replicates. The nature for the effects of genotypes and blocks was fixed. Except for the character chapter length, genetic variance was the main component of the phenotypic variance among the genotypes, indicating high genetic variability and experimental efficiency with proper environmental control. In absolute terms, the genetic correlations were superior to phenotypic and environmental. The high values reported for heritability and selective accuracy indicated efficiency of phenotypic selection. Results showed high genetic variability among genotypes, which may contribute to the genetic improvement of sunflower.
Key words: genetic diversity, genetic resources, genotypic correlations, Helianthus annuus L.
RESUMO: Girassol (Helianthus annus L.) é uma cultura anual que se destaca por sua produção de óleo de alta qualidade e para uma seleção
eficiente, é necessário estimar os componentes de variância genética e fenotípica. Este trabalho teve por fim estimar parâmetros genéticos, correlações fenotípicas, genotípicas e ambientais e variabilidade genética em girassol no Cerrado, avaliando os caracteres rendimento (REND), dias para a floração (DFI) com base na data de florescimento em R5, tamanho do capítulo (TC), peso de mil aquênios (PMA), altura da planta (ALT) e teor de óleo (ÓLEO), em 16 genótipos de girassol no bioma Cerrado. O experimento foi realizado na área experimental da Embrapa Cerrados, em Planaltina, DF, situada a 15º 35’ 30” de latitude Sul, 47º 42’ 30” de longitude Oeste e a altitude de 1.007m acima do nível do mar, em solo classificado como Latossolo Vermelho distrófico. O delineamento experimental utilizado foi de blocos ao acaso com quatro repetições. A natureza para os efeitos de genótipos e blocos foi fixa. Com exceção do caráter tamanho de capítulo, a variância genética foi o principal componente da variância fenotípica entre os genótipos, evidenciando alta variabilidade genética e eficiência experimental, com controle correto do ambiente. Em valores absolutos, as correlações genotípicas foram superiores às fenotípicas e ambientais. Os altos valores encontrados para herdabilidade e acurácia seletiva indicam eficiência da seleção fenotípica. Os resultados evidenciam alta variabilidade genética entre os genótipos, o que pode contribuir para o melhoramento genético de girassol.
Palavras-chave: diversidade genética, recursos genéticos, correlações genéticas, Helianthus annuus L.
To assist the conduct of studies in breeding programs there are important tools to quantify
the variability and extent to which the characters
are inherited. Therefore, it is used the estimation
of genetic parameters, which generate high value knowledge for research.
Correlations are used to help in selection,
especially when there is a character of interest that has low heritability or is difficult to measure. According to SANTOS & VENCOVSKY (1986), correlations are also useful for simultaneous selection efficiency.
For an efficient selection, it is need to
estimate the components of genetic and phenotypic
variance, because through the relationship between
the variances, it is possible to estimate the accuracy and heritability. Such estimates contribute to the effectiveness of the inferences of average genotypic
from phenotypic (RESENDE & DUARTE, 2007).
Heritability and accuracy are important for the planning of studies and trials in breeding
programs as they allow getting information about characters, especially for those most influenced by
the environment. Thus, it is possible to search for
effective selection (CRUZ et al., 2004).
The search for more adapted genotypes and
the knowledge from genetic data must be constant in
order to assist the development of research. Studies on the genetic variability generate important data for breeding programs, serving as a basis for development and selection of better materials.
Estimates of genetic and statistical parameters regarding the sunflower crop reflect
high value of information for the species breeding research. This study aimed to obtain information
about sunflower genotypes in the Brazilian Savannah,
by estimating genetic, phenotypic and environmental parameters related to production elements and agro morphological characters.
MATERIALS AND METHODS
The experiment was conducted in the Brazilian Savannah of Federal District, at Embrapa Cerrados – Brazilian Agricultural Research
Corporation, located at 15º 35’ 30”S latitude, 47º 42’ 30”W longitude and 1,007m above sea level, in soil
classified as dystroferric Oxisol. Soil analyzes were
conducted and the results indicated 1.18mmolc dm-3 of Al; 23.7mmolc dm
-3 of Ca; 7.8mmol c dm
-3 of Mg;
39.87mg dm-3 of P; 7.7mmol c dm
-3 of K; 33,87g dm-3 of O.M.; and a pH(water) of 5.76.
During the experiment, meteorological data was collected from the Embrapa Cerrados
Weather Station: minimum, average and maximum air temperature of 8.4ºC, 20.74ºC and 30.8ºC,
respectively; average air humidity of 73.22%; and a
summation of 479.7mm of rain during the test period. The test started in February 2014 and
sixteen genotypes, which took into consideration the Evaluation Trials Network of Sunflower Genotypes, coordinated by Embrapa Soja, were evaluated: CF 101, ADV 5504, BRS G42, M734, HELIO 250, SYN 3950HO, BRS 323, MG 360, GNZ NEON, HLA 2012, MG 305, HELIO 251, AGUARA 06, AGUARA 04 PARAISO 20 and SYN 045. The M734 genotype was indicated to compose the experiment
as a control, since this genotype throughout the years has been considered the most stable and adapted from
the network Brazilian trials. A complete randomized block design with four replications was used. The nature for the effects of genotypes and blocks was fixed. Plots contained four rows of five meters long, spaced 0.8m between rows. The useful area of the plot was 8 m² and the density corresponded to 33 plants
m-2. According to the results from the soil analysis, it was applied 400kg ha-1 of 4-30-16 fertilizer as the
base and 60kg ha-1 N as topdressing.
Crop residues were incorporated into the soil by a plow disc of 32”. Later it was used a harrowing 20’’. In pre-emergence state it was applied the Trifluralin herbicide
(a-trifluoro-2,6-dinitro-N,N-dipropyl-p-toluidine) in 1.2L ha-1 dosage.
Grain yield (YIELD) in kg ha-1, days to start flowering (DFL) based on the date of flowering in R5, chapter length (CL) in cm, weight of a thousand achenes (WTA) in g, height (H) in cm, and oil content (OilC) in % were evaluated. For determining the oil content, it was used nuclear
magnetic resonance. Samples corresponded to approximately 200 achenes, placed in accessory
combined with the spherical module of NIR equipment (Model Antaris II, Thermo Scientific).
The data was submitted to analysis of variance through the Genes software (CRUZ, 1997), according to the statistical model Yij = m + Gi + Bj
+ eij being Yij = observed value on the characteristic
of the i-th genotype in j-th block, m = overall mean, Gi = effect of i-th genotype (i = 1, 2,..., g), Bj = effect of the j-th block (j = 1, 2,..., r), eij = random error (unmeasured factors), eij ~ NID (0, s²).
Through the genes program (CRUZ, 1997) were obtained, for each of the analyzed characteristics, estimates of genotypic variance between the genotypes ( ˆ2
g
s ), environmental variance (ˆ2
e
s ) and phenotypic
variance ( 2
ˆf
s ), average heritability ( 2
a
of genetic variation (CVg) and experimental variation (CVe), coefficient of relative variation (CVr) and selective accuracy (
rˆ
gˆg), where: genotypic variance - sˆg2= (QMg - QMe)/r; environmental variance - sˆe2= QMe/r; phenotypic variance between the treatment
means -
s
ˆ
2f= QMg/r; Heritability -h
a2 (%) = (2
ˆg
s
/(QMg/r)) 100; genetic variation coefficient - CVg = )/mc where mc= average of thecharacter; Coefficient of experimental variation - CVe (%) = ( )/mc where mc = average
character; Coefficient of relative variation - CVr
2 2 ˆ ˆ ó óg =
; Selective Accuracy -rˆgˆg = 1−1/F, where
F = QMg/QMe
The determination of estimates of variance and covariance phenotypic, genotypic
and environment between the characters in pairs allows to continue the evaluations by obtaining the
genotypic, phenotypic and environment correlations,
according to KEMPTHORNE (1966), using the equations: Genotypic coefficient of correlation - rg
=
Côv
g(
X
,
Y
)
/ ; Phenotypiccorrelation coefficient - rf =
Côv
f(
X
,
Y
)
/Environmental correlation coefficient - re = Côve(X,Y)/
where:
Côv
g(
X
,
Y
)
,Côv
f(
X
,
Y
)
e Côve(X,Y)= estimators of genotypic, phenotypic and environmental covariance, respectively, between two characters X and Y,
ˆ
2(
X
)
g
s
,s
ˆ
2f(
X
)
and= Estimators for genotypic, phenotypic
and environmental variance, respectively, of character
X, and
s
ˆ
g2(
Y
)
,ˆ
(
)
2
Y
fs
, and = Estimatorsgenotypic, phenotypic and environmental variance,
respectively, of the character Y. Genes software was used (CRUZ, 1997).
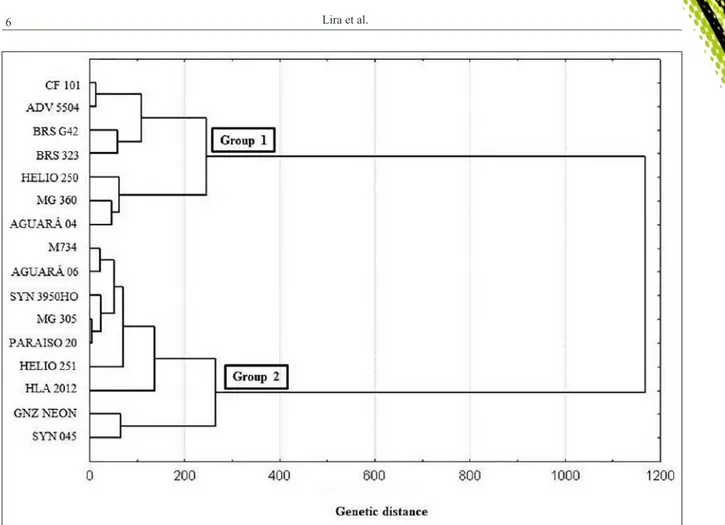
A dendrogram was generated. The dendrogram allowed cluster analysis. For this, it was used the method of UPGMA (unweighted
pair-group method arithmetic average), using as a
basis the matrix of genetic distances (SNEATH & SOKAL, 1973).
The dendrogram was divided into groups.
The division corresponds to stop of the clustering algorithm based on the average genetic distance
between genotypes. Using the computer program
Numerical Taxonomy and Multivariate Analysis System – NTSYS (Exeter Software version 2.1, 2000) (ROHLF, 2000), the coefficient of cophenetic correlation (r) between the original genetic distances
and those represented by the dendrogram among the
genotype pairs was calculated according to SOKAL & ROHLF (1962).
RESULTS AND DISCUSSION
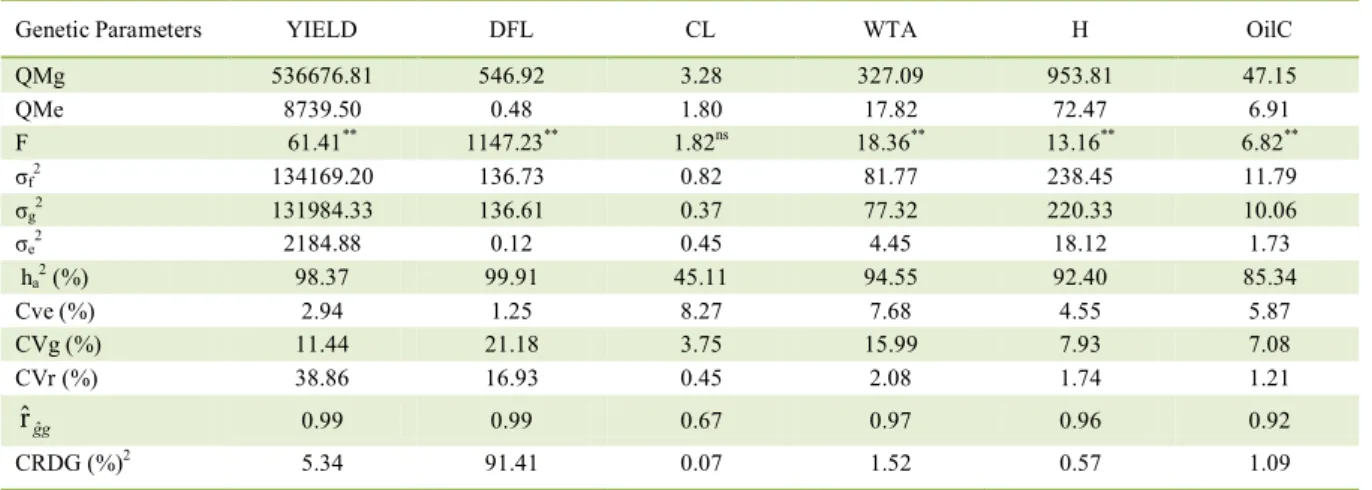
The variance analysis showed the significant effect of the genotypes. Except for CL, all variables were significant at 1% probability by the F test (P≤0.01). RESENDE & DUARTE (2007)
considered that the value of F in genotypic evaluation
tests should be greater than 2.0, compatible with that reported in this study, showing accuracy.
The experimental quality can be shown
from the interpretation of data such as environmental
variation coefficients. Following the criteria proposed by PIMENTEL-GOMES (1990), the low values of the coefficients of environmental variation (CVe)
indicated high accuracy of the experiment.
Besides the CVe, other statistics should
be evaluated for inferences to be made about the experimental quality, as is the case of genetic variation and selective accuracy, crucial for effective interpretation of genotypic value from phenotypic
evaluations (RESENDE, 2002).
The genetic variance was the main
component of phenotypic variation among genotypes,
except for the CL (Table 1). For the others, the genetic variance is more than 85% of the phenotypic variance,
indicating high genetic variability and experimental
efficiency with environmentally correct control, confirming the effective planning and definition of study characteristics, such as size of the parcel and
number of repetitions.
For the variables YIELD, DFL, WTA, H and OilC, the coefficients of genetic variation exceeded the CVe, indicating favorable characters for improvement. In contrast to CL, the CVg value is lower than CVe, suggesting that phenotypic selection
for this character is not favorable. Consequently, the
CVr for YIELD DFL, WTA, H, and OilC is greater
than 1, indicating the possibility of success of these phenotypic selections, since the genetic variance
(2002), good inference of genotypic value from phenotypic, contributing with useful information for
selection and consequent genetic gain.
Another important parameter is the heritability, which was greater than 90% for YIELD, DFL, WTA and H. For OilC, the value was 85.34% and for CL, 45.11%. High heritability estimates
contributed to the success of the selection, since they indicated the possibility that such characteristics
are inherited. SILVA et al. (2011) observed values of 85% and 80% for heritability of DEM (days from emergence to maturity) and H (height in cm), respectively, consistent with the findings in this study, showing high possibility of selection for these characteristics. AMORIM et al. (2007) observed heritability of 87.90% for plant height and 94% for days to flowering. For CL, as in this research SILVA et al. (2011) reported low heritability (23%),
indicating that this characteristic is easily altered by
the environment. KHAN et al. (2007) obtained 51% of heritability for CL 86% for WTA and 98% for OilC. REHMAN et al. (2012) reported 13.1%, 95.2% and 51% for CL, DFL and OilC, respectively.
The high heritability reported in this study
points towards the high efficiency of phenotypic
selection for the studied characters. Considering the results by statistical parameters, one can also say that
there was proper control of environmental factors, allowing the expression of genotypic variability.
With reference to the relative importance of characters for morph agronomic divergence of
sunflower access, studied in this research, according to SINGH (1981), the features that influence the most were days to start flowering (DFL), and grain yield (YIELD), totaling 91.41% and 5.34% of the total variance, respectively. At the other extreme, it was reported that the CL (0.07%) and H (0.57%) were those that contributed the least (Table 1).
The genotypic correlations in absolute
values were higher than the phenotypic and environmental correlations (Table 2). Due to this fact, it can be said that the phenotype reflects the genotype, since genetic factors contributed more when compared to the environment factors. Phenotypic and genotypic coefficients with the same sign indicated the absence
of errors in sampling and evaluation, according to
CRUZ et al. (2004).
For the pairing of characters YIELD and DFL, YIELD and CL, YIELD and WTA, YIELD and OilC, DFL and WTA, DFL and OilC, CL and WTA, CL and H, WTA and H and H and OilC it was observed different signs between genotypic and environmental correlations, which may mean that the environment
has favored a feature over another.
Table 1 - Chart with genotype mean square (QMg) and mean square error (QMe), F value and estimates of phenotypic variances average
level (σf2), genotypic (σg2) and environmental (σe2), the average heritability ( 2
a h
), the coefficients of experimental variation
(CVe) and genetic (CVg), the coefficient of relative variation (CVr) and selective accuracy (rˆgˆg) of each character evaluated in
16 sunflower genotypes. Embrapa Cerrados, Planaltina, DF, Brazil, 2014.
Genetic Parameters YIELD DFL CL WTA H OilC
QMg 536676.81 546.92 3.28 327.09 953.81 47.15
QMe 8739.50 0.48 1.80 17.82 72.47 6.91 F 61.41** 1147.23** 1.82ns 18.36** 13.16** 6.82**
σf2 134169.20 136.73 0.82 81.77 238.45 11.79
σg2 131984.33 136.61 0.37 77.32 220.33 10.06
σe2 2184.88 0.12 0.45 4.45 18.12 1.73
ha2(%) 98.37 99.91 45.11 94.55 92.40 85.34
Cve (%) 2.94 1.25 8.27 7.68 4.55 5.87
CVg (%) 11.44 21.18 3.75 15.99 7.93 7.08
CVr (%) 38.86 16.93 0.45 2.08 1.74 1.21
g gˆ
rˆ 0.99 0.99 0.67 0.97 0.96 0.92
CRDG (%)2 5.34 91.41 0.07 1.52 0.57 1.09
1Grain yield (YIELD), Days to start flowering (DFL), Chapter length (CL), Weight of a thousand achenes (WTA), Plant height (H), Oil
content (OilC). 2Relative contribution to the Genetic Diversity using the method of SINGH (1981).**Significant at 1% of probability by the
The pairing of DFL and H had the greatest genotypic (0.9362) and phenotypic (0.8996)
correlation, determining that one characteristic
influences the other in the same direction. The same happened with the pair YIELD and H, which had the second greatest genotypic (0.5497) and phenotypic (0.5324) correlations. For both pairs,
environmental correlation had the same sign of genotypic and phenotypic correlations, indicating that the environment does not affect the variables. Therefore, it is possible to make indirect selection.
It is possible to predict that cultivars with higher plants will have late flowering, which is not interesting from the point of view of research about sunflower, which seeks genotypes with lower cycle, focusing on the use as a second crop. According to these results, one can also say that cultivars with higher plants will have higher production. SILVA et al. (2011) observed positive correlations for stature and yield, height and days of flowering to maturity (DFM) and height and days from emergence to maturity (DEM). REHMAN et al. (2012) reported
genotypic and phenotypic correlations of 0.754 and
0.698, in this order, for DFL and H.
The value of the dendrogram cophenetic
correlation coefficient was 0.74, which is
considered as good magnitude, being higher than
0.70, indicated by ROHLF (2000). This result
enabled inferences through visual analysis of the
dendrogram (Figure 1) indicating consistency of adjustment between the graphical representation of
genetic distances and the initial matrix.
Two large groups were reported by cluster analysis, with a cut-off point set to the average of 270. Knowledge of the distances between genotypes can
be useful for breeding programs.
CONCLUSION
The evaluated characteristics for sunflower in the Brazilian Savannah achieved significant genetic effects. The genetic variance was the main component
of phenotypic variation among genotypes, except for the CL. The selection is favored for the characteristics evaluated, as indicated by the high values of genetic
variation coefficient, heritability and selective accuracy. The phenotype reflects the genotype once the genotypic correlations, in absolute values, were higher
than the phenotypic and environmental correlations. It is possible to make indirect selection
about the pairing DFL (Days to start flowering) and H (Plant height), which was the pair that had the greatest genotypic and phenotypic correlations. Two large groups were reported by cluster analysis and
there is high genetic variability among genotypes,
with potential use in breeding programs.
Table 2 - Estimates of genotypic, phenotypic and environmental correlation coefficients among the characters YIELD (grain yield), DFL
(days to start flowering), CL (chapter length), WTA (weight of a thousand achenes), H (plant height) and OilC(oil content) at 16 sunflower genotypes. Embrapa Cerrados, Planaltina, DF, Brazil, 2014.
Characters Correlations DFL CL WTA H OilC
rg 0.4227 0.5593 -0.0484 0.5497 -0.2090
YIELD rf 0.4190 0.3651 -0.0427 0.5324* -0.1833
re -0.0385 -0.0790 0.1349 0.2360 0.1668
rg 0.6126 0.1151 0.9362 -0.3268
DFL rf 0.4141 0.1114 0.8996** -0.2992
re 0.1308 -0.0732 0.0048 0.2237
rg -0.0593 0.6961 -0.0419
CL rf -0.0224 0.4469 -0.0521
re 0.0940 -0.0124 -0.0921
rg -0.0681 -0.2073
WTA rf -0.0528 -0.1910
re 0.1688 -0.0527
rg -0.5109
H rf -0.4500
re 0.0346
ACKNOWLEDGEMENTS
The authors thank Universidade de Brasília (UnB), Empresa Brasileira de Pesquisa Agropecuária - EMBRAPA Cerrados and EMBRAPA Soja, for their support. They also thank
Coordenação de Aperfeiçoamento de Pessoal de Nível Superior (CAPES), responsible for Ellen Grippi Lira’s scholarship. REFERENCES
AMORIM, E.P. et al. Genetic diversity in genotypes of sunflower. Ciência e Agrotecnologia, v.31, p.1637-1644,
2007. Available from: <http://www.scielo.br/pdf/cagro/v31n6/
a06v31n6.pdf>. Accessed: Nov. 12, 2015.
CRUZ, C.D. et al. Biometric templates applied to breeding.
3.ed. Viçosa, MG: UFV, 2004. 480p.
CRUZ, C.D. Program Genes: computer application in genetics
and statistics. Windows – 2007. Viçosa: UFV, 1997. 442p. KHAN, H. et al. Genetic analysis of yield and some yield components in sunflower. Sarhad Journal of Agriculture, v.23, p.985-990, 2007.
KEMPTHORNE, O. An introduction to genetic statistics. New
York: John Wiley & Sons, 1966. 545p.
OLIVEIRA, M.F. et al. Sunflower Improvement. In: LEITE, R.M.V.B.
et al. Girassol no Brasil. Londrina: Embrapa Soja, 2005. p.269-297.
PIMENTEL-GOMES, F. Experimental statistics course. 13.ed.
Piracicaba: Nobel, 1990. 468p.
REHMAN, R. et al. Using multivariate analysis for selecting desirable hybrids in sunflower (Helianthus annuus L.). Pakistan
Journal of Botany, v.44, p.1715-1720, 2012. Available from: <https://www.pakbs.org/pjbot/PDFs/44(5)/34.pdf>. Accessed:
Nov. 12, 2015.
RESENDE, M.D.V. de. Biometric and statistical genetics
in breeding perennials. Brasília, DF: Embrapa Informação Tecnológica, 2002. 975p.
RESENDE, M.D.V. de; DUARTE, J.B. Precision and quality
control cultivars evaluation experiments. Tropical Agricultural Research, v.37, p.182-194, 2007.
ROHLF, F.J. NTSYS-pc: numerical taxonomy and multivariate
analysis system, version 2.1. New York: Exeter Software, 2000. 98p. Figure 1 - Cluster analysis of 16 sunflower genotypes using six characters. The method of UPGMA was used as grouping criteria. The value
SANTOS, J.; VENCOVSKY, R. Phenotypic correlation between genetic and some agronomic traits of common bean (Phaseolus vulgaris L.). Ciência e Prática, v.10, p.265-272, 1986.
SILVA, J.A.G. et al. Estimativas de herdabilidade e correlações
para caracteres agronômicos em girassol. Revista Brasileira de Agrociência, v.17, p.51-59, 2011.
SINGH, D. The relative importance of characters affecting genetic
divergence. Indian Journal of Genetics and Plant Breeding, v.41, p.237-245, 1981.
SNEATH, P.H.A.; SOKAL, R.R. Numerical taxonomy: the
principles and practice of numerical classification. San Francisco:
W.H. Freeman, 1973. 573p.
SOKAL, R.R.; ROHLF, F.J. The comparison of dendrograms by objective methods. Taxonomy, v.11, p.30-40, 1962. 359p.