Received July 2, 2009 and accepted may 6, 2010. Corresponding author: [email protected]
Genetic analysis of visual scores and their relationships to mature female
weight in Nellore breed
Inaê Cristina Regatieri1, Arione Augusti Boligon2, Lucia Galvão de Albuquerque3
1Graduação em Zootecnia, FCAV/UNESP - Jaboticabal, SP. Bolsista FAPESP.
2Doutoranda em Genética e Melhoramento Animal, FCAV/UNESP - Jaboticabal, SP. Bolsista FAPESP. 3Departamento de Zootecnia, FCAV/UNESP - Jaboticabal, SP. Bolsista do CNPq e do INCT-CA.
ABSTRACT - Data from 79,884 Nellore breed animals were used to estimate genetic parameters and to evaluate the relationships among scores of conformation, precocity and musculature obtained at weaning and after yearling ages and weight of mature females. It was used the restricted maximum likelihood method in a multi-trait analysis with the model that included direct additive genetic and residual effects, as random effects, and the fixed effects of contemporary group and, as covariables, animal age at weighing and age of dam at calving (except for weight of females at adult age). Contemporary groups at weaning were defined by the variables: sex, herd, year and month of birth, and management group at birth and weaning. For definition of contemporary group at yearling, it was also included the variable management group at yearling. For female weight at mature age, contemporary group was composed of herd, year of birth, management group at yearling, weighing year and season. Maternal genetic and maternal permanent environment effects were also included in the model for analyses of scores of conformation, precocity and muscularity at weaning. The direct herdability estimates obtained were the following: 0.18 ± 0.02 for conformation at weaning score, 0.21 ± 0.01 for precocity at weaning score, 0.22 ± 0.01 for muscularity at weaning score, 0.24 ± 0.01 for conformation at yearling score, 0.27 ± 0.01 for precocity at yearling score, and 0.26 ± 0.01 for muscularity score at yearling and 0.42 ± 0.02 for mature female weight. Genetic correlations estimated among visual scores measured at weaning and after yearling were positive, ranging from intermediate to high magnitude (0.56 ± 0.03 to 0.85 ± 0.01). On the other hand, genetic correlations estimated between visual scores and mature female weight were positive and intermediate, ranging from 0.21 ± 0.03 to 0.35 ± 0.03. The results obtained indicate that selection of animals with higher visual scores, mainly at yearling age, may promote an increase on mature female weight.
Key Words: beef cattle, conformation, genetic correlation, musculature, precocity
Análise genética de escores visuais e suas relações com o peso de fêmeas
à idade adulta na raça Nelore
RESUMO - Dados de 79.884 animais da raça Nelore foram utilizados para estimar parâmetros genéticos e avaliar as relações entre os escores de conformação, precocidade e musculatura obtidos à desmama e ao sobreano e o peso das fêmeas à idade adulta. Utilizou-se o método da máxima verossimilhança restrita, em análise multicaracterísticas, com modelo que incluiu os efeitos genéticos aditivos direto e residual, como aleatórios, e os efeitos fixos de grupo de contemporâneos e, como covariáveis, a idade do animal à pesagem e a idade da mãe ao parto (exceto para o peso das fêmeas à idade adulta).Os grupos contemporâneos à desmama foram definidos pelas variáveis: sexo, rebanho, ano e mês de nascimento, grupo de manejo ao nascimento e à desmama.Na definição de grupo contemporâneo ao sobreano também foi incluída a variável grupo de manejo ao sobreano. Para o peso das fêmeas à idade adulta, o grupo de contemporâneos foi composto por rebanho, ano de nascimento, grupo de manejo ao sobreano, ano e estação da pesagem. Os efeitos genético materno e de ambiente permanente materno também foram incluídos no modelo para análise dos escores de conformação, precocidade e musculatura à desmama. As estimativas de herdabilidade direta obtidas foram 0,18 ± 0,02 para o escore de conformação; 0,21 ± 0,01 para o escore de precocidade; 0,22 ± 0,01 para o escore de musculatura à desmama e 0,24 ± 0,01 para o escore de conformação; 0,27 ± 0,01 para o escore de precocidade; e 0,26 ± 0,01 para o escore de musculatura ao sobreano e 0,42 ± 0,02 para o peso das fêmeas à idade adulta.As correlações genéticas estimadas entre os escores visuais medidos à desmama e ao sobreano foram positivas, variando de média a alta magnitude (0,56 ± 0,03 a 0,85 ± 0,01). Por outro lado, as correlações genéticas estimadas entre os escores visuais e o peso das fêmeas à idade adulta foram positivas e moderadas, variando de 0,21 ± 0,03 a 0,35 ± 0,03. Os resultados obtidos indicam que a seleção de animais com maiores escores visuais, principalmente ao sobreano, deve promover aumento do peso das fêmeas à idade adulta.
Palavras-chave: bovinos de corte, conformação, correlação genética, musculatura, precocidade
Introduction
Selection for higher weights has been increasing the mature weight of animals inasmuch as weights at different ages are genetically correlated (Boligon et al., 2009) causing, in some herds and in certain regions in the country, an imbalance between maintenance requirements of cows and availability of dry matter. Thus, according to Jorge Junior et al. (2001), this selection method has produced large and late animals, which take longer to come into reproduction and reach the size and finish desired, which are not in accordance with the breeding system to pasture often used in the country.
Animal weight is related to skeletal size and body shape with higher or lower fat content. Thus, in Brazil, it has been used different visual evaluation methods, as scores of conformation, finishing precocity and muscling for an indirect evaluation of traits related to carcass composition. According to Weber et al. (2009), conformation score estimate the amount of meat in the animal carcass, the muscle development, and the general harmony of the body; finishing precocity score estimate the ability for fat deposition, indicating the rate to reach the carcass finishing; and musculature score represents the degree of muscle development presented by the animal.
Some researches report that visual scores of conformation, finishing precocity and muscling presented moderate heritability and favorable genetic correlations with weights obtained at young ages and weight gains (Forni et al., 2007; Pedrosa et al., 2008; Koury Filho et al., 2010; Weber et al., 2009). However, there are few studies in literature that provide estimates of genetic correlations between visual scores and mature weight of the cow (Pedrosa et al., 2008). This information becomes increasingly important inasmuch as they permit to predict the impact that inclusion of visual scores in the selection indexes used in breeding programs in beef cattle can affect the size of adult cow.
This research was developed with the objective to estimate heritability and to study the correlations between weight of mature cow and visual scores of conformation, finishing precocity and muscling obtained at weaning (205 days of age) and at yearling (550 days of age) in order to determine the effect of including visual scores in the selection indexes on mature size of the cow.
Material and Methods
The information used in this study is from Nellore animals born between 1984 and 2006, of Jacarezinho
Agropecuaria Ltda, a farm located in Valparaiso, São Paulo. The main objectives of Agropecuaria Jacarezinho Ltda. are the sale of young breeding stock and animals for slaughter; for this purpose, the company relies on a herd consisting of 10,000 dams weaning about 8,000 calves per year.
In the genetic breeding program developed on the property, reproductive, growth, and finishing traits are used as selection criteria. The animals are weighed at birth, and at weaning (around 205 days of age), and at yearling (around 550 days of age) ages. Animals are visually evaluated both at weaning and yearling and receive a score ranging from one to five for conformation, finishing precocity, muscling, and navel. The scrotal circumference is measured at yearling.
The animals are selected based on indexes consisting of the traits that are evaluated in two periods, i.e., weaning and yearling. The selection index at weaning is composed of the following traits: days to reach 160 kg from birth to weaning, 60%; weaning conformation, 8%; weaning finishing precocity, 16%; and weaning muscling, 16%. The selection index at yearling is composed of the following traits: days to reach 160 kg from birth to weaning, 23%; weaning conformation, 4%; weaning finishing precocity, 8%; weaning muscling, 8%; days to reach 240 kg post-weaning, 23%; yearling conformation, 4%; yearling finishing precocity, 8%; yearling muscling, 8%; and scrotal circumference, 14%. In each selection period (i.e., weaning and yearling), 10% of females and 50% of males were discarded.
On the studied farm, the visual scores of conformation, finishing precocity and muscling were individually attributed for each animal, and the scores are regarded to the average of contemporary group, obtained by consensus among the three examiners. Score five represents the maximal expression of the trait (Figure 1). For the scores obtained at weaning, the contemporary group included animals of the same sex, herd, year and month of birth, and management group at birth and weaning. For visual scores obtained at yearling, the yearling management group was also included in the contemporary group.
The (co)variances components and the genetic parameters were estimated by restricted maximum likelihood using the computer program Wombat (Meyer, 2006), in multi-traits analysis including visual scores of conformation, finishing precocity and muscling at weaning and yearling
and mature weight of the cow. In the analysis, all traits were considered continuous inasmuch as Faria et al. (2008) showed no differences in heritability estimates and genetic correlations for conformation, finishing precocity and muscling using threshold or linear models.
Figure 1 - Number of observations for weaning and yearling visual scores of conformation, finishing precocity and muscling.
Trait Number of observations Number of cows Number of sires Contemporary group Relationship matrix
Conformation at weaning 79,884 30,782 410 1,214 96,940 Finishing precocity at weaning 79,884 30,782 410 1,214 96,940
Muscling at weaning 79,884 30,782 410 1,214 96,940
Conformation at yearling 53,866 24,328 404 1,751 96,940 Finishing precocity at yearling 53,866 24,328 404 1,751 96,940
Muscling at yearling 53,866 24,328 404 1,751 96,940
Mature weight 3,260 3,036 193 4 6 96,940
Table 1 - Data description of conformation, finishing precocity and muscling at weaning and yearling and mature weight defined as the first weight obtained from four years of age
0 10000 20000 30000 40000
1 2 3 4 5
Conformation score at weaning
0 10000 20000 30000 40000
1 2 3 4 5
Conformation score at yearling
0 10000 20000 30000 40000
1 2 3 4 5
Finishing precocity score at weaning
0 10000 20000 30000 40000
1 2 3 4 5
Finishing precocity score at yearling
0 10000 20000 30000 40000
1 2 3 4 5
Muscling score at weaning
0 10000 20000 30000 40000
1 2 3 4 5
Muscling score at yearling
Number
of
observations
Number
of
observations
Number
of
Direct additive genetic and residual effects were considered as random effects, and contemporary group was included in the model as a fixed effect. Linear and quadratic effects of the animal age at recording and age of dam at calving were included as covariables. For mature weight of the cow, it was not included the age of dam at calving as covariate in the model. For visual scores at weaning, it was also included maternal genetic and maternal permanent environment as random effects.
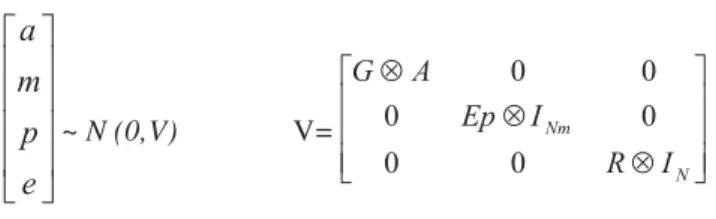
The matrix representation of the model is: y = Xβ + Z1a + Z2m + Z3p + e
in which: y = vector of observations; β = vector of fixed effects; a = vector of direct additive genetic effects; m = vector of maternal additive genetic effects; p = vector of maternal permanent environmental effects; and e = vector of residual effects associated with the observations. X, Z1, Z2 and Z3 are the incidence matrices related to β, a, m and p to y.
On the model, the following assumptions were made:
~ N (0,V) V=
in which: G = genetic (co)variance matrix, A = relationship matrix, Ep = maternal permanent environmental covariance matrix, R = residual covariance and I = identity matrix; Nm = the number of dams of animals with records; N =the number of animals with records, and ⊗ denotes the direct product. The G matrix can be described as:
G =
in which: Gd = direct additive genetic matrix; Gm =maternal genetic covariance matrix. The covariance between direct additive genetic and maternal genetic effects was set to zero.
Results and Discussion
The largest number of observations for female mature weight was obtained at five years of age, showing a decrease in the number of weighing with the increasing age of animals (Figure 2). Mature weight mean was 434.59 kg, which is close to those reported in the literature for Nellore cows (Pedrosa et al., 2008; Boligon et al., 2008).
The direct heritability estimates for visual scores measured at weaning were lower than those obtained at
yearling (Table 2). Overall, the results of this study suggest that the visual scores should respond to individual selection and, considering the same intensity of selection at both ages (weaning and yearling), the response to selection for yearling visual scores tends to be higher.
Weaning conformation score showed lower heritability estimate, so lower genetic gains should be expected when the selection is based on this trait. Using another sample of the same data set used in the present study, Koury Filho et al. (2010) also reported a lower heritability estimate for weaning conformation score (0.13) compared to other scores. Using information of Angus cattle, Cardoso et al. (2004) reported heritability for conformation, finishing precocity and muscling at weaning of 0.18, 0.19 and 0.19, respectively. For the visual scores at yearling, these authors estimated heritability lower than the present study for conformation (0.19), and similar values for finishing precocity (0.25) and muscling (0.26).
In Nellore cattle, Forni et al. (2007) estimated direct heritability lower than those obtained in the present study for visual scores of conformation, finishing precocity and muscling at weaning, with values of 0.12 ± 0.01, 0.15 ± 0.01 and 0.12 ± 0, 01, respectively. For Aberdeen Angus cattle, direct heritability of low magnitude was also described by Weber et al. (2009), i.e. 0.15 ± 0.01, 0.12 ± 0.01 and 0.12 ± 0.01 for conformation, finishing precocity and muscling at weaning, respectively.
In this study, for both ages evaluated (weaning and yearling), it was observed lower heritability estimate for conformation compared to finishing precocity and muscling scores (Table 2). According to Koury Filho et al. (2010), this result is probably due to the more subjective definition for conformation score, which does not identify a specific morphological type and confuses size and muscularity, allowing different interpretations by the evaluators.
Maternal heritability estimated by visual scores at weaning was of low magnitude (Table 2). For Nellore cattle, heritability estimates similar to the maternal effects were reported by Forni et al. (2007), i.e. 0.04 ± 0.01 (weaning conformation), 0.04 ± 0.01 (weaning finishing precocity) and 0.06 ± 0.01 (weaning muscling) and Koury Filho et al. (2010), with values of 0.05, 0.04 and 0.06 for conformation, finishing precocity and muscling at weaning, respectively. On the other hand, using scores of Aberdeen Angus cattle, Weber et al. (2009) reported higher maternal heritability for weaning conformation (0.17 ± 0.01), weaning finishing precocity (0.08 ± 0.01) and weaning muscling (0.10 ± 0.01). By the results obtained in the present study, no significant changes are expected for scores for conformation, finishing precocity and muscling resulting from selection for maternal genetic effect.
The direct heritability estimate for mature weight of the cow was high (0.42), suggesting the possibility of using this trait for evaluation and identification of biotypes compatible with the production system, because the direct selection for mature weight may cause changes in size of females and, consequently, in nutritional requirements. Studying different approaches for consideration on the mature weight in Nellore cow, Boligon et al. (2008) estimated heritability ranging from 0.30 to 0.36 using single weight record and 0.41 to 0.46 were considered as repeated measures. The authors suggested the inclusion of mature weight in economic selection indexes of herds designed to maintain the desired mature weight.
Using Nellore cattle data from different herds, Pedrosa et al. (2006) reported results similar to the ones from the present study, with heritability of 0.43 and 0.41 for weight of mature cow considering single and repeated weight measure, respectively. According to these authors, the use of single measure of weight as almost close as six years of age can produce a selected sample inasmuch as a proportion of cows have been usually discounted at this age. Thus, considering the importance that weight of mature cow
represents for productive performance of beef cattle herds, annual weight recordings of females entering into the breeding season are recommended by using all data available for the evaluation of mature weight.
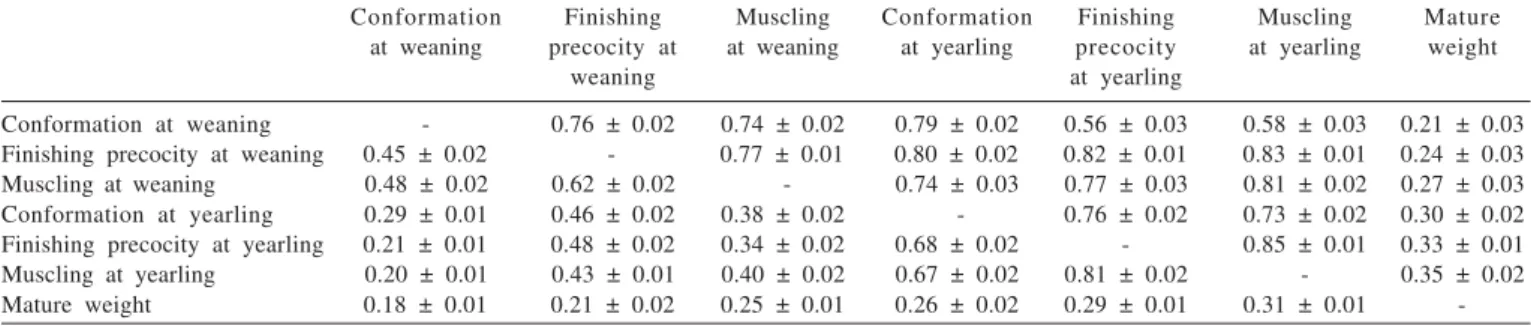
Although the present study used a single measure of mature weight, the estimates were obtained by multi-trait analysis, including data obtained at weaning, which should minimize the effects of pre-selection performed in the herd. The genetic correlations between the visual scores obtained at weaning and at yearling ranged from moderate to high magnitude (Table 3). In both ages (weaning and yearling), the traits finishing precocity and muscling showed the largest genetic associations (0.77 ± 0.01 and 0.85 ± 0.01), which was also reported by Koury Filho et al. (2010).
Cardoso et al. (2004) reported correlations among the visual scores higher than the ones obtained in this study, with values of 0.99 between conformation score at weaning and at yearling; 0.93 between finishing precocity score at these same ages and, 0.90 between muscling scores at weaning and at yearling. These authors concluded that the scores could be considered as the same trait in both phases of growth, and suggested the use of weaning scores in selection index for Angus beef cattle. On the other hand, Koury Filho et al. (2009) considered to be early to define a single time for evaluation using visual scores of Nellore animals inasmuch as the measure at weaning is very interesting because there is no pre-selection, and at yearling, morphological traits allow a better evaluation of the genetic potential of the individual, without much influence from maternal effects.
The genetic associations between visual scores and weight of mature cows were positive, ranging from 0.21 ± 0.03 to 0.35 ± 0.02 (Table 3). In general, these results suggest that animals with early muscle development and finishing and with better carcass conformation, especially when measured at yearling, tend to present a higher mature weight. However, the search for animals with balanced measures makes it possible to find genotypes that include high breeding
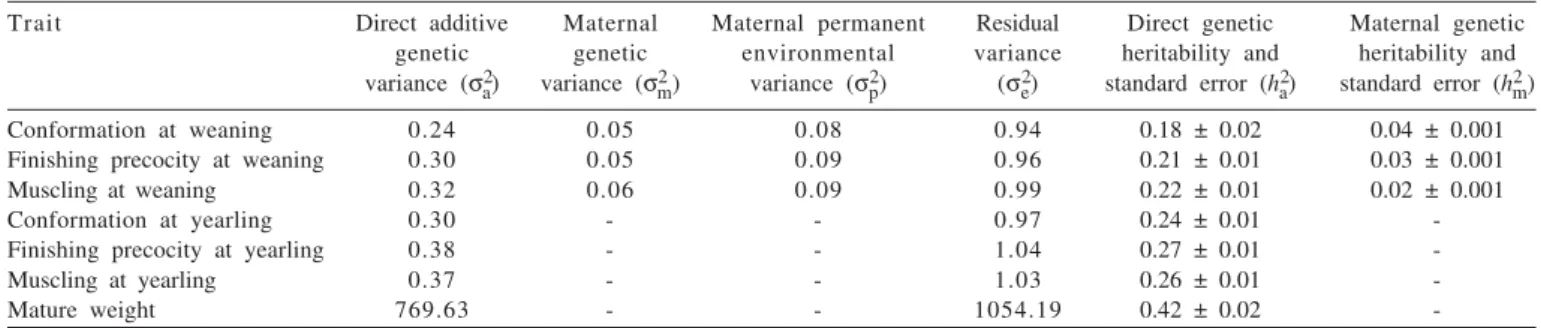
Trait Direct additive Maternal Maternal permanent Residual Direct genetic Maternal genetic genetic genetic environmental variance heritability and heritability and variance (σ2
a) variance (σm2) variance (σ2p) (σe2) standard error (ha2) standard error (hm2)
Conformation at weaning 0.24 0.05 0.08 0.94 0.18 ± 0.02 0.04 ± 0.001 Finishing precocity at weaning 0.30 0.05 0.09 0.96 0.21 ± 0.01 0.03 ± 0.001 Muscling at weaning 0.32 0.06 0.09 0.99 0.22 ± 0.01 0.02 ± 0.001 Conformation at yearling 0.30 - - 0.97 0.24 ± 0.01 -Finishing precocity at yearling 0.38 - - 1.04 0.27 ± 0.01
-Muscling at yearling 0.37 - - 1.03 0.26 ± 0.01
-Mature weight 769.63 - - 1054.19 0.42 ± 0.02
values for conformation, finishing precocity and muscling at weaning and at yearling combined with moderate mature weight.
By using information from Nellore animals, Pedrosa et al. (2008) reported genetic correlations higher than those obtained in the present study between weight of mature cow and yearling conformation, finishing precocity and muscling (0.68, 0.37 and 0.40, respectively).
In general, the results of this study indicate, in the long term, the possibility of an increase in weight of mature cow with the inclusion of visual scores measured at weaning and at yearling in selection indexes. Thus, for economical reasons, in herds that need to reduce or maintain constant the size of cows, the mature weight should also be included in selection indexes. Because of lack of information in the literature on genetic correlations between visual scores and mature weight, further studies using different data set and other approaches are recommended.
Conclusions
The visual scores of conformation, finishing precocity and muscling obtained mainly at yearling and mature weight should respond to individual selection. The selection considering one of the visual scores will probably imply in positive correlated responses in all others obtained at weaning or at yearling. However, the selection of animals with higher scores, especially at yearling, should promote increase in weight of mature cows.
References
BOLIGON, A.A.; ALBUQUERQUE, L.G.; MERCADANTE, M.E.Z. et al. Models for genetic evaluation of Nelore cattle mature
b o d y w e i g h t . J o u r n a l o f A n i m a l S c i e n c e, v. 8 9 , n . 11 , p . 2 0 4 0 - 2 0 4 4 , 2008.
BOLIGON, A.A.; ALBUQUERQUE, L.G.; MERCADANTE, M.E.Z. et al. Herdabilidades e correlações entre pesos do nascimento à idade adulta em rebanhos da raça Nelore. Revista Brasileira de Zootecnia, v.38, n.12, p.2320-2326, 2009.
C A R D O S O , F. F. ; C A R D E L L I N O , R . A . ; C A M P O S , L . T. C o m p o n e n t e s d e ( c o ) v a r i â n c i a e p a r â m e t r o s g e n é t i c o s d e caracteres pós-desmama em bovinos da raça Angus. Revista Brasileira de Zootecnia, v.33, n.2, p.313-319, 2004. FARIA, C.U.; MAGNABOSCO, C.U.; ALBUQUERQUE, L.G. et al.
Análise genética de escores de avaliação visual de bovinos com modelos bayesianos de limiar e linear. Pesquisa Agropecuária Brasileira, v.43, n.7, p.835-841, 2008.
FORNI, F.; FEDERICI, J.F.; ALBUQUERQUE, L.G. Tendências genéticas para escores visuais de conformação, precocidade e musculatura à desmama de bovinos Nelore. Revista Brasileira de Zootecnia, v.36, n.3, p.572-577, 2007.
JORGE JUNIOR, J.; PITA, F.V.C.; FRIES, L.A. et al. Influência de alguns fatores de ambiente sobre os escores de conformação, precocidade e musculatura à desmama em um rebanho da raça Nelore. Revista Brasileira de Zootecnia, v.30, p.1697-1703, 2 0 0 1 .
KOURY FILHO, W.; ALBUQUERQUE, L.G.; FORNI, S. et al. Estimativas de parâmetros genéticos para os escores visuais e suas associações com peso corporal em bovinos de corte. Revista Brasileira de Zootecnia, v.39, n.5, p.1015-1022, 2010. MEYER, K. “WOMBAT” - Digging deep for quantitative genetic
a n a l y s e s b y r e s t r i c t e d m a x i m u m l i k e l i h o o d . I n : W O R L D C O N G R E S S O N G E N E T I C A P P L I E D TO L I V E S TO C K P R O D U C T I O N , 8 . , 2 0 0 6 , B e l o H o r i z o n t e . A n a i s . . . Belo Horizonte: 2006. (CD-ROM).
PEDROSA, V.B.; ELER, J.P.; SILVA, V.J.A. et al. Heritability estimation for mature weight in Nellore cattle. In: WORLD C O N G R E S S O N G E N E T I C A P P L I E D TO L I V E S TO C K P R O D U C T I O N , 8 . , 2 0 0 6 , B e l o H o r i z o n t e . A n a i s . . . Belo Horizonte: 2006. (CD-ROM).
PEDROSA, V.B.; ELER, J.P.; SILVA, M.R. et al. Estimativas de parâmetros genéticos do peso adulto e de características de e s c o r e v i s u a l e m a n i m a i s d a r a ç a N e l o r e . I n : S I M P O S I O BRASILEIRO DE MELHORAMENTO ANIMAL, 7., 2008, São Carlos. Anais... São Carlos: 2008. (CD-ROM).
WEBER, T.; RORATO, P.R.N.; LOPES, J.S. et al. Parâmetros g e n é t i c o s e t e n d ê n c i a s g e n é t i c a s e f e n o t í p i c a s p a r a c a r a c t e r í s t i c a s p r o d u t i v a s e d e c o n f o r m a ç ã o n a f a s e p r é -desmama em uma população da raça Aberdeen Angus. Revista Brasileira de Zootecnia, v.38, n.5, p.832-842, 2009. Table 3 - Genetic (above the diagonal) and phenotypic (below the diagonal) correlations between studied traits obtained using
multi-trait analysis
Conformation Finishing Muscling Conformation Finishing Muscling Mature at weaning precocity at at weaning at yearling precocity at yearling weight
weaning at yearling