ABSTRACT
RESUMO
Submitted on 09/03/2015 and approved on 30/05/2017.
1 This paper was extract from the master’s thesis of the first author.
2 Universidade Federal do Rio Grande do Sul, Departamento de Horticultura e Silvicultura, Programa de Pós-Graduação em Fitotecnia, Porto Alegre, Rio Grande do Sul, Brazil. [email protected]
3 Instituto Federal do Rio Grande do Sul, Câmpus Ibirubá, Rio Grande do Sul, Brazil. [email protected]
4 Universidade Federal de Santa Maria, Centro de Ciências Rurais, Departamento de Fitotecnia, Santa Maria, Rio Grande do Sul, Brazil. [email protected]; [email protected] *Corresponding author: [email protected]
Growth, plastochron, and the final number of nodes
of China pink seedlings grown on different substrates
1The objective of this work was to plot the growth curves and determine the plastochron and the final number of nodes of China pink seedlings grown on different substrates. Thus, 392 China pink seedlings were grown on seven substrates under greenhouse conditions, in Santa Maria in the state of Rio Grande do Sul, Brazil. The growth curves were plotted using the logistic model. The plastochron was estimated by the inverse of the angular coefficient of the simple linear regression between the number of accumulated nodes and accumulated thermal sum from the subsampling of the seedlings. In all substrates, the logistic model fit better for the variable number of leaves than for the plant height. The plants in substrates with 50% of soil plus 50% of rice husk ash, and 80% of rice husk ash plus 20% earthworm humus had the longest cycles with 74 and 65 days, respectively. They completed the cycles with a thermal sum of 1317.9 ºC day for number of leaves and plant height. The growth curves that were plotted by the logistic model and the plastochron of the China pink seedlings are dependent on the type of substrate used. The commercial substrate Mecplant® had the best
results. The average final number of nodes of the main stem of the plants was 14 for all substrates.
Key words: Dianthus chinensis L.,logistic model; node emission; thermal sum.
Marília Milani2*, Juliano Dalcin Martins3, Sidinei José Lopes4, Nereu Augusto Streck4
10.1590/0034-737X201764040010
Crescimento, plastocrono e número final de nós de mudas de cravina de jardim cultivada
em diferentes substratos
O objetivo deste trabalho foi ajustar curvas de crescimento e determinar o plastocrono e o número final de nós de mudas de cravina de jardim, cultivadas em diferentes substratos. Um total de 392 plantas foram cultivadas em sete substratos em casa de vegetação, em Santa Maria, RS. As curvas de crescimento foram ajustadas ao modelo logístico, e o plastocrono foi estimado pelo inverso do coeficiente angular da regressão linear simples entre o número de nós acumulados e a soma térmica acumulada a partir da repicagem das mudas. O ajuste do modelo logístico foi melhor para a variável número de folhas que para altura de plantas, em todos os substratos. As plantas dos substratos 50% de solo + 50% de cinzas de casca de arroz; e 80% cinzas de casca de arroz + 20% húmus de minhoca tiveram os maiores ciclos de produção, 74 e 65 dias, respectivamente, e o completaram com soma térmica de 1317,9 ºC dia para número de folhas e altura de plantas. As curvas de crescimento ajustadas pelo modelo logístico e o plastocrono em cravina de jardim são dependentes do tipo de substrato utilizado, e o melhor é o comercial Mecplant®. O número final de nós na haste principal
é, em média, 14 nós planta-1, para todos os substratos.
INTRODUCTION
Dianthus chinensis L. (China pink) is a plant species that can be used in a garden, or the flowers can be cut for bouquets. China pink has an early and abundant flowering, with excellent performance in spring and autumn (Sakata Seed Sudamérica Ltda®, 2012), when there is less choice of
floriferous species intended for these uses. China pink seedlings are grown on substrates until the point of sale when the first flower bud opens, and then they are directed to commercial centers. The production of high-quality China pink seedlings is very important because their performance at this stage will determine the development of the crop to produce a suitable final product to create gardens.
Therefore, substrate formulations are evaluated according to the needs of the cultivated species to ensure the mechanical maintenance of the root system and plant stability. In addition, substrates must provide the liquid phase for water and nutrient supply and the gas phase for oxygen supply and transport of carbon dioxide to the roots (Silveira et al., 2002).
Modern agriculture aims to develop models that simulate plant growth to detect factors that may limit it and influence the productive potential of the species (Lopes et al., 2004). Non-linear models can help the researcher by presenting parameters of biological interpretation. Among these models are: Spillman, Mitscherlich, Logistic, Gompertz, Richards, and others (Regazzi, 2003). These models have been used to plot growth curves for some crops (Lopes et al., 2007; Vieira et al., 2008; Lyra et al., 2008); however, there are no studies of growth curves using non-linear models found in contemporary research on or-namental plants.
The development of plants can be characterized by the growth rate of leaves or nodes in the stem. The growth rate of leaves or nodes over time gives the number of accumulated leaves or nodes (NN), which are used to characterize the plant’s development, especially during the vegetative stages of the development cycle (Xue et al., 2004). The NN in a stem can be estimated by the time required for the emergence of two successive nodes. In dicotyledon plants, the interval between the emergence of two successive nodes on the same stem can be called plastochron (Streck et al., 2005). The final number of nodes (FNN) is another important development variable, since it is directly related to the duration of the crop cycle (Setiyono et al., 2007).
In this context, the objective of this work was to plot the growth curves and determine the plastochron and the final number of nodes of China pink seedlings grown on different substrates.
MATERIAL AND METHODS
The experiment was conducted from April 29th to July
29th, 2011, in a Van der Hoeven greenhouse from the Plant
Science department of the Federal University of Santa Maria (UFSM), State of Rio Grande do Sul, Brazil (29º43’S, 53º43’W and altitude of 95 m). The experiment was carried out with seven substrates without the addition of fertilizers. The treatments consisted of (v v-1): Substrate 1, 50% soil
and 50% rice husk ash; Substrate 2, 80% soil and 20% earthworm humus; Substrate 3, 80% rice husk ash and 20% earthworm humus; Substrate 4, 40% soil, 40% rice husk ash and 20% earthworm humus; Substrate 5, 100% peat; Substrate 6, 100% commercial substrate (Mecplant®);
Substrate 7, 50% peat and 50% rice husk ash.
A completely randomized experimental design was used with 7 treatments composed of 56 randomly chosen plants (replications), which is 392 evaluated plants total. The experimental units consisted of 8.0 cm long and 8.0 cm diameter black polyethylene plastic bags (volume of 402.12 cm3) with one plant each. Twenty-eight-day old Dianthus
chinensis L. (Dianthus F1 Diamond) seedlings were obtained from a specialized company, and they were subsampled into these containers with approximately three pairs of leaves and a height of 2.5 cm. Localized manual irrigation was performed daily, maintaining the substrate humidity close to the field capacity until the final evaluation of the experiment (point of sale: opening of the first floral bud on the main stem).
The physical and chemical properties of the substrates were evaluated in the Laboratory of Routine Analysis of the UFSM. The physical characteristics evaluated were density (g cm-3), total porosity (cm3 cm-3), aeration space
(cm3 cm-3), and available water (cm3 cm-3). The chemical
characteristics evaluated were hydrogen potential—pH; calcium—Ca (cmolc dm-3); magnesium—Mg (cmolc dm-3);
effective CEC (cmolc dm-3); organic matter—OM (m v-1);
phosphorus—P-Mehlich (mg dm-3) and potassium—K (mg
dm-3). The seedling shoot content of macronutrients was
determined in the Forest Ecology Laboratory of the UFSM, and the means of the three replications were compared by the Tukey and Kruskal-Wallis tests at a 5% probability of error when some assumption of variance analysis was not met.
base temperature (BT) of 3.9 °C (Blanchard & Runkle, 2011) (DTS = ADT – BT). The accumulated thermal sum (ATS, ºC day) of the subsamples up to the point of sale was calculated by the sum of the DTS values.
The number of leaves (NL) and nodes (NN) and plant height (PH) of the main stem of the plants were evaluated. The NL and NN were counted three times a week up to the end of the leaf emission period, with one-day intervals, and the PH was measured weekly.
Visible leaves were considered when the two apical leaves were separated by at least 1 cm, since the the leaves develop on opposite sides in the main stem (MS).
In the vegetative phase, the PH was measured from the base of the substrate to the last leaves of the MS, regardless of whether these leaves were considered visible. During the reproductive phase, PH was measured from the base of the substrate to the floral bud of the MS.
Logistic growth curves were fitted to the NL and PH data as described by Regazzi (2003), using the equation: y = α/{1 + exp(β - γx)}, wherein: y is the plant height (cm) or the number of leaves; x is the accumulated thermal sum (ATS, ºC day); α is the expected maximum plant height or number of leaves; β is the intercept; γ is the average growth rate; and exp is the basis of the neperian logarithms. The program Table Curve 2D (v. 2.03, Jandel Scientific) was used to estimate the model parameters by the Levemberg-Marquardt’s nonlinear least squares interactive procedure.
The criteria for fitting the models were the coefficient of determination (R2) and the mean absolute deviation of the
residue (MADr), using the equation:
, wherein: Yi is the observed result;
is the estimated result; and n is the sample size. The plastochron (°C day node-1) of plants in each
substrate was determined by the linear regression between accumulated NN in the MS and the ATS from the subsampling of the seedlings to the point of sale, while considering each plant as one replication. Plastochron was considered the inverse of the angular coefficient of the simple linear regression between NN and ATS. The final number of nodes (FNN) in the MS was counted after the flower bud emergence. The mean plastochron and FNN were compared by the Kruskal-Wallis’s test, at 5% of probability of error.
RESULTS AND DISCUSSION
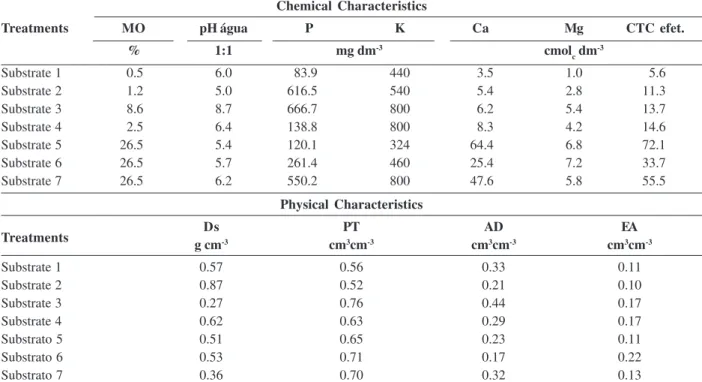
Substrates 3 and 7 presented sufficient density to ensure the stability of the containers, 0.27 and 0.36 g cm-3,
respectively (Table 1). The ideal density of substrates recommended for containers of up to 15 cm high is between 0.2 and 0.4 g cm-3 since cultivation in containers are more
difficult above this range. This is mainly due to the plant growth limitation, and the difficulty of transporting the
Table 1: Chemical and physical characteristics of the substrates used for growing the China pink. Santa Maria, State of Rio Grande
do Sul, Brazil, 2012
Chemical Characteristics
Treatments MO pH água P K Ca Mg CTC efet.
% 1:1 mg dm-3 cmol c dm
-3
Substrate 1 0.5 6.0 83.9 440 3.5 1.0 5.6
Substrate 2 1.2 5.0 616.5 540 5.4 2.8 11.3
Substrate 3 8.6 8.7 666.7 800 6.2 5.4 13.7
Substrate 4 2.5 6.4 138.8 800 8.3 4.2 14.6
Substrate 5 26.5 5.4 120.1 324 64.4 6.8 72.1
Substrate 6 26.5 5.7 261.4 460 25.4 7.2 33.7
Substrate 7 26.5 6.2 550.2 800 47.6 5.8 55.5
Physical Characteristics
Ds PT AD EA
g cm-3 cm3cm-3 cm3cm-3 cm3cm-3
Substrate 1 0.57 0.56 0.33 0.11
Substrate 2 0.87 0.52 0.21 0.10
Substrate 3 0.27 0.76 0.44 0.17
Substrate 4 0.62 0.63 0.29 0.17
Substrato 5 0.51 0.65 0.23 0.11
Substrato 6 0.53 0.71 0.17 0.22
Substrato 7 0.36 0.70 0.32 0.13
Substrate 1, 50% soil and 50% rice husk ash; Substrate 2, 80% soil and 20% earthworm humus; Substrate 3, 80% rice husk ash and 20% earthworm humus; Substrate 4, 40% soil, 40% rice husk ash and 20% earthworm humus; Substrate 5, 100% peat; Substrate 6, 100% commercial substrate (Mecplant®); Substrate 7, 50% peat and 50% rice husk ash.
containers (Kämpf, 2005). The other substrates did not present densities within the recommended ideal range.
The aeration space required for substrates vary according to the plant type. Reference values of 20 and 40% (0.20 and 0.40 m3 m-3) are described in the literature
(Kämpf, 2005), but not specifically for China pink. The recommended aeration space for Dianthus caryophyllus, which belongs to the same genus of China pink, is 2 to 5% (Kämpf, 2005). All substrates evaluated presented aeration space higher than this (Table 1). Substrate 1 had 50% of the aeration space of the Substrate 6, and was not sufficient to ensure a good shoot development. This possibly compromised the root system, resulting in smaller number of branches and foliar area, and consequently, less accumulated phytomass.
The ideal total porosity for vegetable substrates is 0.85 m3 m-3 (Verdonck & Gabriels, 1988). Plants grown in
containers with low substrate volume have a high concentration of roots, requiring a high oxygen supply and fast removal of carbon dioxide. Therefore, the substrate must have sufficient porosity for gas exchange to avoid hindering root respiration and the medium microbial activity (Kämpf, 2005). None of the substrates reached the ideal total porosity (Table 1), but the Substrate 3 was close to ideal (0.76 cm3 cm-3), according to Verdonck & Gabriels
(1988).
Regarding the chemical properties (Table 1), the pH results of the substrates 1, 4, 5, and 6 was within the
recommendations, according to their respective compositions. The recommended pH range for substrates with predominance of organic matter (OM) is 5.0 to 5.8 (Kämpf, 2005). The substrates 5, 6 and 7 (26.5% of OM) had the highest Ca and Mg contents. The organic matter usually changes the colloidal complex, creates surface charges, and consequently, increases the CEC, which favors the availability of nutrients to the plant (Bezerra et al., 2006).
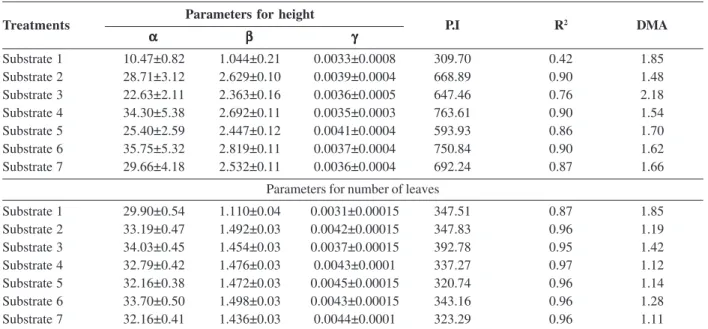
The growth curves for PH and NL of China pink differed depending on the substrate used, and fitted well to the logistic model (Table 2). This result validates the use of the model to determine growth curves of China pink in the different substrates, with the exception of PH in Substrate 1, which generated a low R2 (0.42) and had one of the
highest mean absolute deviation of the residue (MADr) (1,85) (Table 2). Growth curves should be used under growth potential conditions, i.e., without water, light, or nutrient restrictions. This was not the case for Substrate 1, since plants grown on it had the lowest shoot N, P, and Mg contents (Table 3).
The MADr for NL was lower than the PH in the logistic model fitted to plants of all substrates which denotes a better fit to the growth curve. The lower the MADr, the better the fit (Table 2).
Although the plant cycle of the treatments had a simi-lar total thermal sum, it differed regarding the inflection point (IP), i.e., the point of maximum accumulation rate of
Table 2: Estimated means and confidence interval of the parameters a, b and g, inflection point (IP) (ºC day), coefficient of determination (R2), and mean absolute deviation of the residues (MADr), using the logistic model adjusted for height and number of leaves of China pink as a function of the accumulated thermal sum in different substrates. Santa Maria, State of Rio Grande do Sul, Brazil, 2012
Parameters for height
α αα
αα βββββ γγγγγ
Substrate 1 10.47±0.82 1.044±0.21 0.0033±0.0008 309.70 0.42 1.85
Substrate 2 28.71±3.12 2.629±0.10 0.0039±0.0004 668.89 0.90 1.48
Substrate 3 22.63±2.11 2.363±0.16 0.0036±0.0005 647.46 0.76 2.18
Substrate 4 34.30±5.38 2.692±0.11 0.0035±0.0003 763.61 0.90 1.54
Substrate 5 25.40±2.59 2.447±0.12 0.0041±0.0004 593.93 0.86 1.70
Substrate 6 35.75±5.32 2.819±0.11 0.0037±0.0004 750.84 0.90 1.62
Substrate 7 29.66±4.18 2.532±0.11 0.0036±0.0004 692.24 0.87 1.66
Parameters for number of leaves
Substrate 1 29.90±0.54 1.110±0.04 0.0031±0.00015 347.51 0.87 1.85
Substrate 2 33.19±0.47 1.492±0.03 0.0042±0.00015 347.83 0.96 1.19
Substrate 3 34.03±0.45 1.454±0.03 0.0037±0.00015 392.78 0.95 1.42
Substrate 4 32.79±0.42 1.476±0.03 0.0043±0.0001 337.27 0.97 1.12
Substrate 5 32.16±0.38 1.472±0.03 0.0045±0.00015 320.74 0.96 1.14
Substrate 6 33.70±0.50 1.498±0.03 0.0043±0.00015 343.16 0.96 1.28
Substrate 7 32.16±0.41 1.436±0.03 0.0044±0.0001 323.29 0.96 1.11
Substrate 1, 50% soil and 50% rice husk ash; Substrate 2, 80% soil and 20% earthworm humus; Substrate 3, 80% rice husk ash and 20% earthworm humus; Substrate 4, 40% soil, 40% rice husk ash and 20% earthworm humus; Substrate 5, 100% peat; Substrate 6, 100% commercial substrate (Mecplant®); Substrate 7, 50% peat and 50% rice husk ash.
the growth. The maximum leaf accumulation rate was simi-lar in all substrates with an average of 344.65 °C day; however, the Substrate 1 had a much lower IP for PH than the others, which had average ATS of 686.16 °C day (Table 2).
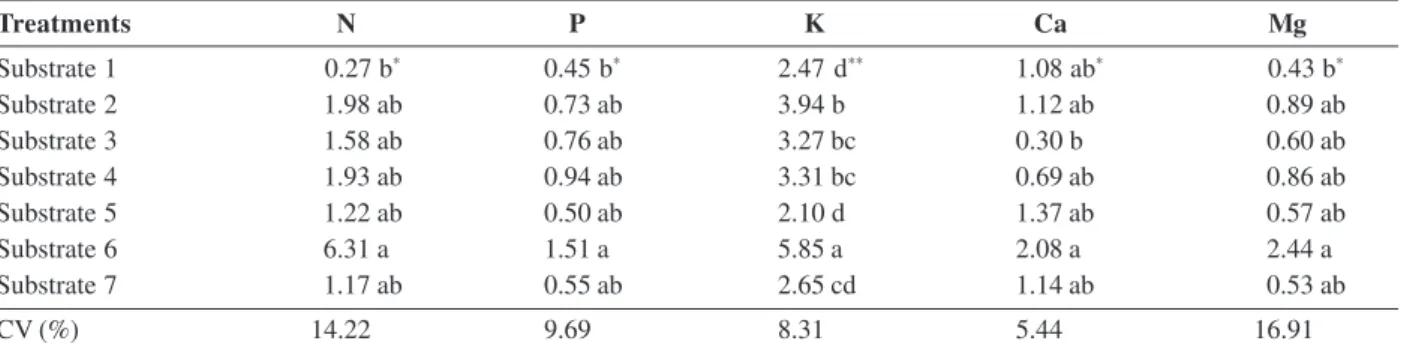
According to the confidence interval of the parameters of the model for PH, the substrates differed only in the parameter α, which represents the maximum height expected. The highest PH estimated by the logistic model was found in plants grown on the Substrate 6 (35.75 cm) followed by those in the Substrate 4 (34.30 cm). The lowest PH estimated was found in plants of the Substrate 1 (10.47 cm) (Table 2), which can be explained by their lower shoot N, P, and Mg contents (Table 3). Fagundes et al. (2007) also found effect of N rates on the final PH of sunflower grown in pots.
The estimation of the parameter α for NL (Table 2), i.e., the maximum number of leaves, had lower variation among the treatments, ranging from 29.90 in plants in the Substrate 1 to 34.03 in those in the Substrate 3. The lowest estimate average rate of leaf emission was found in plants in Substrate 1 (0.0031 leaves ºC day). Therefore, the NL per plant differed depending on the substrate, and the most fertile substrate favored leaf emission, confirming the result found by Gosek & Carvalho (2010).
The regression between NN and ATS of all substrates had R2 values above 0.97. Therefore, the development of
nodes in China pink is affected by air temperature which is also reported for other ornamental species, such as chrysanthemum (Streck, 2004), lily (Schuh et al., 2005), marigold (Koefender et al., 2008), and curlycup gumweed (Fagundes et al., 2008). Therefore, the linearity between NN and ATS indicates the estimation of plastochron by simple linear regression as an adequate methodology.
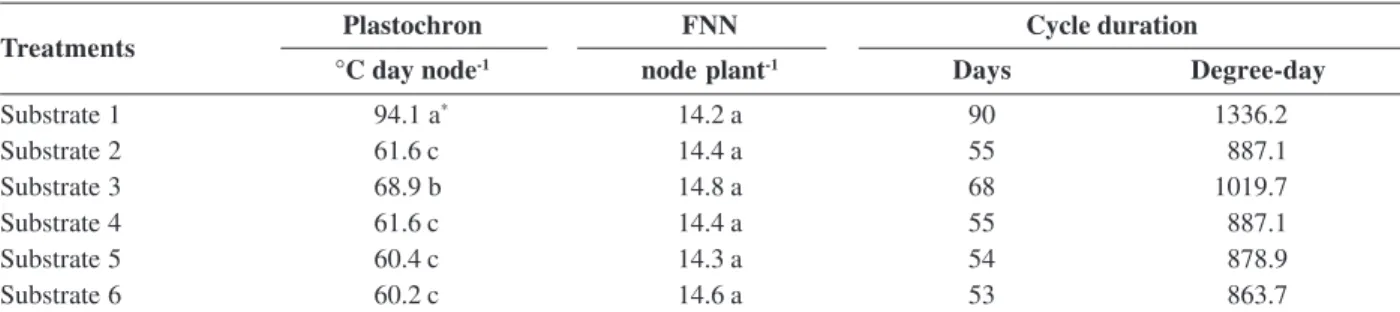
The plastochron of the treatments differed significantly, but the FNN did not, presenting, on average, 14 node plant
-1 (Table 4). The shortest plastochron was found in the plants
grown on Substrate 6 (60.2 ºC day node-1), which did not
differ from the substrates 2, 4, 5, and 7 (Table 4). This result indicates that the emission of nodes and leaves is faster in plants grown on these substrates; moreover, plants in these substrates had shorter cycles of approximately 54 days. The longest plastochron was found in plants grown on Substrate 1 (94.1 °C day node-1) followed by Substrate 3
(68.9 °C day node-1). The plants grown on these substrates
also had the longest cycles, with an average of 74 and 65 days, respectively (Table 4).
The longer cycle of plants grown on Substrate 1 can be attributed to the lower amount of P in this substrate (Table 1), resulting in less P accumulated in the shoots (Table 3). According to Malavolta (2006), plants under P deficiency have late flowering times. Castro et al. (2007) evaluated the effect of macronutrient deficiency on flower stems of heliconia and found longer cycles in plants with deficiency of P, N, and K. The longer cycle of plants grown on Substrate 3 can be explained by its pH (8.7) (Table 1), since these plants presented chlorotic leaves, a characteristic symptom of Fe deficiency in alkaline mediums. High pH, above 6.5, greatly reduces the availability of micronutrients to plants (Kämpf, 2005).
One of the causes of variation in plastochron is the mineral nutrition, especially nitrogen, since this nutrient increases the emission rate of new nodes (Toebe et al., 2010) and leaves (Fagundes et al., 2008). The greater speed of node emission on the main stem of plants in Substrate 6 can be explained by the greater N availability and confirmed by the highest N content of in the shoots of these plants (Table 3). Therefore, one of the causes of plastochron variations, considering the plants that had the longest (Substrates 1) and shortest (Substrate 6) plastochron, was the mineral availability, especially N in the substrate.
Table 3: Mean macronutrient content (g) in the shoot of China pink plants grown on different substrates. Santa Maria, State of Rio Grande do Sul, Brazil, 2012
Treatments N P K Ca Mg
Substrate 1 0.27 b* 0.45 b* 2.47 d** 1.08 ab* 0.43 b*
Substrate 2 1.98 ab 0.73 ab 3.94 b 1.12 ab 0.89 ab
Substrate 3 1.58 ab 0.76 ab 3.27 bc 0.30 b 0.60 ab
Substrate 4 1.93 ab 0.94 ab 3.31 bc 0.69 ab 0.86 ab
Substrate 5 1.22 ab 0.50 ab 2.10 d 1.37 ab 0.57 ab
Substrate 6 6.31 a 1.51 a 5.85 a 2.08 a 2.44 a
Substrate 7 1.17 ab 0.55 ab 2.65 cd 1.14 ab 0.53 ab
CV (%) 14.22 9.69 8.31 5.44 16.91
Substrate 1, 50% soil and 50% rice husk ash; Substrate 2, 80% soil and 20% earthworm humus; Substrate 3, 80% rice husk ash and 20% earthworm humus; Substrate 4, 40% soil, 40% rice husk ash and 20% earthworm humus; Substrate 5, 100% peat; Substrate 6, 100% commercial substrate (Mecplant®); Substrate 7, 50% peat and 50% rice husk ash.
CONCLUSIONS
The growth curves that were plotted by the logistic model and the plastochron of the China pink seedlings are dependent on the type of substrate used. The commercial substrate Mecplant® had the best results. The average
final number of nodes of the main stem of the plants was 14 for all substrates.
REFERENCES
Bezerra FB, Oliveira MACL, Perez DV, Andrade AG & Meneguelli NA (2006) Lodo de esgoto em revegetação de área degradada. Pesquisa Agropecuária Brasileira, 41:469-476.
Blanchard MG & Runkle ES (2011) Quantifying the thermal flowering rates of eighteen species of annual bedding plants. Scientia Horticulturae, 128:30-37.
Castro ACR, Loges V, Costa AS, Castro MFA, Aragão FAZ & Willadino LG (2007) Hastes florais de helicônia sob deficiência de macronutrientes Pesquisa Agropecuária Brasileira, 42:1299-1306. Fagundes JD, Santiago G, Mello AM, Bellé RB & Streck NA (2007) Crescimento, desenvolvimento e retardamento da senescência
foliar em girassol de vaso (Helianthus annuus L.): fontes de
doses de nitrogênio. Ciência Rural, 37:983-993.
Fagundes JG, Streck NA, Storck L, Reiniger LRS & Kruse ND (2008) Temperatura base, plastocrono e número final de nós no mal-me-quer do campo. Ciência Rural, 38:2471-2477. Gosek CF & Carvalho RIN (2010) Cultivo de ave-do-paraíso em
diferentes substratos. Scientia Agraria, 1:009-018.
Kämpf A (2005) Produção Comercial de Plantas Ornamentais. Porto Alegre, Agrolivros. 254p.
Koefender J, Streck NA, Buriol GA & Trentin R (2008) Estimati-va do filocrono em calêndula. Ciência Rural, 38:1246-1250. Lopes SJ, Neto DD, Manfron PA & Jasniewicz LR (2004) Models
to estimate phytomass accumulation of hydroponic lettuce. Scientia Agricola, 61:392-400.
Lopes SJ, Santos PM dos, Storck L, Cocco C, Damo HP & Martini LFD (2007) Cronograma de amostragem de alface cultivada em hidroponia para ajuste de curvas de crescimento vegetativo. Pesquisa Agropecuária Brasileira, 42:1451-1457.
Lyra GB, Souza JL de, Lyra GB, Teodoro I & Filho GM (2008) Modelo de crescimento logístico e exponencial para milho BR 106, em três épocas de plantio. Revista Brasileira de Milho e Sorgo, 7:211-230.
Table 4: Mean plastochron and final number of nodes (FNN) of China pink plants grown on different substrates. Santa Maria, State of Rio Grande do Sul, Brazil, 2012
Plastochron FNN Cycle duration
°C day node-1 node plant-1 Days Degree-day
Substrate 1 94.1 a* 14.2 a 90 1336.2
Substrate 2 61.6 c 14.4 a 55 887.1
Substrate 3 68.9 b 14.8 a 68 1019.7
Substrate 4 61.6 c 14.4 a 55 887.1
Substrate 5 60.4 c 14.3 a 54 878.9
Substrate 6 60.2 c 14.6 a 53 863.7
Substrate 1, 50% soil and 50% rice husk ash; Substrate 2, 80% soil and 20% earthworm humus; Substrate 3, 80% rice husk ash and 20% earthworm humus; Substrate 4, 40% soil, 40% rice husk ash and 20% earthworm humus; Substrate 5, 100% peat; Substrate 6, 100% commercial substrate (Mecplant®); Substrate 7, 50% peat and 50% rice husk ash.
*Means followed by different letter differ by the Kruskal-Wallis’s test at 5% of probability of error.
Treatments
Malavolta E (2006) Manual de nutrição mineral de plantas. São Paulo, Ceres. 638p.
Regazzi AJ (2003) Teste para verificar a igualdade de parâmetros e a identidade de modelos de regressão não-linear. Revista Ceres, 50:9-26.
Sakata Seed Sudamérica Ltda (2012) Dianthus f1 diamond.
Dispo-nível em: http://www.sakata.com.br/produtos/flores-de-jardim/ dianthus-f1. Acessado em: 25 de março de 2011. Online. Schuh M, Streck NA, Nardi C, Buriol GA, Bellé RA & Brackmann
A (2005) Vernalização afeta o filocrono em lírio.Bragantia,
64:25-32.
Setiyono TD, Weis A, Specht JE, Bastidas AM & Cassman KG (2007) Understanding and modeling the effect of temperature and daylength on soybean phenology under high-yield conditions. Field Crops Research, 100:257-271.
Silveira EB, Rodrigues VJLB, Gomes AMA & Mesquita JCP (2002) Pó de coco como substrato para produção de mudas de tomatei-ro. Horticultura Brasileira, 20:211-216.
Streck NA (2004) A temperature response function for development of the chrysanthemum (Chrysanthemum x
morifolium Ramat.).Ciência Rural, 34:49-54.
Streck NA, Tibola T, Lago I, Buriol GA, Heldwein AB, Schneider FM & Zago Vivairo (2005) Estimativa do plastocrono em
meloeiro (Cucumis melo L.) cultivado em estufa plástica em
diferentes épocas do ano. Ciência Rural, 35:1275-1280. Toebe M, Lopes SJ, Storck L, Silveira TR da, Milani M & Casarotto
G (2010) Estimativa de plastocrono em crambe. Ciência Rural, 40:793-799.
Verdonck O & Gabriels R (1988) Substrate requirements for plants. Acta Horticulturae, 221:19-23.
Vieira NMB, Andrade MJB de, Carvalho JG de, Junior JÁ & Mo-rais AR (2008) Altura de planta e acúmulo de material seca do feijoeiro cvs. BRS MG Talismã e Ouro Negro em plantio direto e convencional. Ciência e Agrotecnologia, 32:1687-1693. Xue Q, Weiss A & Baenziger PS (2004) Predicting leaf appearance
in field-grown winter wheat: evaluating linear and non-linear