Dynamics of forage accumulation in Elephant grass subjected to rotational
grazing intensities
1Braulio Maia de Lana Sousa2, Domicio do Nascimento Júnior3, Hélida Christhine de Freitas
Monteiro4, Sila Carneiro da Silva5, Hélio Henrique Vilela3, Márcia Cristina Teixeira da Silveira6,
Carlindo Santos Rodrigues7, André Fischer Sbrissia8
1 Financed by FAPEMIG. Support: CNPq, Brazil.
2Departamento de Zootecnia - UFS, Campus de São Cristóvão, São Cristóvão, SE, Brazil. 3 Departamento de Zootecnia - UFV, Viçosa, MG, Brazil.
4 Departamento de Ciências Agrárias - UNIMONTES, Janaúba, SP, Brazil. 5 Departamento de Zootecnia - USP/ESALQ, Piracicaba, SP, Brazil. 6 EMBRAPA Pecuária Sul - CPPSUL, Bagé, RS, Brazil.
7 Instituto Federal de Educação, Ciências e Tecnologia Baiano - IF BAIANO, Núcleo de Ciências Agrárias, Uruçuca, BA, Brazil. 8 Departamento de Produção Animal e Alimentos - UDESC, Lages, SC, Brazil.
ABSTRACT - We assessed the accumulation dynamics of forage and its components in Elephant grass cv. Napier (Pennisetum purpureum Schum.) that were subjected to three post-grazing height treatments (30, 50, and 70 cm) from February through May 2009 (experiment one) and December 2009 through May 2010 (experiment two). In experiment one, the grazing events started when the light interception by the canopy reached 95%. The same was adopted for experiment two, except for the first grazing event, which was based on the height of the apical meristems of basal tillers. The experimental design for both experiments was a randomized complete block with three replications. The pastures that were managed at a post-grazing height of 30 cm exhibited lower rates of leaf and stem growth, total growth and forage accumulation than those that were managed at 50 or 70 cm, indicating that post-grazing height affects Elephant grass. The pastures that were managed at 50 cm exhibited relatively stable accumulation rates and less stem accumulation. Pastures managed at 70 cm of pos-grazing height presented more leaf and stem accumulation. Most apical meristems of Elephant grass should be removed in the first grazing when they reach the post-grazing target height of 50 cm. The elevation in the residual post-grazing height, especially in the summer, raises the regrowth vigor in the Elephant grass cv. Napier pasture. The post-grazing height of 30 cm reduces the growth of the Elephant grass cv. Napier.
Key Words: grazing management, growth, light interception, Pennisetum purpureum, senescence, tiller categories
Introduction
Forage accumulation in pastures is a function of the balance between the growth and senescence processes (Bircham & Hodgson, 1983) that occur in tillers associated with tillering patterns (e.g., appearance, mortality and survival). Thus, the forage accumulation rate reflects the interactions between the genetic attributes of the plant, the environmental effects on its morphophysiological processes and the grazing management (Lemaire & Chapman, 1996).
Recent studies with tropical grasses revealed a fairly consistent pattern of forage accumulation in which grass reduces leaf accumulation and enhances stem elongation and leaf senescence rates after the canopy reaches 95% of light interception (Carnevalli et al., 2006; Da Silva et al., 2009). Thus, the timing of regrowth interruption seems to be well defined. However, the defoliation intensity still needs to be determined. Using severe post-grazing heights can
reduce photosynthesis rates in plants and increase apical meristem decapitation, which would increase the time required for the removed leaf area to recover (Brougham, 1956). However, using a severe (high) post-grazing height can also reduce intraspecific light competition by modifying the light environment in the canopy and promoting increased tissue and tiller renewal, thereby resulting in a younger population of tillers. Some studies have suggested that tiller age influences both morphogenetic and structural characteristics, thereby resulting in a progressive loss of vigor with advancing tiller age (Paiva et al., 2011).
Elephant grass (Pennisetum purpureum Schum.) has a high forage yield potential and is widely used in dairy farming. In this application, there is a potentially large influence of the tiller type that is produced or exploited on the balance between the physiological processes of photosynthesis and respiration, growth, tillering, and senescence, as large amounts of aerial tillers are produced in
ISSN 1806-9290
www.sbz.org.br R. Bras. Zootec., v.42, n.9, p.629-638, 2013
pastures. Despite its widespread use, knowledge regarding the forage accumulation process and the influence of various tiller classes and age ranges is scarce. Thus, the objective of this study was to assess the forage accumulation process in pastures of Elephant grass cv. Napier subjected to rotational grazing intensities and characterized by the pre-grazing condition of 95% light interception.
Material and Methods
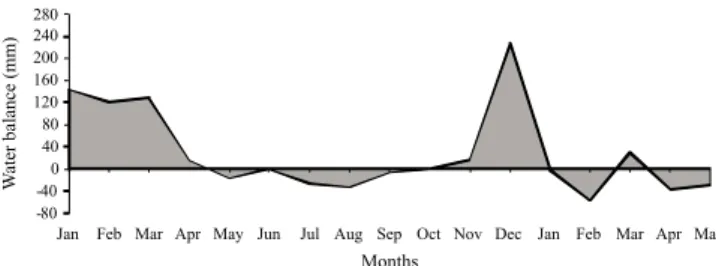
This study was conducted in an area cultivated with Elephant grass cv. Napier in Viçosa, MG, Brazil (20° 45' S, 42º 51' W, 651 m above the sea level). According to the Köppen classification, the climate is a subtropical Cwa type with discrete dry (colder months) and rainy (summer) seasons. Climate information was obtained from the meteorological station located at approximately 1,000 m from the experimental area (Figure 1). The monthly water balance was calculated using a water storage capacity of 50 mm (Thornthwaite & Mather, 1955) (Figure 2).
The soil was classified as Inceptic Hapludults, with a clay-loam texture (EMBRAPA, 2006). Based on a chemical analysis of the 0-20 cm layer performed in December 2007, the soil exhibited the following characteristics: pH in H2O = 5.3; P (Mehlich-1) = 1.7 mg/dm3 and K = 34 mg/dm3;
Ca+2 = 2.0 cmol
c/dm3; Mg+2 = 0.9 cmolc/dm3; H+Al = 4.79
cmolc/dm3; cation exchange capacity (T) = 7.8 cmolc/dm3;
and V = 38%. Based on these results, 2 t/ha of dolomitic limestone were applied, and a fertilization was also performed using 80 kg/ha of P2O5 (simple superphosphate)
and of K2O (potassium oxide), in a single dose.
Because of the early apical meristem lengthening in Elephant grass cv. Napier and elevated aerial tillering following the decapitation of apical meristems of basal tillers (which are originally formed at the onset of each growing season), two experiments were conducted to assess three post-grazing heights: severe (30 cm), representing a high level of forage use; intermediate (50 cm); and lenient (70 cm). In the first experiment, which was conducted
from February through May 2009, the timing of animal entry into the paddocks was based on the canopy light interception level and was independent of the initial decapitation height of the apical meristems of the basal tillers in the first grazing. The animals began grazing when light interception reached 95% and were removed from the paddocks when the post-grazing height targets of 30, 50 or 70 cm were achieved. In the second experiment, which was conducted from December 2009 through May 2010, the first grazing was based on the height of the apical meristems of the existing basal tillers, and was independent of the canopy light interception level. Grazing was conducted when the meristems reached the specified post-grazing residual target heights of 30, 50, or 70 cm. This strategy was aimed at removing the apical meristems of the basal tillers, thus ensuring that the intended post-grazing targets were achieved and stimulating rapid and vigorous regrowth from axillary buds (Hillesheim & Corsi, 1990). In the subsequent grazing, the moment of animal entry into the paddocks was based on the light interception level, so that 95% of the incident light was intercepted. In both experiments, the treatments (post-grazing heights) were restricted to the experimental units (paddocks measuring 400 m²) according to a randomized complete block design with three replications.
Light interception within the pastures was monitored every seven days throughout the regrowth period. However, when the forage canopy intercepted over 90% of the incident light, the monitoring interval was reduced to two days until the target of 95% light interception was reached. Light interception was measured using a canopy analyzer apparatus (LAI 2000, LI-COR, Lincoln, Nebraska, USA) at four random points per experimental unit. At each point, a reading was taken above the canopy, and five readings were taken at the soil surface (below the canopy). In the second experiment, the height of the apical meristems of the basal tillers that resulted from the first grazing in the experiment was measured seven days after standardization by mowing to a height of 20 cm in November 2009. This
0 5 10 15 20 25 30 35
0 50 100 150 200 250 300 350 400
Jan Feb Mar AprMay Jun Jul AugSep Oct NovDec Jan Feb MarAprMay
w
Months
Rainfall (mm) Minimum temperature (ºC) Average temperature (ºC) Maximum temperature (ºC)
Rainfal
l
(m
m)
T
emperature
(ºC
)
Figure 1 - Cumulative monthly rainfall and minimum, average and maximum air temperatures from January 2009 through May 2010.
-80 -40 0 40 80 120 160 200 240 280
Jan Feb Mar Apr May Jun Jul Aug Sep Oct Nov Dec Jan Feb MarApr May
Months
W
ater
balance
(mm)
standardization cut was performed in experiment 1, in January 2009, at 20 cm above the soil. The measurement interval was reduced to two days when the apical meristem height approached the established target. Thus, 20 tillers were cut to the ground level and then opened lengthwise to view their apical meristems. Apical meristem height was measured as the distance between the tiller base and the apex of the apical meristem.
The canopy height was measured concomitantly to the evaluations of light interception at twenty points per experimental unit. It was estimated as the distance between the leaf horizon and the soil level.
During the experiments, the pastures received fertilization with an equivalent of 200 kg/ha of nitrogen that was consistently applied in portions in the ammonium sulfate form after the animals had left the paddocks after each grazing cycle. In the first experiment, animals grazed 3, 4 and 5 times on the pastures managed with post-grazing heights of 30, 50 and 70 cm, respectively. In the second experiment, animals grazed 4, 5 and 6 times on the pastures managed with respective post-grazing heights of 30, 50 and 70 cm. Because the grazing interval and the conditions for animal entry into the pastures were not fixed, the amount of fertilizer that was applied to each paddock at each grazing cycle varied. Thus, 200 kg/ha of nitrogen was divided by the period of grass growth (January-March) to obtain the daily amount to be applied to each paddock. The amount of fertilizer that was effectively applied was calculated by multiplying the daily amount by the previous rest period that occurred in each experimental unit. Hence, at the end of each experiment, every pasture had received the same amount of nitrogen (200 kg/ha). Grazing was performed with crossbred steers weighing approximately 270 kg, but no measurements of animal performance were made. The plots were sized so that the grazing period would last four to six hours. The animals were held in reserve pastures after exiting the paddocks and only returned to the experimental sites when the paddocks again reached pre-grazing conditions.
Dry matter accumulation dynamics were assessed for 12 tillers per experimental unit. These tillers were randomly marked (aerial and basal) at the onset of each regrowth period at points that were representative of the average canopy condition prior to grazing (based on a visual assessment of forage height and mass) and were assessed twice a week by measuring the length of the leaf blades and stems (stem + leaf sheaths). During the assessment period, any aerial tillers that emerged from the marked tillers were incorporated into the monitored group and assessed similarly. These assessments allowed us to
estimate the rates of leaf and stem elongation and of leaf senescence (cm/tiller.day) (Lemaire & Chapman, 1996). On the last day of each assessment period, each marked tiller was cut to the ground level (for the basal tillers) or to the insertion point (for the aerial tillers), packed in a plastic bag and immediately transported to a cold chamber to minimize moisture loss due to respiration and evaporation. After measuring the stems and leaves in the same manner as in the field, the leaf blades from each tiller and their respective stems were dried in a forced air oven at 65 °C for 72 hours. After drying, the material was weighed and the mass of each component was divided by its respective length, generating a mass-length conversion factor that was used to transform all of the field readings from cm/tiller. day to mg/tiller.day. A final transformation to kg/ha.day for the forage dry mass (DM) was performed by multiplying these values by the tiller density in each experimental unit and performing the necessary unit adjustments. The tiller density was calculated by counting the living tillers within four existing metal frames measuring 0.25 m2 (0.25 × 1.00 m)
that were positioned at points that were representative of the average canopy condition prior to grazing (based on a visual assessment of forage height and mass). Thus, linear values for the rates of leaf and stem elongation and leaf senescence were transformed into rates of leaf and stem growth and leaf senescence (kg/ha.day of DM), respectively, of the basal and aerial tillers. The sum of the leaf and stem growth was used as the total growth rate, and the forage accumulation rate was calculated as the difference between the rates of total growth and leaf senescence.
The data were organized by month and subjected to an analysis of variance using the MIXED procedure from the SAS statistical package (Statistical Analysis System, version 8.2) for Windows. The data set was tested to ensure that the basic assumptions for an analysis of variance were met. The Akaike Information Criterion was used to select the variance and covariance matrix (Wolfinger, 1993). Thus, it was possible to detect the effects of the main causes of variation (post-grazing height and month) and their interaction. The effects of post-grazing height and month and their interaction were considered fixed, and the effects of blocks and their interactions were considered random (Littel et al., 2000). The means were compared using Student’s t-test at a 5% significance level.
Results
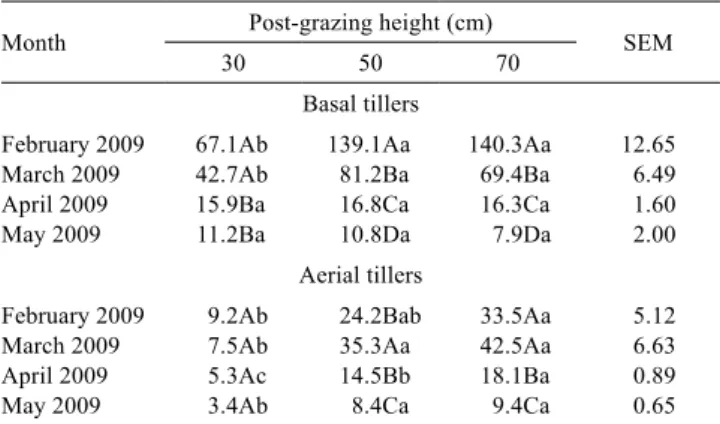
For the basal tillers, the leaf growth rate was generally lower in the pastures that were managed at a post-grazing height of 30 cm compared with those that were managed at 50 or 70 cm in February and March of 2009. These differences disappeared in April and May. For the aerial tillers, the difference between a post-grazing height of 30 cm and heights of 50 or 70 cm was maintained from February through May (Table 1). With the exception of the aerial tillers in the pastures that were managed at a post-grazing height of 30 cm, the leaf growth rate decreased in the pastures throughout the year, and this result was independent of the tiller category.
The rate of stem growth in experiment one was influenced by the interaction between post-grazing height and month for both the basal (P = 0.0002) and aerial tillers (P = 0.0051). In general, the stem growth rate for the basal tillers was lower in the pastures that were managed at a post-grazing height of 30 cm compared with the pastures that were managed at a height of 50 or 70 cm in February and March of 2009. These differences disappeared in April and May. For the aerial tillers, higher growth rates were observed from February through May in the pastures that were managed at a height of 50 or 70 cm, compared with the pastures that were managed at 30 cm (Table 2). With the exception of the pastures that were managed at a post-grazing height of 30 cm, the stem growth rate decreased in the pastures throughout the year, and this result was independent of the tiller category.
The leaf senescence rate in experiment one for the basal tillers was influenced only by the month (P = 0.0074), with higher rates in February and March (30.7 and 28.5 kg/ha.day of DM, respectively) and lower rates in April and May of 2009 (18.3 and 18.2 kg/ha.day of DM, respectively). The
leaf senescence rate for the aerial tillers was affected by the interaction between post-grazing height and month (P<0.0001). Higher rates were recorded in the pastures managed at a post-grazing height of 70 cm than in the pastures managed at 30 or 50 cm in February and March. These differences disappeared in April and May (Table 3). The leaf senescence rate increased in the pastures managed at a height of 50 cm throughout the year and decreased in the pastures managed at 70 cm; no change was observed in the pastures managed at 30 cm.
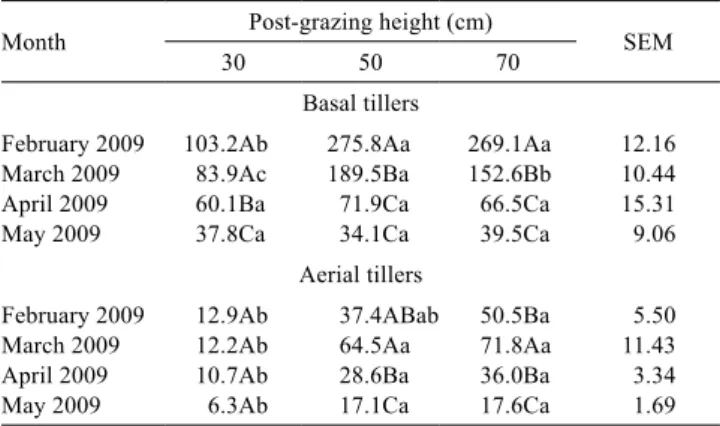
The total growth rate in experiment one was influenced by the interaction between post-grazing height and month for both the basal (P<0.0001) and aerial tillers (P = 0.0287). The total growth rate for the basal tillers was higher in the pastures managed at a post-grazing height of 70 or 50 cm than in the pastures managed at a height of 30 cm in February 2009. In March, the highest rates were obtained in the pastures managed at a post-grazing height of 50 cm, intermediate rates were found in the pastures managed at 70 cm, and the lowest rates were observed in the pastures managed at 30 cm. These differences disappeared in the fall (i.e., April and May) (Table 4). The highest rates occurred
Table 1 - Leaf growth rate (kg/ha.day of DM) in Elephant grass cv. Napier pastures subjected to three post-grazing heights in experiment one
Month Post-grazing height (cm) SEM
30 50 70
Basal tillers
February 2009 67.1Ab 139.1Aa 140.3Aa 12.65 March 2009 42.7Ab 81.2Ba 69.4Ba 6.49 April 2009 15.9Ba 16.8Ca 16.3Ca 1.60 May 2009 11.2Ba 10.8Da 7.9Da 2.00
Aerial tillers
February 2009 9.2Ab 24.2Bab 33.5Aa 5.12 March 2009 7.5Ab 35.3Aa 42.5Aa 6.63 April 2009 5.3Ac 14.5Bb 18.1Ba 0.89 May 2009 3.4Ab 8.4Ca 9.4Ca 0.65
For each tiller category, means followed by the same uppercase letter in the column and lowercase letter in the row do not differ significantly based on Student’s t-test (P>0.05).
SEM - standard error of the mean.
Table 2 - Stem growth rate (kg/ha.day of DM) in Elephant grass cv. Napier pastures subjected to three post-grazing heights in experiment one
Month Post-grazing height (cm) SEM
30 50 70
Basal tillers
February 2009 36.1Ab 136.7Aa 128.9Aa 8.80 March 2009 41.2Ac 108.3Ba 83.1Bb 6.87 April 2009 44.2Aa 55.1Ca 50.2Ca 13.21 May 2009 26.6Aa 23.3Da 31.6Ca 8.09
Aerial tillers
February 2009 3.7Ab 13.2Bab 17.0BCa 3.07 March 2009 4.7Ab 29.3Aa 29.3Aa 6.28 April 2009 5.3Ab 14.0Ba 17.9Ba 2.16 May 2009 3.0Ab 8.7Ca 8.2Ca 0.99
For each tiller category, means followed by the same uppercase letter in the column and lowercase letter in the row do not differ significantly based on Student’s t-test (P>0.05).
SEM - standard error of the mean.
Table 3 - Leaf senescence rate of aerial tillers (kg/ha.day of DM) in Elephant grass cv. Napier pastures subjected to three post-grazing heights in experiment one
Month Post-grazing height (cm) SEM
30 50 70
February 2009 1.2Ab 1.6Bb 11.8Aa 1.00 March 2009 2.2Ab 2.4ABb 8.1Ba 0.90 April 2009 3.3Aa 2.4ABa 2.6Ca 0.30 May 2009 1.2Aa 3.6Aa 4.3Ca 0.70
Means followed by the same uppercase letter in the column and lowercase letter in the row do not differ significantly based on Student’s t-test (P>0.05).
in February and March, and the lowest rates occurred in April and May; these results were independent of post-grazing height. In general, higher total growth rates for the aerial tillers were observed in the pastures managed at a post-grazing height of 70 or 50 cm, compared with those managed at 30 cm. With the exception of the pastures that were managed at a post-grazing height of 30 cm, higher total growth rates were recorded in March, with a decrease observed in April, reaching its minimum in May.
The forage accumulation rate in experiment one was influenced by the interaction between post-grazing height and month for both the basal (P = 0.0378) and aerial tillers (P = 0.0328). For the basal tillers, the pastures managed at a post-grazing height of 70 or 50 cm exhibited higher rates in February and March 2009 than those managed at 30 cm. These differences disappeared in the fall (i.e., April and
May) (Table 5). The forage accumulation rates decreased throughout the year. For the aerial tillers, there was no significant difference among the post-grazing heights in February 2009. From March through May, however, higher rates were observed in the pastures managed at a post-grazing height of 70 or 50 cm than the pastures managed at 30 cm (Table 5). With the exception of the pastures managed at a post-grazing height of 30 cm, the forage accumulation rates reached their highest values in March, and this trend was followed by a decrease in April and May.
The leaf growth rate of the basal tillers in experiment two was influenced by the interaction between post-grazing height and month (P<0.0001). There was no difference in rates between the post-grazing heights at the onset of the experiment, in December 2009. From January through March 2010, there was a significant difference in rates between the heights of 30 and 50 cm: the highest rates were observed in the pastures managed at 70 cm; intermediate rates were observed in the pastures managed at 50 cm; and the lowest rates were obtained in the pastures managed at 30 cm. These differences disappeared in the two final months of the experiment (April and May) (Table 6). In general, the growth rates were the highest during the summer months (December-March) and decreased during the fall (April and May), and this effect was independent of the post-grazing height. For the aerial tillers, the growth rate was affected only by the post-grazing height (P = 0.0245), with the highest rates observed in the pastures managed at a post-grazing height of 70 cm (19.7 kg/ha.day of DM); intermediate rates observed in the pastures managed at 50 cm (13.0 kg/ha.day of DM); and lowest rates verified in the pastures managed at 30 cm (6.1 kg/ha.day of DM).
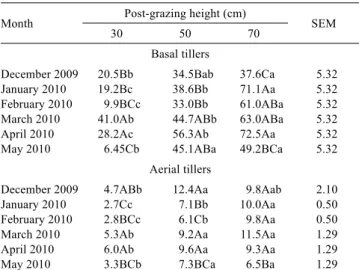
The stem growth rate in experiment two was affected by the interaction between post-grazing height and month for both basal (P = 0.0364), and aerial tillers (P = 0.0365). For the basal tillers, from December 2009 through April 2010, the highest values were generally observed in the pastures Table 4 - Total growth rate (kg/ha.day of DM) in Elephant grass
cv. Napier pastures subjected to three post-grazing heights in experiment one
Month Post-grazing height (cm) SEM
30 50 70
Basal tillers
February 2009 103.2Ab 275.8Aa 269.1Aa 12.16 March 2009 83.9Ac 189.5Ba 152.6Bb 10.44 April 2009 60.1Ba 71.9Ca 66.5Ca 15.31 May 2009 37.8Ca 34.1Ca 39.5Ca 9.06
Aerial tillers
February 2009 12.9Ab 37.4ABab 50.5Ba 5.50 March 2009 12.2Ab 64.5Aa 71.8Aa 11.43 April 2009 10.7Ab 28.6Ba 36.0Ba 3.34 May 2009 6.3Ab 17.1Ca 17.6Ca 1.69
For each tiller category, means followed by the same uppercase letter in the column and lowercase letter in the row do not differ significantly based on Student’s t-test (P>0.05).
SEM - standard error of the mean.
Table 5 - Forage accumulation rate (kg/ha.day of DM) in Elephant grass cv. Napier pastures subjected to three post-grazing heights in experiment one
Month Post-grazing height (cm) SEM
30 50 70
Basal tillers
February 2009 82.1Ab 248.7Aa 225.3Aa 17.36 March 2009 62.8ABb 160.5Ba 117.2Ba 13.69 April 2009 39.2Aba 55.5Ca 48.8Ca 10.10 May 2009 21.5Ba 13.5Da 21.3Da 3.71
Aerial tillers
February 2009 11.7Ab 35.8BCa 38.7Ba 3.70 March 2009 10.0Ab 62.1Aa 63.7Aa 11.24 April 2009 7.4Ab 26.2ABa 33.4Ba 3.22 May 2009 4.2Ab 13.5Ca 13.2Ca 1.82
For each tiller category, means followed by the same uppercase letter in the column and lowercase letter in the row do not differ significantly based on Student’s t-test (P>0.05).
SEM - standard error of the mean.
Table 6 - Leaf growth rate of basal tillers (kg/ha.day of DM) in Elephant grass cv. Napier pastures subjected to three post-grazing heights in experiment two
Month Post-grazing height (cm) SEM
30 50 70
December 2009 40.0Aa 56.5Aa 50.6Ba 7.04 January 2010 27.2ABb 56.1Aab 79.7Aa 10.41 February 2010 23.9ABb 42.6ABb 84.1Aa 8.57 March 2010 25.3ABb 36.6ABab 52.8Ba 9.39 April 2010 22.4Ba 28.5BCa 21.5Ca 6.76 May 2010 21.9Ba 17.5Ca 17.2Ca 3.07
Means followed by the same uppercase letter in the column and lowercase letter in the row do not differ significantly based on Student’s t-test (P>0.05).
managed at a post-grazing height of 70 cm; intermediate rates were obtained in the pastures managed at 50 cm (except March 2010); and the lowest rates were obtained in the pastures managed at 30 cm. In May, higher rates were obtained in the pastures managed at a post-grazing height of 70 or 50 cm than in the pastures maintained at a post-grazing height of 30 cm (Table 7). For the aerial tillers, at the onset of the experiment, in December 2009, a higher stem growth rate was observed in the pastures managed at a post-grazing height of 50 or 70 cm in relation to those managed at 30 cm. In January and February 2010, a difference between the post-grazing heights was detected, with the highest rates in the pastures managed at a post-grazing height of 70 cm, intermediate rates in the pastures managed at 50 cm, and lowest values in the pastures managed at 30 cm.
The leaf senescence rate in experiment two was influenced only by the month for both the basal (P<0.0001) and aerial tillers (P = 0.0034). At the onset of the experiment, the mean leaf senescence rates of the basal and aerial tillers were 14.2 and 0.3 kg/ha.day of DM, respectively. These rates increased in January (to 17.6 and 5.0 kg/ha.day of DM, respectively) and February 2010 (to 18.4 and 6.0 kg/ha.day of DM, respectively), and then decreased in March (to 15.7 and 3.0 kg/ha.day DM, respectively), reaching even lower values in April (11.4 and 1.7 kg/ha.day of DM, respectively) and May 2010 (5.3 and 2.6 kg/ha.day of DM, respectively).
The total growth rate of the basal tillers in experiment two was affected by the interaction between post-grazing height and month (P = 0.0072). At the onset of the experiment, the highest total growth rate was observed in
the pastures managed at a post-grazing height of 50 cm; intermediate rates were found in the pastures managed at 70 cm; and the lowest rates were obtained in the pastures managed at 30 cm. From January through March 2010, there was a difference between the post-grazing heights: the highest rates were observed in the pastures managed at a post-grazing height of 70 cm; intermediate rates were found in the pastures managed at 50 cm; and the lowest rates were obtained in the pastures managed at 30 cm. In April and May, the pastures managed at a post-grazing height of 70 or 50 cm exhibited higher total growth rates than the pastures managed at 30 cm (Table 8). The total growth rate in the pastures managed at a post-grazing height of 30 cm decreased in January and February of 2010, increased in March, and then decreased again in May. In contrast, the total growth rate in the pastures managed at a height of 70 cm increased in February and then decreased throughout the rest of the year. In the pastures managed at a post-grazing height of 50 cm, the rates were stable throughout the experimental period. The total growth rate of the aerial tillers was influenced by both post-grazing height (P = 0.0181) and month (P<0.0001). Higher rates were observed in the pastures managed at a post-grazing height of 70 (29.1 kg/ ha.day of DM) or 50 cm (21.6 kg/ha.day of DM) than in the pastures managed at 30 cm (10.2 kg/ha.day of DM). The total growth rates in December 2009 and January 2010 were 22.1 and 19.1 kg/ha.day of DM, respectively; the rate decreased in February (to 17.1 kg/ha.day of DM), increased again in March (to 23.9 kg/ha.day of DM), and then decreased again in April (to 22.1 kg/ha.day of DM) and May (to 17.6 kg/ha.day of DM).
The forage accumulation rate of the basal tillers in experiment two was affected by the interaction between post-grazing height and month (P = 0.0086). At the onset of the experiment, higher rates were observed in the pastures managed at a post-grazing height of 70 or 50 cm compared with the pastures managed at a height of 30 cm. From Table 7 - Stem growth rate (kg/ha.day of DM) in Elephant grass
cv. Napier pastures subjected to three post-grazing heights in experiment two
Month Post-grazing height (cm) SEM
30 50 70
Basal tillers
December 2009 20.5Bb 34.5Bab 37.6Ca 5.32 January 2010 19.2Bc 38.6Bb 71.1Aa 5.32 February 2010 9.9BCc 33.0Bb 61.0ABa 5.32 March 2010 41.0Ab 44.7ABb 63.0ABa 5.32 April 2010 28.2Ac 56.3Ab 72.5Aa 5.32 May 2010 6.45Cb 45.1ABa 49.2BCa 5.32
Aerial tillers
December 2009 4.7ABb 12.4Aa 9.8Aab 2.10 January 2010 2.7Cc 7.1Bb 10.0Aa 0.50 February 2010 2.8BCc 6.1Cb 9.8Aa 0.50 March 2010 5.3Ab 9.2Aa 11.5Aa 1.29 April 2010 6.0Ab 9.6Aa 9.3Aa 1.29 May 2010 3.3BCb 7.3BCa 6.5Ba 1.29
For each tiller category, means followed by the same uppercase letter in the column and lowercase letter in the row do not differ significantly based on Student’s t-test (P>0.05).
SEM - standard error of the mean.
Table 8 - Total growth rate of basal tillers (kg/ha.day of DM) in Elephant grass cv. Napier pastures subjected to three post-grazing heights in experiment two
Month Post-grazing height (cm) SEM
30 50 70
December 2009 60.5Ab 90.9Aa 88.3CDab 10.3 January 2010 46.4Abc 94.7Ab 164.6Aa 9.8 February 2010 33.9BCc 75.6Ab 145.1Aba 12.3 March 2010 66.3Ac 81.3Ab 128.7Ba 9.9 April 2010 50.6ABb 84.8Aa 94.0Ca 9.3 May 2010 28.4Cb 71.6Aa 66.4Da 8.9
Means followed by the same uppercase letter in the column and lowercase letter in the row do not differ significantly based on Student’s t-test (P>0.05).
January through March 2010, the pastures managed at a post-grazing height of 70 cm showed a higher rate than the pastures managed at 50 or 30 cm. In the fall (i.e., April and May), higher rates were obtained in the pastures managed at a post-grazing height of 70 or 50 cm than in the pastures managed at 30 cm (Table 9). The forage accumulation rate of the aerial tillers was influenced by post-grazing height (P = 0.0264) and month (P<0.0001). Higher rates were observed in the pastures managed at a post-grazing height of 70 cm (24.7 kg/ha.day of DM) or 50 cm (19.1 kg/ha.day of DM) in relation to the pastures managed at 30 cm (8.1 kg/ha.day of DM). At the onset of the experiment, the forage accumulation rate was high (21.0 kg/ha.day of DM); it then decreased in January (to 14.2 kg/ha.day of DM) and February 2010 (11.4 kg/ha.day of DM), increased again in March (to 20.9 kg/ha.day of DM) and April (20.4 kg/ha.day of DM), and then decreased in May (to 15.0 kg/ha.day of DM).
Discussion
The canopy height under the pre-grazing condition varied from 83 to 97 cm in the summer, and from 71 to 85 cm in the fall in experiment 1. In experiment 2, it varied from 99 to 108 cm in the summer and from 92 to 95 cm in the fall. This variation may be associated with the short adaptation period of the pastures. According to Da Silva et al. (2008) the relation between 95% of light interception and the canopy height is only appropriate when the pastures are regularly used and also with the control of the grazing process. Thus, for the establishment of the target pre-grazing height of Elephant grass cv. Napier, more research should be carried out for longer periods. Despite the variation, which may be associated in parts with the shorter duration of the first experiment in comparison with the second one, these values are near those reported by Voltolini (2006) for Elephant grass cv. Cameroon. These authors revealed that
the light interception of 95% of incident light by the canopy for that forage plant coincides with the average height of 100 cm. It must also be emphasized that these height values are inferior to the 170 to 180 cm (Deresz et al., 2006) historically recommended for the management of Elephant grass under grazing.
Regardless of the strategy selected with respect to the onset of grazing in Elephant grass pastures (with the first grazing performed at the 95% light interception target - experiment one - or when the apical meristems were at the residue target-heights - experiment two) and the tiller category (basal or aerial), the pastures managed at a post-grazing height of 30 cm during the summer months showed lower rates of leaf growth (Tables 1 and 6) and stem growth (Tables 2 and 7), and consequently, lower rates of total growth (Tables 4 and 8) and forage accumulation (Tables 5). The most intense grazing (i.e., to a length of 30 cm) removes higher quantities of forage. Under these conditions, initial regrowth is slow, despite an improved light environment due to increases in the quantity and quality of light within the canopy (Brougham, 1956); this slow growth rate is due to a smaller amount of leaves, which results in a limited photosynthetic capacity after grazing (Parsons & Penning, 1988). Thus, carbon fixation and the production of organic compounds are reduced, which increases the time required to replenish the biomass (Parsons et al., 1983). Additionally, intensive grazing promotes increased tiller decapitation, which further reduces regrowth vigor because of the need to allocate photoassimilates for the differentiation and division of new cells to form new meristems and tillers (Taiz & Zeiger, 2009).
The lower rates of leaf and stem growth, total growth and of forage accumulation observed in the pastures managed at a post-grazing height of 30 cm suggest that this post-grazing height was exceedingly low (Sousa, 2009) and was likely too severe for proper management of Elephant grass cv. Napier. These pastures also presented lower mass and forage accumulation, lower tiller density, lower tiller renewal, and lower quantity of weeds (Monteiro, 2011). Nevertheless, it is worth remarking that the Elephant grass is a plant that demands fertility of soil (Pereira et al., 2010). Throughout the experimental period, the acidity and the fertility of the soil were not assessed; it was only fertilized with nitrogen. Therefore, this reduction in the growth of the basal and aerial tillers is possibly due to the higher removal of forage and lower recycling of nutrients (Da Silva et al., 2008) associated with the low level of natural fertility of the soil in the experimental area (P = 1.7 mg/dm3 and V = 38%).
Under high soil fertility conditions, this reduction in growth may not occur; therefore, this should be better evaluated Table 9 - Forage accumulation rate of basal tillers (kg/ha.day of
DM) in Elephant grass cv. Napier pastures subjected to three post-grazing heights in experiment two
Month Post-grazing height (cm) SEM
30 50 70
December 2009 48.0Ab 76.0Aa 73.2CDa 8.89 January 2010 31.8ABb 56.7Ab 144.1Aa 8.89 February 2010 32.0ABb 57.6Ab 123.9Aba 8.89 March 2010 50.1Ab 69.0Ab 112.1Ba 8.89 April 2010 37.4ABb 78.3Aa 79.4Ca 8.89 May 2010 23.4Bb 68.0Aa 54.3Da 8.89
Means followed by the same uppercase letter in the column and lowercase letter in the row do not differ significantly based on Student’s t-test (P>0.05).
so that practical recommendations of grazing management can be made.
Overall, the biomass accumulation rates did not differ between the post-grazing heights of 50 and 70 cm, indicating either of these post-grazing heights would be appropriate for Elephant grass without compromising their remaining leaf area and organic reserves. However, the pastures managed at a post-grazing height of 50 cm exhibited relatively stable accumulation rates, particularly in experiment two, which suggests less seasonality in the yield that can be obtained in a single growing season. In addition, the pastures managed at a post-grazing height of 50 cm showed less stem accumulation than the pastures managed at 70 cm, particularly in experiment two. These higher leaf and stem accumulation rates in pastures managed with a post-grazing height of 70 cm in relation to 50 cm were also recorded by Monteiro (2011), but they were estimated through cuts of forage in an area delimitated by an iron frame. Thus, the choice in the post-grazing height may be flexible, and the post-post-grazing height of 50 cm may be indicated if the aim is forage production in a more stable way, or 70 cm if one aims at higher leaf and stem production.
Leaf senescence rate was not affected by post-grazing height, and this result was independent of the management strategy that was used (i.e., experiment one or experiment two), which is likely due to the pre-grazing light interception target of 95%. This condition is considered to be sufficient for regrowth interruption, for avoiding intense light competition, and for controlling leaf senescence and leaf death (Carnevalli et al., 2006).
In the fall, tissue growth was reduced, which was characterized by lower leaf (Tables 1 and 6) and stem (Tables 2) growth rates that consequently led to lower total growth (Tables 4 and 8) and forage accumulation (Tables 5) rates than in the summer. Also in the fall, the differences between post-grazing heights were diminished or disappeared. The forage accumulation process is strongly affected by variations in environmental conditions (Lemaire & Chapman, 1996). The fall is characterized by lower temperatures, reduced precipitation (Figures 1 and 2), and less light (i.e., shorter days) than the summer, and these factors decreased forage production. The growth of forage plants in tropical climates is slowed at temperatures below 16 ºC (Whitheman, 1980), which is due to a decreased rate of photosynthesis (Taiz & Zeiger, 2009). In turn, a water deficit reduces the turgor pressure on the cell wall, which negatively affects leaf expansion and stimulates stomatal closing, thereby leading to reductions in both carbon dioxide absorption and the transfer of heat to the
atmosphere, as well as a decreased absorption of nutrients, particularly nitrogen (Taiz & Zeiger, 2009).
In addition, in the fall, Elephant grass cv. Napier is in its reproductive stage, which increases the stem growth rate, increases senescence relative to leaf growth, and reduces the rates of leaf growth, total growth and forage accumulation during this time of the year. In the reproductive stage, stem elongation increases, thereby making this component a potent sink for assimilates (Taiz & Zeiger, 2009). Concomitantly, the apical meristem grows rapidly, thus reducing the distance that the new leaf flows inside the pseudostem and consequently reducing its length (Duru & Ducrocq, 2000). This change in the patterns of photoassimilate translocation results in a higher production of stems than leaves. Once they reach maturity (i.e., the flowering stage), these tillers complete their life cycle and die. However, limited environmental conditions can prevent these tillers from being replaced with new ones, thereby leading to a net reduction in their population density (Sbrissa et al., 2010) and forage production.
post-grazing height, as post-grazing animals may choose not to graze on these plants due to their lower nutritional value (Van Soest, 1994) and because stems are a physical barrier to grazing. Moreover, based on our analysis of leaf growth and senescence, it is clear that pastures that are managed using a strategy of decapitating the apical meristems throughout the grazing season (i.e., experiment one) exhibit higher senescence as compared with leaf growth. This management strategy thus resulted in negative leaf accumulation in May (fall), in which senescence was 26-30% higher than leaf growth. This result indicates that a strategy of decapitating most of the meristems of Elephant grass cv. Napier in the first grazing is appropriate. However, additional studies regarding this approach are needed, and these new studies should include longer experiment duration and cover a larger experimental area. In addition, the animals should be included as part of the response assessment procedure so that practical recommendations and more accurate management decisions can be reached.
In general, the contribution of aerial tillers in relation to basal tillers increased over the course of the experiments and with increasing post-grazing height. Thus, the respective participation of the aerial tillers at post-grazing heights of 30, 50 and 70 cm were as follows: 25.0, 47.7 and 54.3% (in experiment one) and 26.3, 34 and 53.8% (in experiment two) for leaf growth rate; 10.7, 27.2 and 26.3% (in experiment one) for stem growth rate; 13.6, 14.9 and 19.5% (in experiment one) for leaf senescence rate; 15.1, 33.4 and 35.1% (in experiment one) and 26, 20.5 and 28.9% (in experiment two) for total growth rate; and 16.3, 50 and 40.6% (in experiment one) and 24.3, 21.6 and 29.8% (in experiment two) for forage accumulation rate. An exception to this trend was as follows: for stem growth (17.5, 14.6 and 11.4% at post-grazing heights of 30, 50 and 70 cm, respectively) and leaf senescence (37.5, 29.4 and 24.8% at post-grazing heights of 30, 50 and 70 cm, respectively) rates in experiment two, an elevated post-grazing height resulted in a decreased participation of aerial tillers compared with basal tillers. This higher contribution of aerial tillers throughout the experiments reflects an increase in their density in relation to basal tillers, which is possibly due to the fact that Elephant grass flowers in the fall. Furthermore, the contribution of aerial tillering was higher with higher post-grazing heights, which is a condition that leaves more substrate (e.g., more remaining stem after decapitation) for their recovery. Aerial tillers located in the upper canopy (as assessed visually) facilitate their removal by grazing animals, particularly in pastures that are managed at a lower post-grazing height.
Conclusions
The elevation in the residual post-grazing height, especially in the summer, elevates the regrowth vigor in the pasture of Elephant grass cv. Napier. The post-grazing height of 30 cm reduces the growth of the Elephant grass cv. Napier.
References
BIRCHAM, J.S.; HODGSON, J. The influence of sward condition on rates of herbage growth and senescence in mixed swards under continuous stocking management. Grass and Forage Science, v.38, p.323-331, 1983.
BROUGHAM, R.W. Effects of intensity of defoliation on regrowth of pasture. Australian Journal of Agricultural Research, v.7, p.377-387, 1956.
CARNEVALLI, R.A.; Da SILVA, S.C.; BUENO, A.A.O. et al. Herbage production and grazing losses in Panicum maximum cv. Mombaça under four grazing managements. Tropical Grasslands, v.40, p.165-176, 2006.
DA SILVA, S.C.; NASCIMENTO JÚNIOR, D.; EUCLIDES, V.B.P.
Pastagens: Conceitos básicos, produção e manejo. Viçosa, MG: Suprema, 2008. 115p.
Da SILVA, S.C.; BUENO, A.A.O.; CARNEVALLI, R.A. et al. Sward structural characteristics and herbage accumulation of Panicum maximum cv. Mombaça subjected to rotational stocking managements. Scientia Agricola, v.66, n.1, p.8-19, 2009.
DERESZ, F.; CÓSER, A.C.; MARTINS, C.E. Formação e utilização de pastagens de capim-elefante. 2.ed. Juiz de Fora: Embrapa Gado de Leite, 2006. (Instrução técnica).
DURU, M.; DUCROCQ, H. Growth and senescence of the successive grass leaves o a tiller ontogenic development and effect of temperature. Annals of Botany, v.85, p.635-643, 2000.
EMPRESA BRASILEIRA DE PESQUISA AGROPECUÁRIA - EMBRAPA. Serviço Nacional de Levantamento e Conservação de Solos. Sistema brasileiro de classificação de solos. 2.ed. Rio de Janeiro: Embrapa Solos, 2006. 306p.
HILLESHEIM, A.; CORSI, M. Capim-elefante sob pastejo. Fatores que afetam o consumo. Pesquisa Agropecuária Brasileira, v.25, n.3, p.409-419, 1990.
LEMAIRE, G.; CHAPMAN, D. Tissue flows in grazed plant communities. In: HODGSON, J.; ILLIUS, A.W. (Eds.). The ecology and management of grazing systems. Wallingford: CAB International, 1996. p.3-36.
LITTEL, R.C.; PENDERGAST, J.; NATARAJAN, R. Modelling covariance structure in the analysis of repeated measures data.
Statistics in Medicine, v.19, p.1793-1819, 2000.
MONTEIRO, H.C.F. Estrutura do dossel, acúmulo de forragem e dinâmica do perfilhamento em pastos de capim-elefante cv. Napier submetido a estratégias de pastejo rotativo. 2011. 133f. Tese (Doutorado em Zootecnia) - Universidade Federal de Viçosa, Viçosa, MG.
PAIVA, A.J.; Da SILVA, S.C.; PEREIRA, L.E.T. et al. Morphogenesis on age categories of tillers in Marandu palisadegrass. Scientia Agricola, v.68, n.6, p.626-631, 2011.
PARSONS, A.J.; LEAFE, E.L.; COLLETT, B. et al. The physiology of grass production under grazing. II. Photosynthesis, crop growth and animal intake of continuously grazed sward. Journal of Applied Ecology, v.20, p.127-139, 1983.
PEREIRA, A.V.; AUAD, A.M.; LÉDO, F.J.S. et al. Pennisetum
purpureum. In: FONSECA, D.M.; MARTUSCELLO, J.A. (Eds.).
Plantas forrageiras. Viçosa, MG: UFV, 2010. p.197-219.
SBRISSIA, A.F.; Da SILVA, S.C.; SARMENTO, D.O.L. et al. Tillering dynamics in palisadegrass swards continuously stocked by cattle. Plant Ecology, v.206, p.349-359, 2010.
SOUSA, B.M.L. Morfogênese e características estruturais dos capins Andropógon e Xaraés submetidos a três alturas de corte. 2009. 108f. Dissertação (Mestrado em Zootecnia) - Universidade Federal de Viçosa, Viçosa, MG.
TAIZ, L.; ZEIGER, E. Fisiologia vegetal. 4.ed. Tradução SANTARÉM, E.R. et al. Porto Alegre: Artmed, 2009. 848p. THORNTHWAITE, C.W.; MATHER, R.J. The water balance. New
Jersey: Laboratory of Climatology, v.8, 1955. 104p.
VAN SOEST, P.J. Nutritional ecology of the ruminant. 2.ed. New York: Cornell University Press, 1994. 476p.
VOLTOLINI, T.V. Adequação protéica em rações com pastagens ou com cana-de-açúcar e efeito de diferentes intervalos entre desfolhas da pastagem de capim Elefante sobre o desempenho lactacional de vacas leiteiras. 2006. 167f. Tese (Doutorado em Agronomia) - Escola Superior de Agricultura “Luiz de Queiroz”/ Universidade de São Paulo, Piracicaba.
WHITHEMAN, P.C. Tropical pasture Science. New York: Oxford University Press, 1980. 392p.