GROWTH AND YIELD OF COMMON BEAN CULTIVARS AT TWO SOIL PHOSPHORUS LEVELS UNDER
BIOLOGICAL NITROGEN FIXATION1
ADELSON PAULO ARAÚJO2, MARCELO GRANDI TEIXEIRA3 and DEJAIR LOPES DE ALMEIDA3
ABSTRACT - The genotypic differences on growth and yield of common bean (Phaseolus vulgaris L.) in response to P supply were evaluated in a field experiment under biological N2 fixation. Eight cultivars were grown at two levels of applied P (12 and 50 kg ha-1 of P _ P
1 and P2 respectively), in randomized block design in factorial arrangement. Vegetative biomass was sampled at three ontogenetic stages. The effects of genotype and phosphorus were significant for most traits, but not the genotype × phosphorus interaction. The cultivars presented different patterns of biomass production and nutrient accumulation, particularly on root system. At P1, P accumulation persisted after the beginning of pod filling, and P translocation from roots to shoots was lower. The nodule senescence observed after flowering might have reduced N2 fixation during pod filling. The responses of vegetative growth to the higher P supply did not reflect with the same magnitude on yield, which increased only 6% at P2; hence the harvest index was lower at P2. The cultivars with highest yields also presented lower grain P concentrations. A sub-optimal supply of N could have limited the expression of the yield potential of cultivars, reducing the genotypic variability of responses to P levels.
Index terms: genotype, harvest index, nodulation, Phaseolus vulgaris.
CRESCIMENTO E PRODUÇÃO DE CULTIVARES DE FEIJOEIRO EM DOIS NÍVEIS DE FÓSFORO NO SOLO SOB FIXAÇÃO BIOLÓGICA DE NITROGÊNIO
RESUMO - As diferenças genotípicas no crescimento e produção do feijoeiro (Phaseolus vulgaris L.), em resposta ao suprimento de P, foram avaliadas em experimento de campo sob fixação biológica de N2. Foram cultivadas oito cultivares em duas doses de P (12 e 50 kg ha-1 de P, respectivamente P
1 e P2), em arranjo fatorial em blocos ao acaso, efetuando-se três amostragens de biomassa, em estágios ontogenéticos. Os efeitos de genótipo e fósforo foram significativos na maioria dos caracteres, mas não a interação genótipo × fósforo. As cultivares apresentaram diferentes padrões de produção de biomassa e acumulação de nutrientes, particularmente nas raízes. Em P1 a acumulação de P manteve-se após o início de formação das vagens, e a translocação de P da raiz para a parte aérea foi menor. A senescência de nódulos após a floração pode ter reduzido a fixação de N2 durante o enchimento das vagens. As respostas do crescimento vegetativo ao maior suprimento de P não se refletiram com a mesma magnitude na produção de grãos, que aumentou apenas 6% em P2; por isso, o índice de colheita foi menor em P2. As cultivares com maiores rendimentos apresentaram menores teores de P no grão. Um suprimento subótimo de N pode ter limitado a expressão do potencial produtivo das cultivares, reduzindo a variabilidade genotípica das respostas ao P.
Termos para indexação: feijão, genótipo, índice de colheita, nodulação, Phaseolus vulgaris.
INTRODUCTION
Phosphorus deficiency is the most widespread soil constraint to agricultural production in Tropical America (Sánchez & Salinas, 1981). Common bean (Phaseolus vulgaris L.) crop exhibits a generalized response to P fertilization, as demonstrated by
sev-1Accepted for publication on June 11, 1999.
2Agronomist, Ph.D., Dep. de Solos, Universidade Federal
Rural do Rio de Janeiro (UFRRJ), CEP 23890-000 Seropédica, RJ, Brazil. E-mail: [email protected]
3Agronomist, Ph.D., Embrapa-Centro Nacional de Pesquisa
eral trials in Brazil (Oliveira et al., 1982). Combined analysis of seven experiments showed that the maxi-mal economic fertilizer level for bean production was equal to 47 kg ha-1 of P (Barbosa Filho & Silva, 1994).
Some works have noticed the genotypic variabil-ity for responses to P fertilization of bean yield (Haag et al., 1978; Graham & Rosas, 1979; Informe ..., 1985, 1986; Oliveira et al., 1987; Pereira & Bliss, 1989; Youngdahl, 1990; Yan et al., 1995a). Owing to such genotypic differences, fertilizer recommendation must consider the crop technological level, in order to obtain the maximal potential of a specific cultivar (Oliveira et al., 1987).
Yield has been considered as a quantitative char-acter, i.e., influenced by many genes with the effects of individual genes normally unidentified, its expres-sion depending upon interaction of many physiologi-cal component processes (Wallace et al., 1972). Therefore, grain yield would not be sufficient as unique criterion for evaluating efficiency of P use of bean genotypes: as yield integrates many edaphic and climatic variables, it would likely to conceal the efficient germplasm (Informe ..., 1985). The identifi-cation of morphological traits and a specific period on crop development, regarded critical for establish-ment of cultivars under low P, could enhance the ability of manipulating the germplasm (Informe ..., 1985). The lack of significance on the interaction between growth under low P and three soil types might mean that bean adaptation to low P is stable across different environments, making the selection and breeding relatively easier (Yan et al., 1995b).
The failure to establish effective nodulation is often considered the main reason for poor N2
fixa-tion by common bean in the field, but the species may be genetically predisposed to poor fixation be-cause of ineffective symbiosis and the short vegeta-tive fixation period (Piha & Munns, 1987). Most stud-ies on adaptation of beans to low P availability were carried out under conditions of combined N, and stud-ies to ensure that tolerance to low P is compatible with N2 fixation are needed, since attempts to select
bean genotypes tolerant to low P are likely to be affected by the symbiosis established with rizobia (Graham & Rosas, 1979). Genotypic variability in N2
fixation at low soil P levels indicates that breeding to enhance these traits simultaneously would be pos-sible (Pereira & Bliss, 1989).
The objective of this work was to evaluate the differences of common bean cultivars in the re-sponses to P supply of the vegetative growth, N and P accumulation, and yield, in a field experiment under conditions of biological N2 fixation.
MATERIAL AND METHODS
The experiment was carried out at the Embrapa-Centro Nacional de Pesquisa de Agrobiologia (CNPAB), in a complete randomized block design in 8×2 factorial arrangement with four replicates. Eight bean cultivars (BAT 76, Carioca, Goiano Precoce, ICA Pijao, Ouro Negro, Puebla 152, Rico 23, Rio Tibagi) were cropped at two levels of applied P (12 and 50 kg ha-1 of P __ P
1 and P2
respectively).
The soil was a Typic Haplustult, presenting at 0-20 cm depth (Embrapa, 1979): 30 mmolc kg-1 of Ca,
10 mmolc kg-1 of Mg, 1.9 mmolc kg-1 of K, 1 mmolc kg-1 of
Al, 5 mg kg-1 of available P, water pH 4.9, 7.7 g kg-1 of C,
sandy loam texture. The soil was plowed and harrowed, and 800 kg ha-1 of calcareous and 200 kg ha-1 of gypsum
were applied and incorporated. Rows were marked 0.5 m apart and plots were delimited, each one having four lines 6 m long. The following fertilizers were applied in the rows: 30 kg ha-1 of K (as potassium chloride), 40 kg ha-1 of
fritted trace elements, 12 and 50 kg ha-1 of P (as triple
superphosphate).
The seeds, provided by Embrapa-Centro Nacional de Pesquisa de Arroz e Feijão (CNPAF), were coated with inoculant containing the strains BR10049 of Rhizobium leguminosarum biovar phaseoli and BR10050 of R. tropici (CIAT 899). The sowing density of 12 seed m-1 resulted in
a final stand of 22.3 plant m-2. Due to leaf symptoms of N
deficiency, 30 kg ha-1 of N as urea was banded 10 days
after emergence. During the course of experiment, from April to July 1995, the climatic data were (mean ± standard error): mean temperature 21.6 ± 0.2oC, relative humidity
69.3 ± 1.4%, pan evaporation 3.1 ± 0.2 mm day-1, rainfall
(including irrigation) 220 mm.
provided the number of pods and seeds, seed yield, and seed N and P concentrations. The remaining area of 3 m2 in
each plot provided seed yield, that was standardized to 14% humidity. At the end of the experiment, soil analysis showed 6 and 20 mg kg-1 of available P, respectively at P
1
and P2.
The following ratios and yield components were calcu-lated: root:shoot dry weight ratio, shoot N:P ratio (N content/P content), proportion of P in roots (root/total P content), pods per plant, seeds per pod, 100 seeds weight, harvest index (seed dry weight at maturity/shoot dry weight at third time of sampling), N harvest index (seed/shoot N content), P harvest index (seed/shoot P content). The homogeneity of variances of biomass data was verified by Hartleys test (Neter et al., 1990). For most of these traits, analysis of variance was performed on natural logarithmic (ln) transformed data in order to homogenize variances. Analysis of variance evaluated the main effects of factors (genotype, P level and time of sampling) and their interactions, considering sampling as sub-plots. For data of seed yield and yield components, analysis of variance evaluated the effects of genotype, phosphorus and their interaction.
RESULTS
The analysis of variance identified significant effects of genotype, phosphorus and time of sampling for almost all the traits of accumulation of biomass and nutrients, but the genotype x phosphorus interaction was not significant. The genotype x time interaction was in general significant, whereas the phosphorus x time interaction was significant for few traits. For most traits associated
to yield components, the effects of phosphorus and genotype were significant, but not the genotype x phosphorus interaction.
Biomass production and nutrient accumulation
Considering the average of the three samples, the higher P supply stimulated the vegetative growth of bean cultivars, increasing shoot dry weight (from 5.34 to 7.10 g plant-1), root dry weight (from 0.41 to
0.51 g plant-1), nodule dry weight (from 5.0 to
16.6 mg plant-1) and number of nodules (from 8.0 to
16.9 plant-1).
Patterns of biomass accumulation differed among cultivars. Goiano Precoce and Ouro Negro cultivars had significant increases in shoot dry weight after flowering, whereas in the other genotypes such in-creases were not significant (Fig. 1). Goiano Precoce,
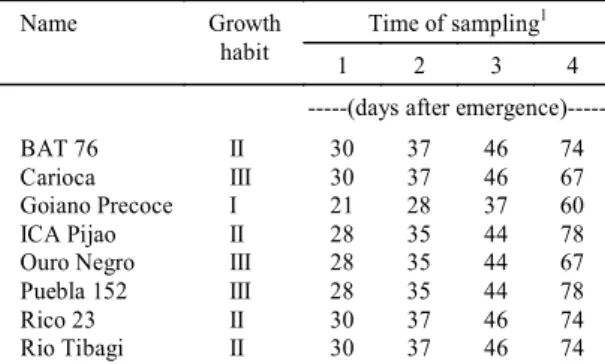
Name Growth Time of sampling1
habit 1 2 3 4
---(days after
emergence)---BAT 76 II 30 37 46 74
Carioca III 30 37 46 67
Goiano Precoce I 21 28 37 60
ICA Pijao II 28 35 44 78
Ouro Negro III 28 35 44 67
Puebla 152 III 28 35 44 78
Rico 23 II 30 37 46 74
R io Tibagi II 30 37 46 74
TABLE 1. Sampling time of bean cultivars.
11: third trifoliate fully expanded; 2: plentiful flowering; 3: beginning of
pod filling; 4: maturity.
1 10
BT CR GP IP ON PB RC RT
Sh
oo
t d
ry
w
ei
gh
t (
g
pl
an
t
-1)
BT CR GP IP ON PB RC RT
Cultivar
R
oo
t d
ry
w
ei
gh
t (
g
pl
an
t
-1)
Sample 1 Sample 2 Sample 3
1.0
0.1
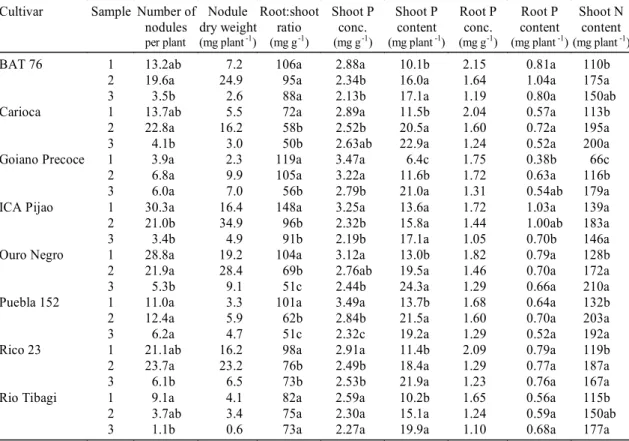
sampled about one week before the other cultivars, presented the lowest shoot dry weight at first and second samplings, but at third sampling it did not differ significantly from the others (Fig. 1). At first sampling ICA Pijao cultivar showed the greatest root dry weight and root:shoot ratio, demonstrating a vig-orous initial rooting (Fig. 1 and Table 2). BAT 76 and Rio Tibagi, unlike the other cultivars, kept similar root:shoot ratio with time (Table 2), indicating a stable pattern of carbon allocation between root and shoot.
All cultivars presented a reduction in the number of nodules after flowering, such effect being less intense in Goiano Precoce and Rio Tibagi, which showed poor nodulation (Table 2). At first sampling ICA Pijao and Ouro Negro cultivars had the greatest
number of nodules, but at second sampling Carioca and Rico 23 were superior (Table 2).
Ontogeny reduced continuously shoot and root P concentrations in every cultivar except Rio Tibagi, which maintained shoot P concentration almost stable with time (Table 2). Rio Tibagi cultivar pre-sented the smallest mean values of shoot and root P concentrations (Table 2), hence a lower internal P requirement. The reduction of shoot P concentra-tion with time was more intense at P1, whereas the
reduction of root P concentration was more intense at P2 (Table 3).
Shoot P content increased with time, more intensively before flowering than after flowering, but in ICA Pijao cultivar there was no significant differ-ence between samplings (Table 2). Rates of P
accu-Cultivar Sample Number of nodules
Nodule dry weight
Root:shoot ratio
Shoot P conc.
Shoot P content
Root P conc.
Root P content
Shoot N content
per plant (mg plant-1) (mg g-1) (mg g-1) (mg plant-1) (mg g-1) (mg plant-1) (mg plant-1)
BAT 76 1 13.2ab 7.2 106a 2.88a 10.1b 2.15 0.81a 110b
2 19.6a 24.9 95a 2.34b 16.0a 1.64 1.04a 175a
3 3.5b 2.6 88a 2.13b 17.1a 1.19 0.80a 150ab
Carioca 1 13.7ab 5.5 72a 2.89a 11.5b 2.04 0.57a 113b
2 22.8a 16.2 58b 2.52b 20.5a 1.60 0.72a 195a
3 4.1b 3.0 50b 2.63ab 22.9a 1.24 0.52a 200a
Goiano Precoce 1 3.9a 2.3 119a 3.47a 6.4c 1.75 0.38b 66c
2 6.8a 9.9 105a 3.22a 11.6b 1.72 0.63a 116b
3 6.0a 7.0 56b 2.79b 21.0a 1.31 0.54ab 179a
ICA Pijao 1 30.3a 16.4 148a 3.25a 13.6a 1.72 1.03a 139a
2 21.0b 34.9 96b 2.32b 15.8a 1.44 1.00ab 183a
3 3.4b 4.9 91b 2.19b 17.1a 1.05 0.70b 146a
Ouro Negro 1 28.8a 19.2 104a 3.12a 13.0b 1.82 0.79a 128b
2 21.9a 28.4 69b 2.76ab 19.5a 1.46 0.70a 172a
3 5.3b 9.1 51c 2.44b 24.3a 1.29 0.66a 210a
Puebla 152 1 11.0a 3.3 101a 3.49a 13.7b 1.68 0.64a 132b
2 12.4a 5.9 62b 2.84b 21.5a 1.60 0.70a 203a
3 6.2a 4.7 51c 2.32c 19.2a 1.29 0.52a 192a
Rico 23 1 21.1ab 16.2 98a 2.91a 11.4b 2.09 0.79a 119b
2 23.7a 23.2 76b 2.49b 18.4a 1.29 0.77a 187a
3 6.1b 6.5 73b 2.53b 21.9a 1.23 0.76a 167a
Rio Tibagi 1 9.1a 4.1 82a 2.59a 10.2b 1.65 0.56a 115b
2 3.7ab 3.4 75a 2.30a 15.1a 1.24 0.59a 150ab
3 1.1b 0.6 73a 2.27a 19.9a 1.10 0.68a 177a
TABLE 2.Nodulation, root:shoot dry weight ratio, N and P accumulation of bean cultivars at three times of sampling (means of two soil P levels)1.
1Data ln-transformed prior to analysis of variance; means followed by the same letter, within each cultivar, did not differ (Tukey test 5%); means without
mulation in roots were influenced by P supply. At P1,
root P content increased between first and second samplings and thereafter stabilized, whereas at P2 it
decreased after flowering (Table 3). Proportion of P in roots diminished continuously with time at P2, but
at P1 there was no significant reduction after
flower-ing (Table 3). The reduction in root P content after flowering was more intense in ICA Pijao cultivar, which presented a concomitant strong reduction in root P concentration (Table 2).
Shoot N concentration decreased with time at both P levels (Table 3). The higher P supply reduced shoot N concentration at first and second samplings, but not at third sampling (Table 3). In most of the culti-vars, shoot N content increased from the first to the second samplings, without significant increases af-ter flowering; yet in Goiano Precoce shoot N content increased after flowering, and in ICA Pijao there was no significant difference between samplings (Table 2).
Goiano Precoce had the lowest shoot P and N contents at first and second samplings, but it did not differ from the other cultivars at third sampling, when Ouro Negro was superior to all of them (Table 2). While at P2 shoot N:P ratio remained stable with
on-togeny, at P1 it decreased with time (Table 3),
indicat-ing that the lower P supply reduced the rates of N accumulation as compared with P absorption. Rates of N and P accumulation of each cultivar were similar (Table 2).
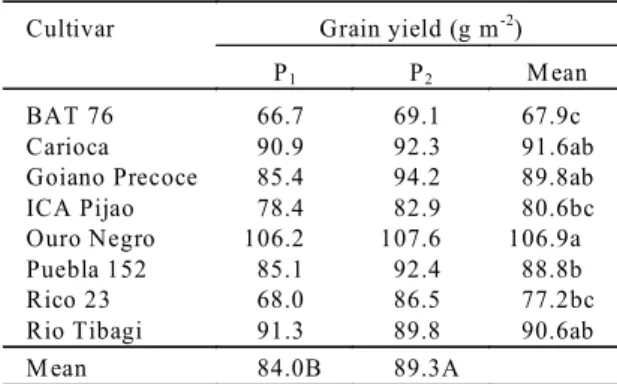
Grain yield
Regardless the significant effect of P levels on grain production, yield increased only 6% at P2
(Table 4). Ouro Negro Cultivar had the greatest mean yield, followed by Carioca, Rio Tibagi and Goiano Precoce (Table 4). The genotype × phosphorus in-teraction being not significant means that P supply did not affect the rank of cultivars for yield, and also indicates a low genotypic variability for P responses. However, it may be pointed out that whereas most of the cultivars presented increments of yield less than 10% at P2, Rico 23 had an increase of 27% (Table 4),
being more responsive to P. Genotypic differences in grain yield resulted from distinct combinations of yield components: Rio Tibagi showed the greatest number of pods per plant, Goiano Precoce, the high-est 100 seeds weight, while Ouro Negro and Carioca intermediate values of these components (Table 5).
At P2 seed N and P concentrations, and seed N
and P contents per unit of land area, were increased, but N and P harvest indexes decreased (Table 5). Goiano Precoce Cultivar showed the highest seed N and P concentrations, while Carioca and Ouro Negro had the lowest seed P concentration and Rio Tibagi the lowest seed N concentration (Table 5). The ge-notypic differences in harvest index and in N and P harvest indexes were not significant (Table 5), in part due to high coefficients of variation for these vari-ables. Values of N and P harvest indexes superior to 1.0 (Table 5) suggest that N and P accumulation con-tinued after the beginning of pod filling, particularly
Time of
sampling2 concentrationShoot P 3 concentrationRoot P 3 contentRoot P3 Proportion of Pin roots concentrationShoot N Shoot N: Pratio3
(mg g-1) (mg g-1) (mg plant-1) (mg g-1) (mg g-1) (g g-1)
P1 P2 P1 P2 P1 P2 P1 P2 P1 P2 P1 P2
1 2.62aB 3.53aA 1.45aB 2.28aA 0.46bB 0.94abA 56.8aA 59.8aA 33.8aA 31.3aB 13.1aA 9.0aB
2 2.39bB 2.81bA 1.20bB 1.79bA 0.54aB 1.00aA 39.4bB 48.6bA 27.3bA 25.1bB 11.6bA 9.1aB
3 2.19cB 2.63bA 1.09bB 1.33cA 0.52abB 0.78bA 34.0bA 31.4cA 20.7cA 21.7cA 9.7cA 8.4aB
Mean 2.40B 2.99A 1.25B 1.80A 0.50B 0.90A 43.4A 46.6A 27.3A 26.0A 11.4A 8.8B
TABLE 3.Shoot and root P concentrations, root P content, proportion of P in roots, shoot N concentration, and shoot N:P ratio, of common bean cultivars at three times of sampling and at two soil P levels (means of eight cultivars)1.
1Lowercase letters compare samples, and capital letters compare P levels; means followed by the same letter did not differ (Tukey test 5%);
P1: 12 kg ha-1 of P; P
2: 50 kg ha-1 of P.
under low P supply. ICA Pijao and Puebla 152, culti-vars with latest maturity (Table 1), presented the greatest N and P harvest indexes (Table 5), indicat-ing that the third samplindicat-ing did not represent the maxi-mal growth of them. It seems that an additional sam-pling, at the end of pod filling, should have been done to ensure the stage of maximal biomass pro-duction of the cultivars.
DISCUSSION
The cultivars evaluated have different growth habits and days to maturity (Table 1), and were previously selected as contrasting in regard to some traits associated with efficiency of P absorption and utilization (Araújo, 1996). Notwithstanding, the non significance of genotype × phosphorus interaction indicates a relatively similar growth pattern of each cultivar at both P levels, and a narrow genotypic variability of P responses under field conditions (Haag et al., 1978; Informe ..., 1986).
Carioca and Rio Tibagi cultivars have been used as controls of adequate yield under low P supply (Informe ..., 1985, 1986; Yan et al., 1995a), and con-firmed such efficiency. Goiano Precoce, despite its lower initial biomass and nutrient accumulation (Fig. 1 and Table 2), yielded as much grain as the best cultivars (Table 4), demonstrating a rapid trans-location of assimilates to grain. Carioca and Ouro Negro, the most grain yielding cultivars, presented
the lowest seed P concentrations, suggesting a rela-tionship between productivity and P utilization by grain. More efficient P utilization should be achieved by genotypes which retain P in the vegetative tis-sues, maintaining the rate and duration of photo-synthesis and minimizing grain P concentration (Batten, 1986).
Linear regressions obtained by covariance indi-cated significant correlation between grain yield and number of pods per plant (r = 0.378, P < 0.001) and 100 seeds weight (r = 0.538, P < 0.001). Pods per plant is one of the yield components most affected by P deficiency, explaining the superiority of efficient lines under low P (Informe ..., 1986), and it has a predomi-nant influence on yield either at low or high fertility levels (Haag et al., 1978). Rio Tibagi Cultivar had the greatest number of pods per plant, and also a relatively high grain yield at both P levels (Tables 4 and 5), confirming the importance of this component under low P. However, seed weight also contributed, since Ouro Negro and Carioca, the most grain yielding cultivars, brought together intermediate values of pods per plant and 100 seeds weight (Table 5).
The genotypic differences observed in the patterns of root production may be useful for nutritional breeding programs, since growth and P accumulation of bean in low P soils were associated to larger root dry weight and root:shoot ratio (Yan et al., 1995b). ICA Pijao, Ouro Negro and Puebla 152 cultivars showed a vigorous initial root growth (Fig. 1), that can be advantageous under conditions of low soil fertility or low soil moisture. Bean root growth is heritable, which makes possible the selec-tion of plants with larger root system (Fawole et al., 1982). However, the significance of genotype x time interaction may compromise the usefulness of these traits as selection criteria, unless some physiological basis can be established for selection at specific points in crop development (Lynch & Beem, 1993).
Under low P supply roots retained more P after flowering, whereas the high P supply stimulated the translocation of P from roots to shoots, since root P concentration and content, and also proportion of P in roots, decreased after flowering at P2 unlike at P1
(Table 3). A large proportion of P on bean plants was initially invested in roots, and this allocation
de-Cultivar Grain yield (g m-2)
P1 P2 M ean
BAT 76 66.7 69.1 67.9c
Carioca 90.9 92.3 91.6ab
Goiano Precoce 85.4 94.2 89.8ab
ICA Pijao 78.4 82.9 80.6bc
Ouro Negro 106.2 107.6 106.9a
Puebla 152 85.1 92.4 88.8b
Rico 23 68.0 86.5 77.2bc
Rio Tibagi 91.3 89.8 90.6ab
M ean 84.0B 89.3A
TABLE 4.Grain yield of common bean cultivars at two soil P levels (means of 4 replicates)1.
1Lowercase letters compare cultivars, and capital letters compare P levels;
means followed by the same letter did not differ (Tukey test 5%); P1: 12 kg ha-1 of P; P
creased with time, more intensively in plants under high than under low P supply (Snapp & Lynch, 1996). In addition, P harvest index superior to 1.0 at P1
(Table 5) indicates that P accumulation persisted af-ter early pod filling, when the third sampling was done. Bean roots under low P did not remobilize P or senesce with ontogeny, suggesting that retention of P in roots may allow nutrient and water uptake late in ontogeny (Snapp & Lynch, 1996). Therefore, the main-tenance of P absorption at late growth stages may be an important factor on establishment of bean crop under low soil fertility.
Relationships between seed yield and data of bio-mass and nutrient accumulation were difficult to es-tablish, since linear regressions were not significant. The responses of vegetative growth to the higher P supply did not reflect with the same magnitude on yield. Whereas shoot dry weight increased 33% at P2 (mean of three samples), seed yield increased only
6% (Table 4). The lower harvest index at P2 (Table 5)
suggests that the cultivars did not fully express their yield potential, and yield was also limited by another factor than P supply.
Silveira & Moreira (1990) observed that P response of bean yield was small under a water level of 204 mm in an Oxisol, but there was no evidence of a water deficit during the experiment. Nodule number and weight were inferior to values verified in the same cultivars in a pot experiment (Araújo, 1996). In
addi-tion, the reduced nodulation after flowering indicates a process of nodule senescence, noticed in every genotype but at different degrees (Table 2). With the onset of bean pod filling, competition for photosyn-thates between nodules and pods becomes impor-tant, thus reducing nodule growth and activity (Piha & Munns, 1987). Nodule initiation and complete nod-ule development can be restricted in parts of bean root system at pod filling (Vikman & Vessey, 1993).
Maximum bean uptake of mineral N was observed in the period of 15 days between flowering and mid-pod filling (Hungria & Neves, 1987), and alloca-tion of N to seed dominates the reproductive N bud-get of common bean (Lynch & White, 1992). The intense nodule senescence observed could have less-ened N2 fixation during a stage of high N demand,
and the crop requirement was likely to be not satis-fied by the symbiosis. Leaf N concentrations at flow-ering below 30 and 47 mg g-1, respectively by critical
nutrient level and by diagnosis and recommenda-tion integrated system criteria, predicted significant responses of bean yields to applied N (Wortmann et al., 1992). Hence, shoot N concentration at second sampling confirms a sub-optimal N supply at both P levels (Table 3). The poor N2 fixation after flowering
could have limited the expression of the yield poten-tial and the efficiency of P use, justifying in part the lack of significance of genotype x phosphorus inter-action for measured traits. The low number of pods
Treatment Pods per
plant
Seeds per pod
100 seeds dry weight
Harvest
index2 Seed Pconc. contentSeed P P harvestindex2 Seed Nconc. contentSeed N N harvestindex2
(g) (g g-1) (mg g-1) (mg m-2) (g g-1) (mg g-1) (g m-2) (g g-1)
BAT 76 3.96c 4.32b 16.4f 0.40a 5.44ab 368d 1.08a 40.2ab 2.74c 0.93a
Carioca 4.15bc 4.39b 20.7d 0.47a 4.70c 427bcd 0.89a 38.5ab 3.53abc 0.81a
Goiano Precoce 4.90abc 2.53d 29.5a 0.51a 5.64a 505ab 1.15a 41.0a 3.71ab 0.96a
ICA Pijao 4.45abc 4.54ab 18.0ef 0.48a 4.95abc 399cd 1.35a 37.0ab 2.99bc 1.04a
Ouro Negro 4.81abc 4.29b 22.7c 0.46a 4.84bc 516a 0.98a 37.2ab 3.98a 0.86a
Puebla 152 5.19ab 3.30c 24.8b 0.47a 5.09abc 449abcd 1.22a 37.8ab 3.35abc 0.91a
Rico 23 4.20bc 4.73a 18.9e 0.42a 5.03abc 388cd 0.88a 38.3ab 2.96bc 0.87a
Rio Tibagi 5.54a 4.42ab 16.2f 0.45a 5.04abc 454abc 1.15a 36.3b 3.28abc 0.91a
12 kg ha-1 of P 4.53A 3.99B 20.7B 0.50A 4.89B 408B 1.28A 37.2B 3.12B 1.00A
50 kg ha-1 of P 4.77A 4.14A 21.2A 0.41B 5.29A 468A 0.90B 39.4A 3.51A 0.82B
TABLE 5.Yield components, seed P concentration and content, seed N concentration and content, and N and P harvest indexes of bean cultivars at two soil P levels1.
per plant (Table 5), as compared to Informe ... (1986) or Youngdahl (1990), also confirms some restriction to seed yield.
According to Adams (1967), in selection for ge-netic merit of some character, it should be sought to remove the constraints of limited input to permit the full expression of whatever genes were involved in such component. Therefore, the identification of bean genotypes tolerant to low P soils and efficient in N2
fixation can be difficult (Graham & Rosas, 1979), due to constraints to growth and yield caused by an in-efficient symbiosis, which can be confounded with a small genotypic adaptation to low P. However, towards efforts for obtaining bean cultivars more productive under conditions of low inputs in a sustainable agriculture, the challenge of making compatible P efficiency and biological N2 fixation
must be faced.
CONCLUSIONS
1. The bean cultivars present different patterns of biomass production and of N and P accumulation, particularly on root system.
2. The responses of vegetative growth to the higher P supply do not reflect with the same magnitude on seed yield.
3. A sub-optimal supply of N may limit the expression of the yield potential of cultivars, reducing the genotypic variability of responses to P levels.
REFERENCES
ADAMS, M.W. Basis of yield component compensation in crop plants with special reference to the field bean, Phaseolus vulgaris. Crop Science, Madison, v.7, p.505-510, 1967.
ARAÚJO, A.P. Eficiência de absorção e utilização de fósforo em genótipos de feijoeiro (Phaseolus vulgaris L.) sob fixação biológica de nitrogênio.
Seropédica : UFRRJ, 1996. 341p. Tese de Doutorado. BARBOSA FILHO, M.P.; SILVA, O.F. Aspectos agro-econômicos da calagem e da adubação nas culturas de arroz e feijão irrigados por aspersão.
Pesquisa Agropecuária Brasileira, Brasília, v.29,
n.11, p.1657-1667, nov. 1994.
BATTEN, G.D. The uptake and utilization of phospho-rus and nitrogen by diploid, tetraploid and hexaploid wheats (Triticum spp.). Annals of Botany, London,
v.58, n.1, p.49-59, 1986.
EMBRAPA. Serviço Nacional de Levantamento e Conservação de Solos (Rio de Janeiro, RJ). Manual de métodos de análise de solo. Rio de Janeiro,
1979. Não paginado.
FAWOLE, I.; GABELMAN, W.H.; GERLOFF, G.C. Genetic control of root development in beans (Phaseolus vulgaris L.) grown under phosphorus stress. American Society for Horticultural Sci-ence. Journal, Alexandria, v.107, n.1, p.98-100, 1982.
FERNÁNDEZ, F.; GEPTS, P.; LÓPEZ, M. Etapas de desarrollo en la planta de frijol. In: LÓPEZ, M.; FERNÁNDEZ, F.; SCHOONHOVEN, A. van. (Eds.). Frijol: investigación y producción. Cali :
CIAT, 1985. p.61-78.
GRAHAM, P.H.; ROSAS, J.C. Phosphorus fertilization and symbiotic nitrogen fixation in common bean.
Agronomy Journal, Madison, v.71, n.6, p.925-926, 1979.
HAAG, W.L.; ADAMS, M.W.; WIERSMA, J.V. Differ-ential responses of dry bean genotypes to N and P fertilization of a Central American soil. Agronomy Journal, Madison, v.70, n.4, p.565-568, 1978. HUNGRIA, M.; NEVES, M.C.P. Partitioning of nitrogen
from biological fixation and fertilizer in Phaseolus vulgaris. Physiologia Plantarum, Copenhagen,
v.69, n.1, p.55-63, 1987.
INFORME ANUAL DEL PROGRAMA DE FRIJOL. Cali : CIAT, 1985. 372p.
INFORME ANUAL DEL PROGRAMA DE FRIJOL. Cali : CIAT, 1986. 341p.
LYNCH, J.; BEEM, J.J. Growth and architecture of seed-ling roots of common bean genotypes. Crop Sci-ence, Madison, v.33, n.6, p.1253-1257, 1993. LYNCH, J.; WHITE, J.W. Shoot nitrogen dynamics in
tropical common bean. Crop Science, Madison, v.32,
n.2, p.392-397, 1992.
NETER, J.; WASSERMAN, W.; KUTNER, M.H. Ap-plied linear statistical models. 3.ed. Burr Ridge :
OLIVEIRA, A.J.; LOURENÇO, S.; GOEDERT, W.J. (Eds.). Adubação fosfatada no Brasil. Brasília :
Embrapa-DID, 1982. 326p. (Embrapa-DID. Documentos, 21).
OLIVEIRA, I.P.; THUNG, M.; KLUTHCOUSKI, J.; AIDAR, H.; CARVALHO, J.R.P. Avaliação de cultivares de feijão quanto à eficiência no uso de fósforo. Pesquisa Agropecuária Brasileira, Brasília, v.22, n.1, p.39-45, jan. 1987.
PEREIRA, P.A.A.; BLISS, F.A. Selection of common bean (Phaseolus vulgaris L.) for N2 fixation at different levels of available phosphorus under field and envi-ronmentally-controlled conditions. Plant and Soil,
Dordrecht, v.115, n.1, p.75-82, 1989.
PIHA, M.I.; MUNNS, D.N. Nitrogen fixation potential of beans (Phaseolus vulgaris L.) compared with other grain legumes under controlled conditions. Plant and Soil, Dordrecht, v.98, n.2, p.169-182, 1987.
SÁNCHEZ, P.A.; SALINAS, J.G. Low-input technology for managing Oxisols and Ultisols in Tropical America. Advances in Agronomy, San Diego, v.34, p.279-406, 1981.
SILVEIRA, P.M.; MOREIRA, J.A.A. Resposta do feijoeiro a doses de fósforo e lâminas de água de irrigação. Revista Brasileira de Ciência do Solo,
Campinas, v.14, n.1, p.63-67, 1990.
SNAPP, S.S.; LYNCH, J.P. Phosphorus distribution and remobilization in bean plants as influenced by
phos-phorus nutrition. Crop Science, Madison, v.36, n.4,
p.929-935, 1996.
VIKMAN, P.A.; VESSEY, J.K. Ontogenetic changes in root nodule subpopulations of common bean (Phaseolus vulgaris L.). III. Nodule formation, growth and degradation. Journal of Experimental Botany, Oxford, v.44, n.260, p.579-586, 1993. WALLACE, D.H.; OZBUN, J.L.; MUNGER, H.M.
Physiological genetics of crop yield. Advances in Agronomy, San Diego, v.24, p.97-146, 1972. WORTMANN, C.S.; KISAKYE, J.; EDJE, O.T. The
di-agnosis and recommendation integrated system for dry bean: Determination and validation of norms.
Journal of Plant Nutrition, New York, v.15, n.11, p.2369-2379, 1992.
YAN, X.; BEEBE, S.E.; LYNCH, J.P. Genetic variation for phosphorus efficiency of common bean in con-trasting soil types. II. Yield response. Crop Sci-ence, Madison, v.35, n.4, p.1094-1099, 1995a. YAN, X.; LYNCH, J.P.; BEEBE, S.E. Genetic variation