Original
Received 2/8/2010 Accepted 17/4/2012 (004948)
1 Departament of Food Engineering, Faculty of Food Engineering, University of Campinas – UNICAMP, CP 6121, CEP 13083-862, Campinas, SP, Brazil, e-mail: rosiane@fea.unicamp.br
*Corresponding author
Soursop juice stabilized with soy fractions: a rheologial approach
Suco de graviola estabilizado com frações de soja: uma avaliação reológica
Luiz Henrique FASOLIN1, Rosiane Lopes da CUNHA1*
1 Introduction
The incorporation of tropical fruits in soy-based drinks is a way of exploring exotic flavors and widening their consumption since these beverages unite the nutritional and sensory characteristics of the fruit with the functional properties of the soybean. Soybeans are rich in protein, and they are widely used as raw material to produce a number of soy-based products such as soymilk, tofu, miso, and soy sauce (VILLARES et al., 2010). Soy beverages contain 1.5 to 3.0% of soy protein (PAULSEN; WELSBY; HUANG, 2006), which has one of the best essential amino acid sequences of all plant proteins (LIU, 1997). In addition to their nutritional qualities, these proteins have interesting functional properties such as high solubility, water and fat adsorption, emulsion stabilization, and gelling ability. Therefore, soy proteins have a wide range of applications in the food industry including the production of processed meat, infant formulas, and nutritional beverages and as dairy product replacement (CHOVE; GRANDISON; LEWIS, 2007).
Soursop (Annona muricata L.) is a native plant to tropical
regions of South and Central America and is appreciated for
its succulent pulp, which has a pleasant aroma and distinct sub acid flavor (AQUARONE; MENEGALLI; RODRIGUES, 1996; GRATÃO; SILVEIRA JUNIOR; TELIS-ROMERO, 2007; TELIS-ROMERO et al., 2007). Its pulp is widely used in the production of various blends of juices, syrups, nectars, jams and ice creams, and it is also a raw material for fruit powders and bars (GRATÃO; SILVEIRA JUNIOR; TELIS-ROMERO,
2007; TELIS-ROMERO et al., 2007).Soursop juice presents a
large amount of insoluble material, which tends to precipitate leading to phase separation after a determined storage time (GENOVESE; ELUSTONDO; LOZANO, 1997). The addition of protein to soursop juice may worsen this problem, considering that under acidic conditions the protein may also precipitate (AGUILERA; RADEMARCHER, 2004).
Rheological changes in continuous phase can lead to greater stability of the suspension for longer periods of time due to the retention of suspended particles. The addition of hydrocolloids increases the viscosity of a continuous medium, but it also leads to ionization of the particles that can then repel each other
Resumo
O uso do polissacarídeo solúvel de soja (PSSS) como estabilizante em bebidas ácidas foi avaliado por meio de estudos reológicos e de estabilidade. Com esse intuito, bebidas à base de soja foram formuladas com suco de graviola, em função da baixa estabilidade deste tipo de dispersão. A influência das concentrações de PSSS, cloreto de cálcio (CaCl2) e isolado proteico de soja (IPS) na estabilidade e na reologia do suco de graviola foi avaliada por meio de planejamento experimental. As interações entre as concentrações de PSSS e IPS exerceram um efeito positivo na viscosidade máxima newtoniana (taxa de deformação igual a 0 s–1). A estabilidade foi influenciada positivamente pelas
concentrações de PSSS e IPS, mas as interações entre IPS e CaCl2 também desempenharam um papel importante no índice de sedimentação. Esses resultados sugerem que o PSSS é um polissacarídeo efetivo na estabilização de fibras e proteínas em suspensões ácidas em razão do aumento da viscosidade e do efeito estérico causado pela formação de complexos entre PSSS e IPS.
Palavras-chave:polissacarídeo solúvel de soja; bebidas à base de soja; graviola; reologia; estabilidade. Abstract
The potential use of soybean soluble polysaccharide (SSPS) as a stabilizer in acidic beverages was evaluated using rheological and stability studies. For this purpose, soy-based beverages were formulated with soy protein isolate (SPI) and soursop juice due to the low stability of this kind of dispersion. The influences of the concentrations of soybean soluble polysaccharide, calcium chloride, and soy protein isolate on the stability and rheology of soursop juice were evaluated using a factorial experimental design. Interactions between the concentrations of soybean soluble polysaccharide and soy protein isolate exerted a positive effect on the maximum Newtonian viscosity. The stability was positively influenced by the soybean soluble polysaccharide and soy protein isolate concentrations, but the interactions between soy protein isolate and CaCl2 also affected the sedimentation index. These results suggest that soybean soluble polysaccharide is effective in stabilizing fibers and proteins in acidic suspensions due to the increase in viscosity and steric effect caused by the formation of complexes between the soybean soluble polysaccharide and soy protein isolate.
Keywords:soybean soluble polysaccharide; soy-based beverages; soursop; rheology; stability.
OI:
Preparation of soy ingredients
An aqueous solution (ten liters) of defatted soy flour (1:10 w/w) was stirred for 2 hours while maintaining the pH at 8.0 by the addition of 2 M NaOH at room temperature. The solution was then centrifuged (10,000 × g, 30 minutes, 4 °C) in a Beckman Coulter benchtop centrifuge (Model Allegra 25R, USA). The precipitate was used to prepare the SSPS (FURUTA et al., 1998), while the supernatant contained the soy protein (HUA; CHUI; WANG, 2003).
Preparation of soy protein isolate (SPI)
The pH of the supernatant obtained was adjusted to the isoelectric point of the soy proteins (pH 4.5) using 5 M HCl at room temperature. This solution was also centrifuged (5,000 × g, 15 minutes, 4 °C) and the precipitated protein was resuspended in water adjusting the pH to 7.0 with 2 M NaOH (HUA; CHUI; WANG, 2003). This material was then freeze-dried (–53 °C and vacuum). The protein, moisture, and ash contents of the SPI powder were 87.8%, 8.1%, and 3.5%, respectively (0.02% Calcium, 1.13% Sodium, 0.06% Potassium) (wet basis).
Preparation of soybean soluble polysaccharide (SSPS)
The SSPS was extracted using a modification of the methodology described by Furuta et al. (1998). The precipitate obtained in alkaline conditions was resuspended in water (5.0% w/v), the pH adjusted to 2.0 with 12 M HCl and the solution heated at 80 °C for 3 hours in a water bath. After cooling to room temperature, the suspension was centrifuged (10,000 × g, 20 minutes, 4 °C) to remove the insoluble material. An equal volume of 90% ethanol (v/v) was added to the supernatant, and this solution was centrifuged (10,000 × g, 15 minutes, 4 °C). The precipitate was resuspended in water, neutralized with 5 M NaOH, and spray-dried (0.4 L/hours; 120 °C). The composition and mean molecular weight of SSPS are shown in Table 2.
2.2 Beverages preparation
In the first step, the concentration of only one biopolymer (SPI or SSPS) (0 to 5% w/w) was measure determining its effect on the rheological properties and stability of the soursop juice (1:2 v/v, pulp:water ratio). In the second step, the
simultaneous influence of the concentrations of SPI, CaCl2,
(GENOVESE; LOZANO, 2001). Pectin, or its combination with alginate or xanthan, is widely used as a protein stabilizer in soy beverages (EDGEBERT, 2004), but new sources of protein stabilizer have been studied; amongst these hydrocolloids, the polysaccharides obtained from soybeans could be an interesting alternative, especially for soy beverages.
Soybean soluble polysaccharides (SSPS) are hydrocolloids rich in soluble fibers, which are obtained from the soybean cotyledon residue after oil and protein extraction. SSPS is an acidic polysaccharide whose main structure consists of homogalacturonan and rhamnogalacturonan with branched
chains of b-1,4-galactans and a-1,3 - or a-1,5-arabinan
(LIU et al., 2008; NAKAMURA et al., 2001, 2004a). In addition, like pectin, it contains a large amount of galacturonic acid and a protein fraction like arabic gum (Accacia senegal) suggesting that SSPS could present emulsifying properties similar to those of these polysaccharides (NAKAMURA et al., 2004a, b).
It has been suggested that SSPS could be used in flavored emulsions because of its high water solubility, low bulk viscosity, high temperature stability, emulsifying properties, and its ability to form strong interfacial films (FURUTA et al., 1998; FURUTA; MAEDA, 1999; NAKAMURA et al., 2004a). Nevertheless, despite the evidence that this polysaccharide has interesting technological properties, no studies were found in the literature concerning its potential behavior as a suspension stabilizer, especially with respect to fruit-based soy beverages, which show a low pH, addition of protein, and large-sized insoluble particles. Thus the aim of this study was to evaluate the effect of the addition of SSPS and its concentration on the rheology and stability of soy beverages prepared with soursop juice and soy protein isolate (SPI).
2 Materials and methods
2.1 Materials
Defatted soy flour used for extraction of the materials (soy soluble polysaccharide and soy protein isolate) was purchased from Solae do Brasil (Esteio, RS, Brazil), while the frozen soursop pulp used for the preparation of the beverages was kindly provided by Demarchi – Indústria e Comércio de Frutas Ltda. (Jundiaí, SP, Brazil). The composition of the soursop pulp is
shown in Table 1. Potassium sorbate (C6H7O2K) was purchased
from Sigma Chemical Co. (St Louis, MO, USA).
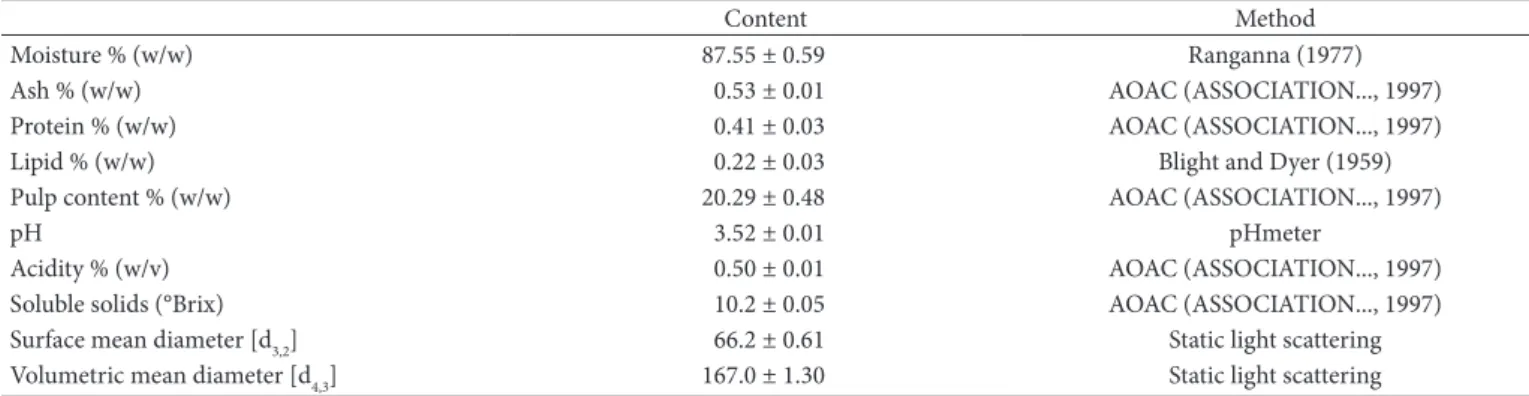
Table 1. Proximate composition of soursop pulp and methods used.
Content Method
Moisture % (w/w) 87.55 ± 0.59 Ranganna (1977)
Ash % (w/w) 0.53 ± 0.01 AOAC (ASSOCIATION..., 1997)
Protein % (w/w) 0.41 ± 0.03 AOAC (ASSOCIATION..., 1997)
Lipid % (w/w) 0.22 ± 0.03 Blight and Dyer (1959)
Pulp content % (w/w) 20.29 ± 0.48 AOAC (ASSOCIATION..., 1997)
pH 3.52 ± 0.01 pHmeter
Acidity % (w/v) 0.50 ± 0.01 AOAC (ASSOCIATION..., 1997)
Soluble solids (°Brix) 10.2 ± 0.05 AOAC (ASSOCIATION..., 1997)
Surface mean diameter [d3,2] 66.2 ± 0.61 Static light scattering
2.4 Rheological measurements
The rheological measurements were made using a stress-controlled rheometer (Carri-Med CSL2 500, TA Instruments, England) at 25 °C in triplicate. The flow curves were obtained by a stepped ramp with an up-down-up step program using different shear stress ranges for each sample in order to obtain
a maximum shear rate value of 300 s–1. The measurements were
made using a 4.0 cm diameter-plate with cross-hatched surface
and a gap of 2000 mm between the plates. The flow curves were
fitted to different rheological equations: Power Law and Cross equations (Equation 3) (STEEFE, 1996).
0
( )
1 ( )m
h h
h h tγ
∞
∞ −
= +
+ (3)
where h is the apparent viscosity; h∞ the infinite-shear rate
viscosity (upper Newtonian plateau); ho the maximum
Newtonian viscosity (lower Newtonian plateau), t the
relaxation time (s), and m the dimensionless power index of the Cross equation. A value of zero for m indicates Newtonian behaviour with m tending to unity for increasingly shear
thinning behaviour. The value for h∞ can be obtained from the
experimental results corresponding to the equilibrium viscosity obtained at the end of shearing. The other terms can be obtained with a non-linear regression estimating the parameters of the Cross equation. With the viscosity values obtained from the raw data, the viscosity at 50 s–1 was also analyzed. This viscosity value
was chosen because this shear rate could be related to mouthfeel, which is important since the rheological changes can not alter the feelings during consumption.
2.5 Statistical analysis
The results of the experimental design were analyzed using the software Statistica 5.0 (Statisoft Inc., Tulsa USA) allowing for the description of the behavior of the responses according to
a second-order polynomial equation (RODRIGUES; IEMMA,
2005) with the variables used in this study(Equation 4)
= + + + + + +
+ × + × + ×
2 2
0 1 2 3 11 22
2
33 12 13 23
y b b SSPS b SPI b Ca b SSPS b SPI
b Ca b SSPS SPI b SSPS Ca b SPI Ca
(4)
and SSPS (independent variables) on the rheology and stability of the soursop juice was evaluated using a central composite rotatable design (RODRIGUES; IEMMA, 2005). The design included eight factorial points, six axial points, and three central points, totalizing 17 formulations. The range and levels of the variables studied are shown in Table 3.
The mixture of ingredients was prepared firstly by hydrating the soy protein in 200 mL of distilled water until complete dissolution using a magnetic stirrer at room temperature. The concentrated soursop pulp (100 mL) and the different concentrations of polysaccharide and calcium chloride were then added in order to obtain the formulations established by the factorial design. Finally, potassium sorbate (0.1% w/v) was added to preserve the integrity of the samples during the analysis (POTTER et al., 2007).
2.3 Stability test
Each solution was placed in a 25 mL graduated cylinder (1.6 mm diameter) immediately after the preparation to measure the volume of phase separation thus determining the stability to sedimentation of the soursop juice and the formulated beverages. The analyses were carried out in triplicate at room temperature, and the phase volume was evaluated during a period of up to one week in order to reach phase equilibrium. Phase separation was observed visually, and the sedimentation index (IS%) was calculated using Equation 1.
0
( ( ) / ) 100
IS= H t H × (1)
where H(t) is the upper phase height at the interface after a time t and H0 the initial height.
The influence of the compositions of the formulations on the sedimentation process was analyzed using a first-order kinetics equation (Equation 2)
(1 vt)
eq
IS=IS −e− (2)
where ISeq is the sediment volume at equilibrium, t the time,
and v the sedimentation rate in h–1.
Table 2. Composition of SSPS extracted at 80 °C and pH 2.0.
Content Method
Moisture (% w/w) 0.5 ± 0.002 AOAC (ASSOCIATION..., 1997)
Ash (% w/w) 5.0 ± 0.01 AOAC (ASSOCIATION..., 1997)
Protein (% w/w) 35 ± 1.32 AOAC (ASSOCIATION..., 1997)
Fat content (% w/w) - Blight and Dyer (1959)
Carbohydrates (% w/w) 55.5 ± 1.60 By difference
Magnesium (% w/w) 0.199 ± 0.001 Arienzo and Capasso (2000)
Calcium (% w/w) 0.777 ± 0.001 Arienzo and Capasso (2000)
Potassium (% m/w) 0.162 ± 0.001 Arienzo and Capasso (2000)
Sodium (% w/w) 4.231 ± 0.01 Arienzo and Capasso (2000)
suspension. The hydrodynamic action that caused this layering gradually disrupts it at higher shear rates resulting in a random three-dimensional arrangement (BARNES, 1989).
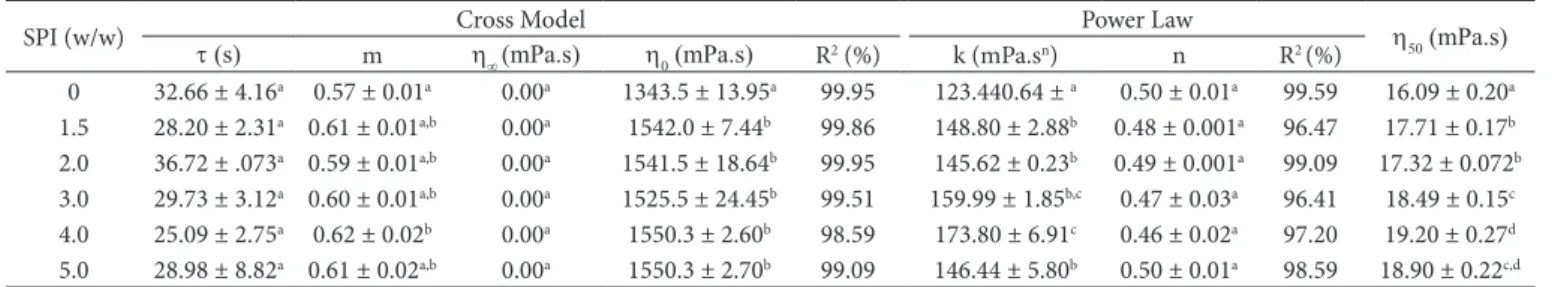
For all formulations shown in Table 4, the rheological parameters obtained from the Cross and power law models
fitted well up to a value of 200 s–1 (Figure 1). For the Cross
model, the parameter m showed increasing pseudoplasticity with increasing SPI concentration (closer to unity), but the flow index (n) was not affected by the addition of protein. The consistency index (k) tended to increase with increasing protein concentration, but significant differences in the
relaxation time (t) were not observed. The apparent viscosity at
50 s–1 (h
50) also increased with increasing protein concentration.
In addition, the maximum Newtonian viscosity (h0) obtained
from the Cross model (Equation 3) was higher for the samples with added SPI than with the pure soursop juice, but it was not affected by the SPI concentration.
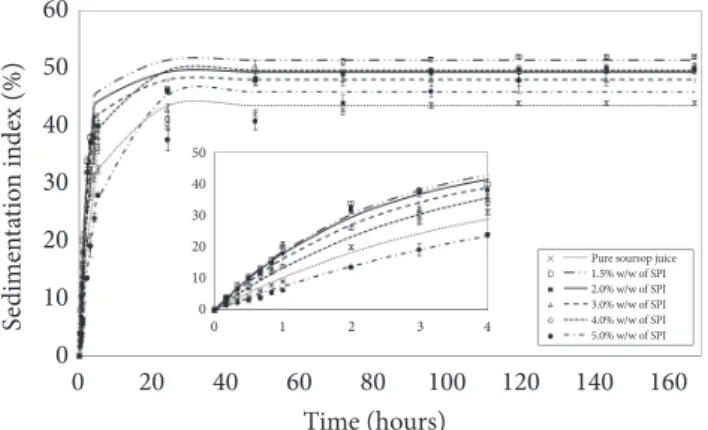
Figure 2 shows the results obtained for the sedimentation index of the soursop juice with added SPI during seven days of observation. After seven days, the sedimentation index (IS) of the pure soursop juice was lower than that of the beverages with added SPI. However, all systems showed high sedimentation indexes demonstrating the important role of the insoluble fruit particles in the destabilization of these beverages.
The increase in sediment volume (ISeq) with increasing SPI
addition (Table 5) could be due to the acidic pH of the soursop juice (around 4.0), which is close to the isoelectric point of the where y is the response calculated by the model, SPI, SSPS,
and Ca are the coded protein, polysaccharide, and calcium chloride concentrations, respectively, and bi, bii, and bij are the coefficients estimated by the model representing the linear and quadratic effects and the interaction between the two factors of the response, respectively.
The responses analyzed were the stability results, rheological
parameters of Equation 3, and the viscosity values at 50 s–1
(h50). The analysis of variance (ANOVA) was used to verify
the regression significance, and the proportion of variance explained by the fitted model was given by the coefficient of
determination (R2).
3 Results and discussion
3.1 Soursop juice and SPI formulations
The flow curves obtained with the soursop juice and SPI formulations (Figure 1) showed similar behaviors. The pure soursop juice showed lower values for shear stress, which increased with increasing protein concentration. All curves
clearly showed shear thinning behavior (up to 180 s–1), followed
by a small linear range and then shear thickening behavior (above 200 s–1).
At lower shear rates, water has a lubricating effect between the particles and the flow is relatively unhindered causing shear-thinning behavior (STEFFE, 1996). However, at higher shear rates, there is increased resistance viscosity caused by particle interaction by way of clustering and/or physical contact (STEFFE, 1996; HOFFMAN, 1998). This is probably due to the transition from a two – to a three-dimensional spatial arrangement of the particles. The original two-dimensional arrangement is brought about by the flow itself, rearranging the particles into closely packed sheets flowing over each other. This layered arrangement gives the lowest possible viscosity to the
Figure 1. Rheological curves for pure soursop juice and beverages formulated with the addition of soy protein isolate.
Table 4. Rheological parameters of the soursop juice with added SPI.
SPI (w/w) Cross Model Power Law h50 (mPa.s)
t (s) m h∞ (mPa.s) h0 (mPa.s) R2 (%) k (mPa.sn) n R2 (%)
0 32.66 ± 4.16a 0.57 ± 0.01a 0.00a 1343.5 ± 13.95a 99.95 123.440.64 ± a 0.50 ± 0.01a 99.59 16.09 ± 0.20a
1.5 28.20 ± 2.31a 0.61 ± 0.01a,b 0.00a 1542.0 ± 7.44b 99.86 148.80 ± 2.88b 0.48 ± 0.001a 96.47 17.71 ± 0.17b
2.0 36.72 ± .073a 0.59 ± 0.01a,b 0.00a 1541.5 ± 18.64b 99.95 145.62 ± 0.23b 0.49 ± 0.001a 99.09 17.32 ± 0.072b
3.0 29.73 ± 3.12a 0.60 ± 0.01a,b 0.00a 1525.5 ± 24.45b 99.51 159.99 ± 1.85b,c 0.47 ± 0.03a 96.41 18.49 ± 0.15c
4.0 25.09 ± 2.75a 0.62 ± 0.02b 0.00a 1550.3 ± 2.60b 98.59 173.80 ± 6.91c 0.46 ± 0.02a 97.20 19.20 ± 0.27d
5.0 28.98 ± 8.82a 0.61 ± 0.02a,b 0.00a 1550.3 ± 2.70b 99.09 146.44 ± 5.80b 0.50 ± 0.01a 98.59 18.90 ± 0.22c,d
Different letters in the same column indicate a significant difference (p < 0.05). Table 3. Coded and uncoded values of the independent variables used to prepare the soy beverages with soursop juice.
Independent variables
Levels
–1.68 –1 0 +1 +1.68
SSPS concentration (w/w) 1.0 1.59 3.0 4.42 5.0 SPI concentration (w/w) 1.0 1.59 3.0 4.42 5.0
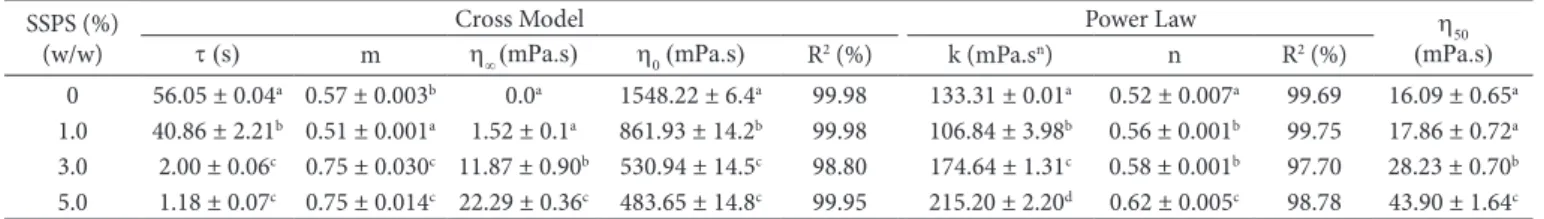
The Cross model showed the best fit with higher values for
R2 than those obtained with the power law model (Table 6). Pure
soursop juice showed more pronounced pseudoplasticity, and the flow index (n) increased with increasing SSPS. An inverse behavior was observed for the values of the parameter m of the Cross model, since “1-m” is related to n. The infinity and zero shear rate viscosities were in agreement with the increase in the flow index since they were closer to each other with the addition of SSPS. The relaxation time and consistency index also presented inverse behavior since the relaxation time decreased and k tended to increase with increasing SSPS concentration. This decrease in relaxation time was expected since this parameter indicates the rate of exponential breakdown of stress
in a shear environment (RAVI; BHATTACHARYA, 2004).A
decrease in the values of t indicates a slower breakdown of
sample structure and/or agglomerates as compared with the pure soursop juice due to the greater resistance to flow.
Figure 4 shows the results for the sedimentation index of soursop juice with added SSPS during the seven days of observation. The sedimentation index (IS) was higher for the pure soursop juice and decreased with increasing SSPS concentration. In addition, the sedimentation rate decreased considerably with increasing amounts of SSPS (Table 7). However, the sediment volume tended to remain close to the soy proteins (pI 4.5). At this pH value, the repulsion forces
become minimal favoring hydrophobic interactions and the aggregation of protein particles and subsequent precipitation (AGUILERA; RADEMARCHER, 2004).
The sedimentation rate (v) of these formulations increased with the addition of SPI up to a protein concentration of 2.0%. However, at higher SPI concentrations, it decreased reaching a value even smaller than that of pure soursop juice with 5.0% SPI. This behavior can be better visualized in the zoomed picture in Figure 2. In spite of the low pH, the higher viscosity (Table 4) decreased particle mobility and retarded sedimentation of the solids leading to lower values of sedimentation rate and volume.
3.2 Soursop juice and SSPS formulations
Figure 3 shows the flow curves for the soursop juice and SSPS formulations. As with the soursop juice and SPI formulations, the lowest values for shear stress were presented by the pure soursop juice, although the effect of the SSPS was greater, leading to higher values than those of the SPI formulations, except for the lowest SSPS concentration (1.0% w/w), value similar to that of the pure juice. All curves showed shear thinning behavior, but in contrast to the SPI systems the addition of SSPS inhibited the tendency for shear thickening behavior at higher shear rates.
This behavior can be explained by the increase in viscosity with the addition of SSPS (Table 6), which prevented the formation of a three-dimensional arrangement with the juice particles preserving the pseudoplasticity of the solution.
Table 5. Parameters of the first-order kinetics equation fitted to the sedimentation index for soursop juice with added SPI during seven days of observation.
SPI (%) (w/w) v (h–1) IS
eq (%) R 2 (%)
0 0.294 ± 0.01b 43.6 ± 0.38a 99.16
1.5 0.436 ± 0.02d 51.6 ± 0.37c 98.80
2.0 0.446 ± 0.01d 49.4 ± 0.42d 99.27
3.0 0.327 ± 0.01c 48.0 ± 0.40c 98.40
4.0 0.310 ± 0.01b 49.6 ± 0.50d 98.68
5.0 0.168 ± 0.01a 46.0 ± 1.1b 98.00
Different letters in the same column indicate a significant difference (p < 0.05).
Figure 2. Stability curves for pure soursop juice and beverages formulated with added soy protein isolate during seven days of observation.
Figure 3. Rheological curves for pure soursop juice and beverages formulated with added soy soluble polysaccharide.
SPI concentration (p < 0.10), but the interaction between SPI and SSPS led to higher values of this parameter.
The viscosity at high shear rates (h50) (Figure 5c) also
showed the same behavior of consistency index since k is related with viscosity and SPI showed a positive influence (p < 0.10). Nevertheless, the values obtained for the apparent viscosity at
50 s–1 (Table 8) were higher than those of the control formulation
with SPI (Table 4) and similar to those obtained for the control formulation with SSPS (Table 6).
At last, the zero shear viscosity showed an influence of all components. These results suggest that there were synergistic effects between the SPI and SSPS and that this interaction interfered with the rheological parameters. The zero shear rate
values (h0) showed a quadratic and negative influence of the
SSPS, SPI, and calcium concentrations (p < 0.10), as shown in Figure 5b. In addition, the interaction terms between the protein and polysaccharide and between the SSPS and calcium were also significant (p < 0.10) showing a positive and negative influence, respectively.
These results suggest the formation of a complex between the SSPS and the SPI since at the juice pH, the protein molecules are positively charged and the polysaccharides are negatively charged. Protein-polysaccharide complexes are affected by a wide variety of variables such as pH, ionic strength, charge density, polysaccharide concentration, and biopolymer ratio. According to Nakamura et al. (2003), SSPS adsorbs onto the proteins in solution due to their opposite charges, and the thick layer of neutral sugar side chains of the SSPS result in stabilization of the proteins due to steric effects.
Stability tests
Table 9 shows the results for the equilibrium sedimentation
index (ISeq) and rate (v) exhibiting a clear positive influence
of the SSPS concentration on juice stability (p < 0.05). SSPS is negatively charged and a large amount of this polysaccharide can increase the repulsion between the polymers and decrease the amount of sediment. If the charge density of this polyelectrolyte is high enough, when the molecules reach the critical level (maximum) of association, an electrostatic repulsion occurs between the polymers that are interacting with the proteins and those that are still dispersed in the aqueous phase (LAM et al., 2007). In addition, a steric effect caused by the neutral sugars of the SSPS when this biopolymer adsorbs onto the protein moieties, could occur again.
The analysis of the factorial design indicated that SSPS was the only parameter that exerted a significant and negative values obtained for the solutions containing 3.0 or 5.0% (w/w)
of SSPS showing that this biopolymer could partly stabilize the juice fibers.
The results obtained for sedimentation stability were in agreement with the rheological tests since the results of one interfere with the results of the other. According to Furuta and Maeda (1999), a concentration of 5% w/w SSPS slightly changed the viscosity of an aqueous solution. Nevertheless, soursop juice with added SSPS showed an increased viscosity, which also led to greater stability.
3.3 Formulation of soy beverages
Rheological analysis
The different formulations showed shear thinning behavior and the flow curves were well fitted to the Cross and power law models. Beverages with suspended particles show a typical shear thinning behavior, which is advantageous for the stabilization of these dispersions. Moreover, the decrease in viscosity with the increase in shear rate results in a pleasant sensation for consumption (FOX; INEGENPASS; ZACHOW, 1993).
Table 8 shows the results of the rheological parameters obtained from the trials of the factorial experimental design. Only the effects of the variables were analyzed since the quality of parameter estimation was not good (Figure 5). The flow index ‘n’ (Figure 5d) showed only a significant influence of the addition of protein (p < 0.10), while the parameter m (Figure 5a) of the Cross model was affected by the SPI and SSPS concentrations (p < 0.10). For ‘m’ parameter, an increase in SPI concentration tended to decrease the pseudoplasticity of the solution, which was unexpected (LAMSAL; JUNG; JOHNSON, 2007; TSUMURA et al., 2005), which can be attributed to the presence and interaction of this biopolymer with SSPS. The relaxation
time (t) (Figure 5b) showed a negative influence of CaCl2 and
Table 7. Parameters of the first-order kinetics equation (Equation 2) fitted to the sedimentation index for soursop juice with added SSPS during seven days of observation.
SSPS (w/w) v (h–1) IS
eq (%) R2 (%)
0 0.566 ± 0.003a 55.4 ± 0.01a 99.67
1.0 0.108 ± 2.0E-4b 43.3 ± 0.40b 99.18
3.0 0.048 ± 0.002c 33.9 ± 0.43c 99.47
5.0 0.037 ± 0.03d 33.4 ± 0.75c 97.41
Different letters in the same column indicate a significant difference (p < 0.05). Table 6. Rheological parameters of soursop juice with added SSPS.
SSPS (%) (w/w)
Cross Model Power Law h
50
(mPa.s) t (s) m h∞ (mPa.s) h0 (mPa.s) R2 (%) k (mPa.sn) n R2 (%)
0 56.05 ± 0.04a 0.57 ± 0.003b 0.0a 1548.22 ± 6.4a 99.98 133.31 ± 0.01a 0.52 ± 0.007a 99.69 16.09 ± 0.65a
1.0 40.86 ± 2.21b 0.51 ± 0.001a 1.52 ± 0.1a 861.93 ± 14.2b 99.98 106.84 ± 3.98b 0.56 ± 0.001b 99.75 17.86 ± 0.72a
3.0 2.00 ± 0.06c 0.75 ± 0.030c 11.87 ± 0.90b 530.94 ± 14.5c 98.80 174.64 ± 1.31c 0.58 ± 0.001b 97.70 28.23 ± 0.70b
5.0 1.18 ± 0.07c 0.75 ± 0.014c 22.29 ± 0.36c 483.65 ± 14.8c 99.95 215.20 ± 2.20d 0.62 ± 0.005c 98.78 43.90 ± 1.64c
Figure 5. Pareto’s chart of the rheological analysis. a) ‘m’ parameter; b) relaxation time; c) maximum Newtonian viscosity, and d) flow index (n).
a b
c d
Table 8. Rheological parameters for the different formulations of the soursop soy-beverage based on the factorial design.
Run SSPS (%) (w/w) SPI (%) (w/w) [CaCl2]
(mM)
Cross Model Power Law h
50
(mPa.s) t (s) m h0 (mPa.s) R2 k (mPa.sn) n R2
a b
c
Figure 6. Response surfaces of the equilibrium sedimentation index for soursop juice with added SSPS, SPI and CaCl2. a) CaCl2 concentration fixed at 0 mM; b) CaCl2 concentration fixed at 100 mM, and c) CaCl2 concentration fixed at 200 mM.
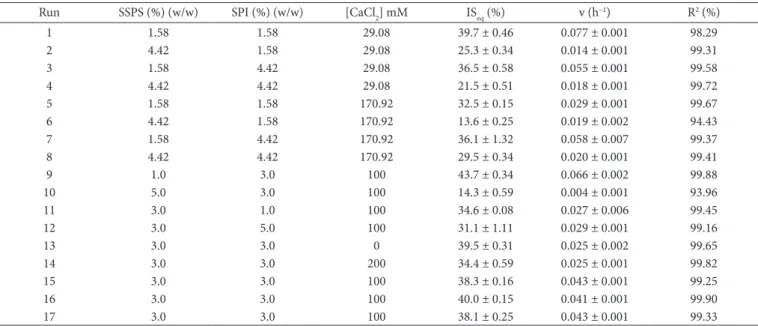
effect on the sedimentation rate. However, the equilibrium sedimentation index was influenced by the concentrations of both SSPS and SPI and by the interaction parameter between the SPI and calcium chloride concentrations (Equation 5). The
R2 values were satisfactory and high; however, the Fcalc/Ftab
ratio was not high enough, and the model generated could not predict well. However, this model could show a tendency of the expected results.
2 2 2
2
39 7.64 4.18
2.82 3.31 [ ]
0,87; / 2.57
eq
IS SSPS
SSPS SPI SPI Ca
R Fcalc Ftab
+
= − × − ×
− × + × ×
= =
(5)
Figure 6 shows the response surface plots for the
equilibrium sedimentation index (ISeq), which clearly show the
positive influence of SSPS and the dependence between SPI and
CaCl2 with respect to the stability of the soursop soy-beverage.
For all the surfaces, the highest concentration of SSPS led to the smallest amount of sediment, and the influence of the protein was affected by the ionic content in the solution. In the salt
absence and at the highest salt concentration (Figures 6a, c), the results indicated that the SPI concentration had a greater influence on the sedimentation value than the concentration of 100 mM calcium chloride. These results showed that the salt concentration affected SSPS-SPI complexation and also suggested that the SSPS concentration should be increased to reach complete stabilization of this beverage.
As shown in Figure 6, the most favorable biopolymer concentration was around 5% (w/w) in the absence of salt, when the smallest sedimentation index was obtained. Besides the influence of concentration, the protein:polysaccharide ratio of the mixture also influenced the charge balance affecting the formation of complexes and their behavior. In a mixture of two polymers, maximal complexation is obtained for a specific ratio between them under determined conditions (WINBRECK et al., 2003).
References
ACQUARONE, V. M.; MENEGALLI, F. C.; RODRIGUES, M. I. Rheological behavior of soursop (Annona Muricata L.) juice as a function of temperature and concentration. In: ORTEGA, E.; PARADA, E.; FITO, P. (Eds.). Equipos y procesos para la industria de alimentos: propiedades físicas de alimentos. Valência: Universidade Politécnica, 1996, p. 1-8. v.1
AGUILERA, J. M.; RADEMARCHER, B. Proteins gels. In: YADA, R. Y. (Ed.). Proteins in food processing. New York: CRC Press, 2004. cap. 20.
ASSOCIATION OF OFFICIAL ANALYTICAL CHEMISTS – AOAC. Official methods of analysis. 16th ed. Arlington: AOAC, 1997. ARIENZO, M.; CAPASSO, R. analysis of metal cations and inorganic
anions in olive oil mill waste waters by atomic absorption spectroscopy and ion chromatography. Detection of metals bound mainly to the organic polymeric fraction. Journal of Agricultural and Food Chemistry, v. 48, n. 4, p. 1405-1410, 2000. PMid:10775405. http://dx.doi.org/10.1021/jf990588x
BARNES, H. Shear-thickening (“dilatancy”) in suspensions of nonaggregating solid particles dispersed in newtonian liquidis. Journal of Rheology, v. 33, n. 2, p. 329-366, 1989. http://dx.doi. org/10.1122/1.550017
BLIGHT, E. G.; DYER, W. J. A rapid method for total lipid extraction and purification. Canadian Journal of Biochemistry Physiology, v. 37, p. 911-917, 1959. http://dx.doi.org/10.1139/o59-099 CHOVE, B. E.; GRANDISON, A.; LEWIS, M. J. Some functional
properties of fractionates soy protein isolates obtained by microfiltration. Food Hydrocolloids, v. 21, n. 8, p. 1379-1388, 2007. http://dx.doi.org/10.1016/j.foodhyd.2006.10.018
EDGEBERT, W. R. Isolated Soy Protein: Technology, Properties, and Applications. In: KESHUN, L. (Ed.) Soybean as Functional Foods and Ingredients. Champaing: AOCS Press, 2004. cap. 7.
FOX, J. E.; INEGENPASS, P.; ZACHOW, S. Stabilizers. In: MACRAE, R.; ROBINSON, R. K.; SADLER, M. J. (Eds.). Encyclopedia of food science, food technology, and nutrition. London: Academic Press, 1993. v. 7, p. 4350-4358.
depending on the ionic strength caused by competition between the macromolecules for the solvent (TOLSTOGUZOV, 1997). This behavior can be observed in Figure 6c, in which the same polysaccharide:protein ratio (5:5) showed an elevated volume
of sediment. The presence of 200 mM CaCl2 changed the charge
balance leading to an incompatibility between the biopolymers.
4 Conclusions
The addition of soy protein isolate increased the viscosity of the soursop juice, but the sedimentation index also increased due to acidic precipitation of the soy protein isolate. The addition of soy soluble polysaccharide to soursop juice also led to higher values for viscosity, but better stability results were achieved. The simultaneous addition of SSPS and SPI showed that SSPS did not change the apparent viscosity under the process conditions, but it exerted a positive influence on the zero shear rate viscosity. In addition, the interaction between both biopolymers improved the sedimentation index, and the results indicated that the SSPS stabilized the fibers and proteins mainly because of steric effects, and not merely due to enhancement of viscosity. The formation of complexes and the consequent stability were affected by the SSPS/SPI ratio and the salt concentration. The best result was found at a ratio of around 1:1 (SSPS:SPI) with the maximum
concentration of biopolymers and 100 mM of CaCl2. Therefore,
SSPS improved the stabilization of the insoluble fibers and soy protein in acidic suspensions under the shear conditions of the processes without noticeable changes to the beverage characteristics.
Acknowledgements
The authors are grateful for the financial support provided by Capes (Proex 304/2007) and CNPq (process number (301869/2006-5).
Table 9. Parameters of the first-order kinetics equation for soursop juice with the addition of SPI and CaCl2 during seven days of observation. The formulations of the soursop soy beverages were based on a factorial design.
Run SSPS (%) (w/w) SPI (%) (w/w) [CaCl2] mM ISeq (%) v (h–1) R2 (%)
1 1.58 1.58 29.08 39.7 ± 0.46 0.077 ± 0.001 98.29
2 4.42 1.58 29.08 25.3 ± 0.34 0.014 ± 0.001 99.31
3 1.58 4.42 29.08 36.5 ± 0.58 0.055 ± 0.001 99.58
4 4.42 4.42 29.08 21.5 ± 0.51 0.018 ± 0.001 99.72
5 1.58 1.58 170.92 32.5 ± 0.15 0.029 ± 0.001 99.67
6 4.42 1.58 170.92 13.6 ± 0.25 0.019 ± 0.002 94.43
7 1.58 4.42 170.92 36.1 ± 1.32 0.058 ± 0.007 99.37
8 4.42 4.42 170.92 29.5 ± 0.34 0.020 ± 0.001 99.41
9 1.0 3.0 100 43.7 ± 0.34 0.066 ± 0.002 99.88
10 5.0 3.0 100 14.3 ± 0.59 0.004 ± 0.001 93.96
11 3.0 1.0 100 34.6 ± 0.08 0.027 ± 0.006 99.45
12 3.0 5.0 100 31.1 ± 1.11 0.029 ± 0.001 99.16
13 3.0 3.0 0 39.5 ± 0.31 0.025 ± 0.002 99.65
14 3.0 3.0 200 34.4 ± 0.59 0.025 ± 0.001 99.82
15 3.0 3.0 100 38.3 ± 0.16 0.043 ± 0.001 99.25
16 3.0 3.0 100 40.0 ± 0.15 0.041 ± 0.001 99.90
NAKAMURA, A. et al. Emulsifying properties of soybean soluble polysaccharide. Food Hydrocolloids, v. 18, n. 5, p. 795-803, 2004a. http://dx.doi.org/10.1016/j.foodhyd.2003.12.005
NAKAMURA, A. et al. Study of the role of the carbohydrate and protein moieties of soy soluble polysaccharides in their emulsifying properties. Journal of Agricultural and Food Chemistry, v. 52, n. 17, p. 5506-5512, 2004b. PMid:15315392. http://dx.doi. org/10.1021/jf049728f
PAULSEN, P. V.; WELSBY, M. N.; HUANG, X. L. Ready-to-drink soy protein nutritional beverages. In: RIAZ, M. N. (Ed.). Soy applications in food. New York:Taylor & Francis Group, 2006. p. 188-206.
POTTER, R. M. et al. Characteristics of wild blueberry–soy beverages. LWT–Food Science and Technology, v. 40, n. 5, p. 807-814, 2007. RANGANNA, S. Manual of analysis of fruit and vegetable products.
New Dehi:Tata McGraw-Hill Publishing, 1977.
RAVI, R.; BHATTACHARYA, S. Flow behavior of chickpea (Cicer arietinum L.) flour dispersions: Effect of additives. Journal of Food Engineering, v. 65, n. 4, p. 619-624, 2004. http://dx.doi. org/10.1016/j.jfoodeng.2004.02.030
RODRIGUES, M. I.; IEMMA, A. F. Planejamento de experimentos e otimização de processos: uma estratégia sequencial de planejamentos. Campinas: Casa do Pão Editora, 2005.
STEFFE, J. F. Rheological methods in food process engineering. Easting Lansing: Freeman Press, 1996.
TELIS-ROMERO, J. et al. Effect of apparent viscosity on the pressure drop during fluidized bed drying of soursop pulp. Chemical engineering and processing: process Intensification, v. 46, n. 7, p. 684-694, 2007.
TOLSTOGUZOV, V. B. Protein-polysaccharide interactions. In: DAMODARAN, S.; PARAF, A. (Eds.). Food proteins and their applications. New York: Marcel Dekker, 1997. p.171-199. TSUMURA, K. et al. Functional properties of soy protein hydrolysates
obtained by selective proteolysis. LWT–Food Science and Technology, v. 38, n. 3, p. 255-261, 2005.
VILLARES, A. et al. Content and profile of isoflavones in soy-based foods as a function of the production process. Food and Bioprocess Technology, v. 4, n. 1, p. 27-38, 2010. http://dx.doi.org/10.1007/ s11947-009-0311-yhttp://dx.doi.org/10.1007/s11947-009-0311-y WEINBRECK, F. et al. Complex coacervation of whey proteins and
gum Arabic. Biomacromolecules, v. 4, n. 2, p. 293-303, 2003. PMid:12625724. http://dx.doi.org/10.1021/bm025667n
YE, A. Complexation between milk proteins and polysaccharides via electrostatic interaction: principles and applications – a review. International Journal of Food Science and Technology, v. 43, n. 3, p. 406-415, 2008. http://dx.doi.org/10.1111/j.1365-2621.2006.01454.x
YE, A.; FLANAGAN, J.; SINGH, H. Formation of stable nanoparticles via electrostatic complexation between sodium caseinate and gum Arabic. Biopolymers, v. 82, n. 2, p. 121-133, 2006. PMid:16453308. http://dx.doi.org/10.1002/bip.20465
FURUTA, H.; MAEDA, H. Rheological properties of water-soluble polysaccharides extracted under weak acidic condition. Food Hydrocolloids, v. 13, n. 3, p. 267-274, 1999. http://dx.doi. org/10.1016/S0268-005X(99)00009-0
FURUTA, H. et al. Extraction of Water-soluble Soybean Polysaccharides under Acidic Conditions. Bioscience Biotechnology and Biochemistry, v. 62, n. 12, p. 2300-2305, 1998. http://dx.doi. org/10.1271/bbb.62.2300
GENOVESE, D. B.; LOZANO, J. E. The effect of hydrocolloids on the stability and viscosity of cloudy apple juices. Food Hydrocolloids, v. 15, n. 1, p. 1-7, 2001. http://dx.doi.org/10.1016/S0268-005X(00)00053-9
GENOVESE, D. B.; ELUSTONDO, M. P.; LOZANO, J. E. Color and cloud stability in cloudy apple juice by steam heating during crushing. Journal of Food Science, v. 62, n. 6, p. 1171-1175, 1997. http://dx.doi.org/10.1111/j.1365-2621.1997.tb12238.x
GRATÃO, A. C. A.; SILVEIRA JUNIOR, V.; TELIS-ROMERO, J. Laminar flow of soursop juice through concentric annuli: Friction factors and rheology. Journal of Food Engineering, v. 78, n. 4, p. 1343-1354, 2007. http://dx.doi.org/10.1016/j. jfoodeng.2006.01.006
HOFFMAN, R. L. Explanations for the cause of shear thickening in concentrated colloidal suspensions. Journal of Rheology, v. 42, n. 1, p. 111-123, 1998. http://dx.doi.org/10.1122/1.550884
HUA, Y.; CHUI, S. W.; WANG, O. Gelling property of soy protein-gum mixtures. Food Hydrocolloids, v. 17, n. 6, p. 889-894, 2003. http:// dx.doi.org/10.1016/S0268-005X(03)00110-3
LAM, A.; SHEN, R.; PAULSEN, P. CORREDIG, M. Pectin stabilization of soy protein isolates at low pH. Food Research International, v. 40, n. 1, p. 101-110, 2007. http://dx.doi.org/10.1016/j. foodres.2006.08.004
LAMSAL, B. P.; JUNG, S.; JOHNSON, L. A. Rheological properties of soy protein hydrolysates obtained from limited enzymatic hydrolysis. LWT – Food Science and Technology, v. 40, n. 7, p. 1215-1223, 2007.
LIU, J. et al. Investigation of interactions between two different polysaccharides with sodium caseinate-stabilized emulsions using complementary spectroscopic techniques: Diffusing wave and ultrasonic spectroscopy. Food Hydrocolloids, v. 22, n. 1, p. 47-55, 2008. http://dx.doi.org/10.1016/j.foodhyd.2007.01.021 LIU, K. Soybeans: chemistry, technology and utilization. New York:
Chapman and Hall, 1997.
NAKAMURA, A. et al. Analysis of structural components and molecular construction of soybean soluble polysaccharides by stepwise enzymatic degradation. Bioscience Biotechnology and Biochemistry, v. 65, n. 10, p. 2249-2258, 2001. PMid:11758917. http://dx.doi.org/10.1271/bbb.65.2249