Magnetic susceptibility for characterizing areas with different potentials for sugarcane production
Texto
Imagem

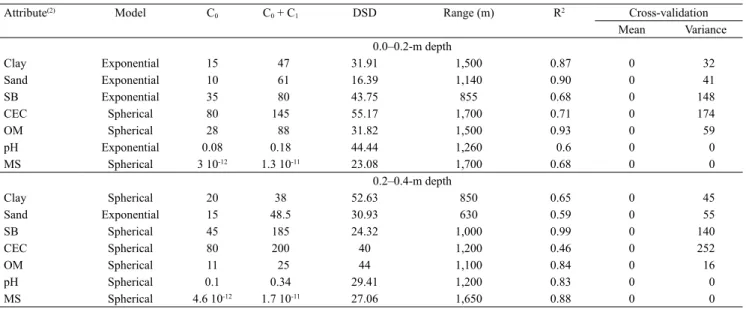
![Figure 2. Scaled semivariogram for soil attributes [model (nugget effect – sill – range) R 2 ]](https://thumb-eu.123doks.com/thumbv2/123dok_br/15918348.674776/6.914.100.803.164.987/figure-scaled-semivariogram-attributes-model-nugget-effect-range.webp)
Documentos relacionados
Compreender de que forma os profissionais de Relações Públicas podem agir perante um caso de fake news é também um dos objetivos traçados para esta investigação, bem como
Now that the data are stored into a matrix an interface was developed to plot the graphs to make the evaluation easier for the user and to give the possibility to make
Nesta pesquisa investigo se há conexão entre as possibilidades criadas pelo cineasta e designer Saul Bass, na abertura e no cartaz criados para o filme Nine
PROPOSTA DE PROJETO PILOTO DA GC NO TJPE Nesta proposta são enfatizados os processos de conversão do conhecimento de Nonaka & Takeuchi 1997, utilizando-se a ferramenta
O segundo foi a noção de cidadão moderno, que “ao criar a figura do cidadão pleno, a constituição revolucionária criou, por oposição, seu contrário: o não cidadão, o que
A infestação da praga foi medida mediante a contagem de castanhas com orificio de saída do adulto, aberto pela larva no final do seu desenvolvimento, na parte distal da castanha,
