MAGNETIC SUSCEPTIBILITY AS INDICATOR OF SOIL QUALITY IN
SUGARCANE FIELDS
1MARIANA DOS REIS BARRIOS2, JOSÉ MARQUES JUNIOR2, SAMMY SIDNEY ROCHA MATIAS3*, ALAN
RODRIGO PANOSSO4, DIEGO SILVA SIQUEIRA2, NEWTON SCALA JUNIOR5
ABSTRACT – Sugarcane management practices (unburned cane - UC and burned cane – BC) interfere with dynamics of soil magnetic properties. This study focused on determining the potential of magnetic susceptibility as soil quality indicator in areas under sugarcane cultivation. The experiment area is on the limit between basalt from São Bento Group, Serra Geral Formation, and sandstone from Bauru Group – Adamantina Formation. Twenty soil samples were collected from two management areas (burned and unburned sugarcane prior to harvest) at a depth range of 0.0-0.2 m. Local soil was classified as eutroferric Red Latosol (Oxisol), with highly clayey texture. Chemical and physical properties, CO2emissions and magnetic susceptibility (MS) in air-dried fine earth (MSADFE), total sand fraction (MSTS) and clay fraction (MSCF). The magnetic signature from MS was effective in identifying changes of physical, chemical and mineralogical traits in Latosols under burned and unburned sugarcane crop. The information provided here can guide further studies on the genesis of minerals with magnetic expression in environments and exposed to fire burning.
Keywords: Magnetic signature. Applied Geophysics. Neo-formation. Multivariate Statistics.
SUSCETIBILIDADE MAGNÉTICA COMO INDICADOR DE QUALIDADE DO SOLO EM ÁREAS SOB CULTIVO DE CANA-DE-AÇÚCAR
RESUMO – As práticas de manejo utilizadas na cultura da cana-de-açúcar (cana crua - CC e cana queimada – CQ) interferem na dinâmica dos atributos e expressão magnética do solo. Foi estudado o potencial da suscetibilidade magnética como indicador de qualidade do solo em áreas sob cultivo de cana-de-açúcar. O experimento localiza-se em uma área limítrofe de material de origem, entre o Basalto do Grupo São Bento, Formação Serra Geral, e o Arenito do Grupo Bauru, Formação Adamantina. Foram coletadas 20 amostras de solo em dois sistemas de manejo (com e sem queima da cana-de-açúcar para colheita) na profundidade de 0,0-0,2 m. O solo foi classificado como Latossolo Vermelho Eutroférrico, textura muito argilosa. Foram avaliados os atributos químicos, físicos, emissão de CO2e a suscetibilidade magnética (SM) do solo na terra fina seca ao ar (SMTFSA), fração total sand (SMAT) e fração argila (SMARG). A assinatura magnética expressa pela suscetibilidade magnética foi eficaz na identificação de mudanças nas características físicas, químicas e mineralógicas de Latossolos sob sistemas de colheita da cana-de-açúcar com e sem queima. As informações geradas neste trabalho podem balizar futuros estudos sobre a gênese de minerais com expressão magnética em ambientes e expostos a presença de fogo.
Palavras - chave: Assinatura magnética. Geofísica aplicada. Neoformação. Estatística Multivariada.
_____________________ *Corresponding author
1Received for publication in 08/21/2014; accepted in 08/17/2016.
Part of the first author’s thesis in Soil and Plant Nutrition.
2Department of Soils and Fertilizers, Universidade Estadual Paulista, Jaboticabal, SP, Brazil; [email protected],
[email protected], [email protected].
3Department of Agronomy, Universidade Estadual do Piauí, Corrente, PI, Brazil; [email protected].
Rev. Caatinga
INTRODUCTION
Land use sustainability based on indicators is considered one of the main alternatives to slow global impacts on diverse biosystems (ROCKSTRÖM et al., 2009). Some researchers have developed important indicators for unburned sugarcane management regarding soil physical quality and greenhouse gas emissions (PANOSSO et al., 2011), as well as nutrient availability by mineral selective dissolution (BARBIERI et al., 2013).
Whereas current cropping systems are increasingly dynamic, demanding more information, accuracy and rapidity in decision-making, indicators highly sensitive to changes in soil quality are required, whose costs and environmental impacts by reagent use are lower. The properties considered biological indicators of soil quality are microbial biomass, breathing and nitrogen biological fixation; as chemical indicators, there are pH, organic carbon, effective CEC, N, P, K, Ca, Mg, and electrical conductivity (DIÓGENES et al., 2013; MATIAS et al., 2014). As physical indicators: soil density, soil resistance to penetration, porosity, and aggregate stability (REYNOLDS et al., 2009; IMAZ et al., 2010). However, one of the disadvantages of these indicators is a specific determination method, what generally takes longer times and are of higher costs, impairing their applicability on large farming areas that demand a higher number of samples.
A few researchers have used alternative methods based on geophysical indicators, such as magnetic susceptibility (MS) to map distinct management areas and estimate different soil properties (MATIAS et al., 2013; CAMARGO et al., 2014, 2016). Magnetic susceptibility stands for a material magnetizing ability (DEARING, 1994). Minerals in rocks, sediments and soil show different magnetization abilities varying with composition, crystal spatial structure and size (THOMPSON; OLDFIELD, 1986; VEROSUB; ROBERTS, 1995). According to Maher and Thompson (1999), magnetic minerals record soil formation factors and processes. These minerals are naturally found in mineral soils with four types of magnetic behavior: ferromagnetic (ex.: magnetite, maghemite and ferromagnetic ferridryte), antiferromagnetic (ex.: hematite and goethite), diamagnetic (ex.: quartz) and paramagnetic (ex.: olivine) (DEARING, 1994; MICHEL et al., 2010; LIU et al., 2012).
Magnetic susceptibility is a covariate measure of mineralogy; thus, its changes may be interpreted as the magnetic signature of a soil, sensitive to mineral types and characteristics, as well as the formation environment (genesis). Since soil physical and chemical dynamics varies with its mineralogy (BARBIERI et al., 2013), MS is a major indicator, being able to provide information on sustainable
farming.
Magnetic signature has been used for mineral quali-quantitative analysis in tropical soils (BAHIA et al., 2015), as indicator of environmental quality for CO2 emissions (BARRIOS et al., 2012; LEAL et al., 2015), identifying distinct landscapes or land boundaries (MATIAS et al., 2014) and areas of potential erosion (SANTOS et al., 2011).
Under this background, this study evaluated the potential of magnetic susceptibility as soil quality indicator in areas under distinct sugarcane managements.
MATERIAL AND METHODS
Study area location and characterizationThe study areas are located in the city of Guariba, southeastern state of São Paulo, at geographic coordinates of 21º 24 'south latitude and 48º 09' west longitude. Average altitude of 550 m above sea level and slope of 3 to 4% (Figure 1). This study is a sequel to Barbieri et al. (2013, 2014), which were in the same area and under the same conditions.
Geomorphologically, the areas are within the Western Plateau of São Paulo state, near the border of Basaltic Cuestas, which is under transition of basalt from São Bento Group, Serra Geral Formation and sandstone from Bauru Group, Adamantina Formation (IPT, 1981). This geological transition is estimated to cover nearly 3.5% of the state of São Paulo (874,000 hectares) (IPT, 1981).
Local soil was classified as eutroferric Red Latosol (Oxisol), with clayey texture - LVef (MATIAS et al., 2013), following the Brazilian System of Soil Classification (SANTOS et al., 2013). The area under unburned management (UC) had been harvested mechanically for seven years, being released around 10 to 12 t ha-1 year of crop residues (straw). The other area, under burned management (BC), had undergone annual controlled burnings since 1970 until 2007. Both areas were grown with the sugarcane variety CTC-6.
Both areas were subsoiled and ratoon underwent chemical destruction. Afterwards, 2 t ha-1 dolomitic limestone and 1 t ha-1 farming gypsum were applied onto total area, for soil correction, without incorporation. Fertilization was carried out at planting row, spreading 500 kg ha-1 10-25-25 formula, and planting was performed manually.
Applications of 100m3 vinasse in ratoon, 300 kg ha-1 urea in burned cane and 200 kg ha-1
Sampling and laboratory testing
Both UC and BC areas are the same size (190 × 10 m), being 13 meters apart from each other (Figure 1). Two identical sample and regular meshes (190 × 10 m) were drawn over the areas at different positions (relief) containing 20 points each and apart in 13.3 m (Figure 1), following the method of Barbieri et al. (2013). Soil sampling was carried out in a layer from 0.00 to 0.25 m, with a Dutch auger, since within this depth range fire influence on soil properties is of great importance.
Particle size analysis, for sand, clay and silt total content determinations, was performed by the pipette method, using 0.1 mol L-1 NaOH as chemical dispersant, left in low speed mechanical stirrer for 16 hours. Clay and sand were separated following the method for X-ray analysis (DONAGEMA et al., 2011). Microporosity (Micro) was estimated in soil samples using a fritted funnel in previously saturated samples (DONAGEMA et al., 2011). Contents of organic matter (OM) and available phosphorus (PAvail) were determined by the method of Raij (2001). Higher crystallinity Fe-content (FeDit) was extracted by dithionite-citrate-bicarbonate (DCB), as method of Mehra and Jackson (1960), determining iron content through atomic absorption spectrophotometry.Organic matter quality (degree of humification - Hum), which evaluates humic amorphous compounds, was determined according to the method proposed by Milori et al. (2006). Hum is a semi-quantitative elemental analysis, assessed by laser-induced plasma optical emission spectroscopy. Such technique is based on stirring of the soil samples by laser emission of ultraviolet/ blue rays,
fluorescing functional groups of organic matter linked to humidification process. Soil CO2 emissions (FCO2) were recorded with a portable automated meter of soil CO2 flow (LI-8100), during sugarcane early stages.
Soil magnetic signature was assessed by readings of magnetic susceptibility in air-dried fine earth (MSADFE), clay fraction (MSClay) and total sand (MSTS), using an adapted analytical scale (SIQUEIRA et al., 2010). The device consists of a magnet, a magnet-holder and a sample-holder. The interaction between the magnet and magnetic minerals, within the soil samples, exerts a weight force on the scale, which is then converted into MS values through a standard curve as shown by Siqueira et al. (2010).
Statistics
Statistical analyzes were compound by descriptive statistics (mean and coefficient of variation) and multivariate analysis (principal component analysis and cluster analysis). ANOVA F test was performed on the means and, subsequently, the Student's t test, at 1% (p <0.01), showing the difference between the means in both management systems (UC and BC). Multivariate analyzes were performed after standardization of all soil properties, with mean 0 and variance 1.
Clustering was performed by hierarchical method, following method proposed by Sneath and Sokal (1973). The goal was to identify similarity patterns of database, grouping them according to dissimilarity coefficients. The dissimilarity coefficients were obtained by calculating the
Rev. Caatinga
Euclidean distance based on the Ward algorithm (HAIR et al., 2005).
Principal component analysis (PCA) helped to explain variance in the results. This analysis targets to find within a dataset one soil property able to explain significant part of the variance of the entire population sampled, by means of linear correlation (HAIR et al., 2005). The number of principal components (PC) used in interpretations considered a minimum of 80% total variance explanation and eigenvalue above one (HAIR et al., 2005). The order of importance of properties in explaining dataset total variance was calculated considering the weight of each property in the CP chosen for interpretation.
RESULTS AND DISCUSSION
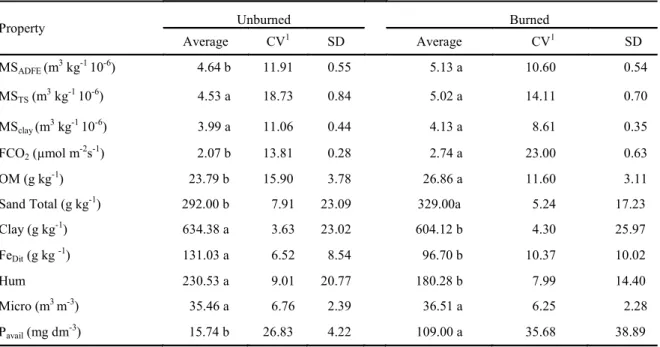
UC system showed the highest clay content, FeDit and Hum, while BC had the highest MSADFE, FCO2, OM, total sand and PDisp. Conversely, MSTS, MSClay and Micro showed no significant differences (p<0.01) between both systems (Table 1). Regarding total contents of sand and clay in BC and UC, respectively, may be attributed to erosion, since the study area owns particular slope and mulching conditions, because of straw presence or absence on the soil surface. Matias et al. (2013) observed similar result in studies of landscape model by means of soil profile analysis.
The highest MSADFE in BC is related to a low concentration of lithogenic magnetites from basalt and neo-transformation of other iron oxide minerals by fire effect. Barbieri et al. (2014) showed
diffractograms of the same area proving a neo-formation by farming practices. Noteworthy,
grainsize fractions as total sand, silt and clay accounted for MSADFE. Therefore, silt fraction might also take charge for part of MSADFE, once it has ferromagnetic mineral magnetite is often found in this fraction, as sand fraction (DEARING, 1994).
Total sand magnetic signature confirmed magnetite, the only magnetic mineral to be found in this fraction, which can be of lithogenic origin or of residual fire (BARRÓN; TORRENT, 2013). Yet for clay fraction (MSClay), it expresses pedogenic ferromagnetic minerals such as maghemite and ferromagnetic ferridryte (MICHEL et al., 2010). There was no statistical difference when comparing both management systems in clay fraction. BC provided favoring conditions to the neo-formation of ferromagnetic minerals, since soil is subjected to high temperatures during the burning of sugarcane, in preharvest. Mineral neo-formation after burning has also been reported by other authors in natural and cropped environments (TORRENT; BARRÓN, 2010; LIU et al., 2012; BAHIA et al., 2015). Greater magnetic values may refer to presence of mineral coal (biochar) in soil, which affect electrochemical changes (SPOKAS et al., 2015).
Table 1. Descriptive statistics of unburned cane (UC) and burned cane (BC) systems, within 0.00-0.25 m depth.
FCO2 (soil CO2 emission); OM (organic matter content); Total sand (content of total sand); Clay (content of clay); FeDit (higher crystallinity Fe-content); MSADFE (magnetic susceptibility in air-dried fine earth); MSTS (magnetic susceptibility
in total sand fraction); MSclay (magnetic susceptibility in clay fraction); Hum (degree of humification in soil organic matter); Micro (microporosity); Pavail (Available phosphorus). Means followed by the same letter do no differ of each other, by t Student, (P<0.01). SD = Standard deviation; CV1= coefficient of variation.
Property Unburned Burned
Average CV1 SD Average CV1 SD
MSADFE (m3 kg-1 10-6) 4.64 b 11.91 0.55 5.13 a 10.60 0.54
MSTS (m3 kg-1 10-6) 4.53 a 18.73 0.84 5.02 a 14.11 0.70
MSclay (m3 kg-1 10-6) 3.99 a 11.06 0.44 4.13 a 8.61 0.35
FCO2 (µmol m-2s-1) 2.07 b 13.81 0.28 2.74 a 23.00 0.63
OM (g kg-1) 23.79 b 15.90 3.78 26.86 a 11.60 3.11
Sand Total (g kg-1) 292.00 b 7.91 23.09 329.00a 5.24 17.23
Clay (g kg-1) 634.38 a 3.63 23.02 604.12 b 4.30 25.97
FeDit (g kg -1) 131.03 a 6.52 8.54 96.70 b 10.37 10.02
Hum 230.53 a 9.01 20.77 180.28 b 7.99 14.40
Micro (m3 m-3) 35.46 a 6.76 2.39 36.51 a 6.25 2.28
Soil in BC had seven times more PAvail than in UC. Studying the same management systems (UC and BC), Barbieri et al. (2013, 2014) assigned adsorbed phosphorus variation to goethite crystallinity, depicting that in areas with smaller goethites, i.e. more reactive, more than 11% adsorbed phosphorus was found. Adsorbed phosphorus was inversely proportional to PAvail here. Magnetic values found in this study complement mineralogical findings shown by Barbieri et al. (2013, 2014), thus concluding that magnetic signature may be used t identify different pedogenic environments. Other authors have also suggested this variable, expressed by magnetic susceptibility, to identify and characterize different environments of iron oxide formation from clay fraction in sugarcane areas (CAMARGO et al., 2014, 2016). With respect to high-crystallinity Fe oxides (FeDit), we may state that most of the highly crystallized pedogenic minerals occur in UC compared to BC.
The greatest (p<0.01) content of organic matter (OM) was found in soil under BC (Table 1). Burning speed up conversion of plant straw into OM rich ashes, on soil surface. These ashes are easily incorporated to soil, increasing its OM content. In UC, despite protecting soil surface, straw decomposition into OM is slower, especially due to the C/N ratio and the amounts of cellulose, hemicellulose and lignin in the straw (VITTI et al., 2008).
Barbieri et al. (2013) found similar results of higher OM contents in pre-harvest burned sugarcane fields, under the same slope, soil and climate conditions. Larger CO2 emissions in BC is related to its specific temperature, as well as major contents of
OM and PAvail existing at this location (PANOSSO et al., 2011). Although microporosity is highly influenced by soil texture and OM content (DIECKOW et al., 2009), there was no significant effect (p<0.01) for these variables, except for OM
when comparing both management systems (Table 1).
The soil under UC showed a humification degree (Um) 28% higher than in BC. Hum is related to amorphous humic compounds such as humin and fulvic acid fraction. Other studies in tropical and subtropical regions have also reported a relationship between straw management on the soil and OM quality, mainly within surface layer between 0.00 to 0.10 m (DIECKOW et al., 2009, BARRIOS et al., 2012).
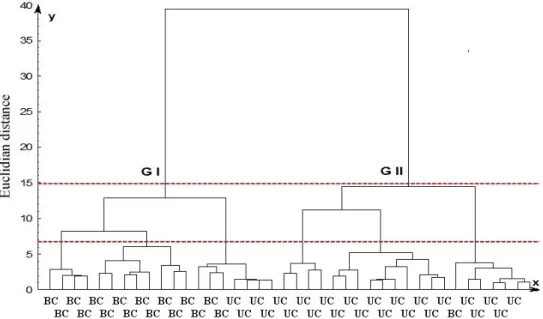
Two distinct groups were formed in Euclidean distance 15 (GI and GII) (Figure 2). Of the 20 points sampled in each system, 99% of them were reclassified to its proper management system (UC or BC), considering the analyzed properties. Unlike descriptive statistics, which evaluates the effect of managements on each property individually, multivariate clustering express the effect of management on the properties jointly, integrating existing relations among all properties. In this analysis, properties were grouped according to degree of similarity, as to classify them into similar groups. At Euclidean distance 7, each of the groups (GI and GII) could be subdivided into three subgroups. These subgroups corresponded to groups that are even more specific. Recently, cluster analysis has shown good results in defining areas with different pedogenetic potentials (SILVA JÚNIOR et al., 2012).
Figure 2. Dendrogram of the identified groups (GI and GII) based on cluster analysis using soil properties in both management systems (unburned cane - UC, burned cane - BC) at a depth range of 0.0 to 0.20 m; FCO2 (CO2 emission); OM (organic matter); Total sand (total sand content); Clay (clay content); FeDit (higher-crystallinity Fe content); MSADFE (magnetic susceptibility in air-dried fine earth); MSTS (magnetic susceptibility in total sand fraction); MSClay (magnetic
Rev. Caatinga
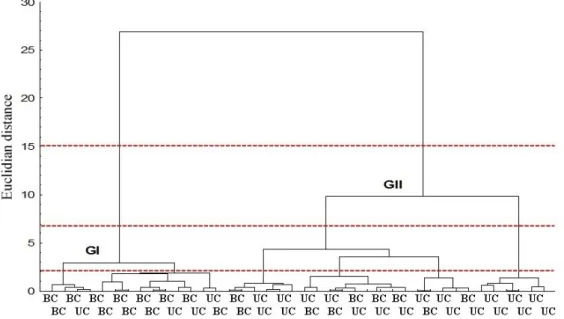
Solely MSADFE and MSClay were used for dendrogram building (Figure 3); therefore, two groups could be identified (GI and GII) at a Euclidean distance of 15. In group I, there was a 60% accuracy in grouping samples from BC; and in group II, it was 80% for UC samples. Subgrouping within management system was only possible at a Euclidean distance of 2. This distance may decrease for classifications of fewer soil properties. However, it is noteworthy that by using only magnetic signature, groups expressed by different management systems and their sub-groups could be identified.
Using magnetic signature to identify distinctive environments in areas grown with sugarcane under mechanized harvesting, Matias et al. (2015) found groups within a Euclidean distance between 18 and 24 and subgroups from 6 to 16. Unlike, Barbieri et al. (2014) used crystallographic
characteristics of iron oxide minerals to outline management groups in areas under BC and UC. The dendrogram developed by these authors indicated two groups at a Euclidean distance of 3.3, and subgroups at a Euclidean distance of 2.
Euclidean distance is dimensionless an expresses similarity among diverse studied properties. This variable can be interpreted as a measure of relationships occurring among a group of analyzed variables. Thus, our findings with magnetic signature are complementary to those of Barbieri et al. (2013, 2014), indicating a pattern when identifying major groups at a Euclidean distance near 15 and 20, and close to 5 for subgroups. These identified groups and subgroups are equivalent to different pedogenetic environments as demonstrated by spatial variability maps of iron oxide mineralogy for the same area presented by Barbieri et al. (2013).
Figure 3. Dendrogram of the identified groups (GI and GII) based on cluster analysis using soil properties in both management systems (unburned cane - UC, burned cane - BC) at a depth range of 0.0 to 0.20 m: MSADFE (magnetic
susceptibility in air-dried fine earth) and MSClay (magnetic susceptibility in clay fraction).
Regarding the PCA, the first three components were responsible for explaining roughly 80% of the total variance in the two managements.
The first PC accounted for about 42% total variance, the second for 28%, while the third accounted for only 10% (Table 2).
Table 2. Eigenvalues and percentage of variance explained by the first four principal components and correlation coefficients between original properties and principal components. Order of importance of original properties in the breakdown of management systems.
*Eigenvalues above unit proposed by Kaiser (1958). AC: Accumulated. Imp. Ord. = Importance order.
Principal component PC1 PC2 PC3
Eigenvalue* 4.66 3.07 1.11
Percentage (%) Explained 2.34 27.94 10.10
Eigenvalue* Accumulated 4.65 7.73 8.84
Percentage (%) Explained AC 42.34 70.27 80.37
Property Correlation Imp. Ord. Correlation Imp. Ord. Correlation Imp.
Ord.
Table 2. Continuation.
*Eigenvalues above unit proposed by Kaiser (1958). AC: Accumulated. Imp. Ord. = Importance order.
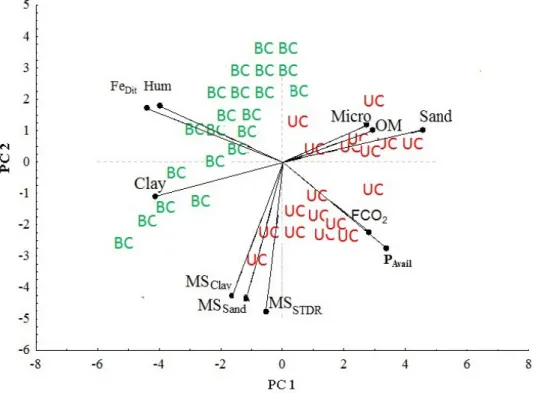
According to importance order, the soil properties showing higher correlation to PC1 were total sand, FeDIT, Hum and and PAvail. Conversely, the best related to PC2 were MSClay, MSADFE and MSTS (Table 2). For PC3, they were OM, Micro, clay and FCO2. Studying the effects of UC and BC management on soil physical, chemical and mineralogical properties, Barbieri et al. (2013) claimed chemical and mineralogical are explained by up to 88% of the four PC.
Figure 4 represents Table 2 in a graphical form, showing the PCs that best explained variability (PC 1 and PC2). Samples from BC are prevalent o the left of the graph while those of UC are displayed to the right of the figure. The black lines (vectors) and black dots represent soil properties with the
greatest potential to characterize both management systems. The length of the black lines (vector) is proportional to the potential of the property as pedoindicator. UC conditioned the highest values of FeDit while BC promoted the largest values of MS.
The highest values of FeDit in UC may be associated to a selective dissolution of minerals as suggested by Barbieri et al. (2014). FeDit expresses the amount of iron in most crystallized minerals, whereas iron oxalate expresses the less crystallized minerals, which are smaller sizes and more reactive. Larger concentrations of acids in organic matter in soil under UC, indirectly expressed by the degree of humification, can promote a selective dissolution of minor minerals, causing prevalence of larger minerals expressed as FeDit.
Property Correlation Imp. Ord. Correlation Imp. Ord. Correlation Imp.
Ord.
OM 0.49 7 0.19 6 0.74 1
Total sand 0.93 1 -0.04 11 -0.03 9
Clay -0.64 6 -0.56 4 -0.23 3
FeDit -0.92 2 -0.12 7 0.16 5
MSADFE 0.36 8 -0.89 2 -0.12 6
MSTS 0.24 10 -0.89 3 0.01 11
MSClay 0.11 11 -0.92 1 0.06 8
Hum -0.88 3 -0.09 9 0.03 10
Micro 0.33 9 0.48 5 -0.63 2
PAvail 0.87 4 -0.07 10 0.07 7
Figure 4. Biplot graph of the management systems (UC and BC) for soil properties: FCO2 (CO2 emission); OM (organic matter); Sand (total sand content); Clay (clay content); FeDit (dithionite iron content); MSADFE (magnetic susceptibility in air
Rev. Caatinga
The highest magnetic values found in BC derive from the neo-transformation of iron oxide minerals with low or zero magnetic expression (e.g. hematite and goethite) into ferromagnetic minerals with higher magnetic expression (TORRENT; BARRÓN, 2010; LIU et al., 2012; BAHIA et al., 2015). Crop burning effect on soil genesis can be observed through significant values of MS in different soil fractions, mainly at clay fraction, in BC environment. Thus, our findings may complement those of Barbieri et al. (2013), indicating thus magnetic signature potential to identify areas with distinct selective dissolution and phosphorus availability. Moreover, the results here shown add on the results of Panosso et al. (2011), concluding that magnetic signature, expressed by MS, can assist in conversions of BC to UC, since areas of greater potential for greenhouse gas emissions can be highlighted, as demonstrated by Leal et al. (2015).
CONCLUSIONS
Magnetic signature, expressed by magnetic susceptibility, can be used to identify changes in physical, chemical and mineralogical traits of Latosols (Oxisols) under sugarcane harvested with and without previous burning, indicating changes in soil quality. These results may enable further studies on neo-formation of minerals with magnetic expression in Latosols (Oxisols) cropped and exposed to fire.
REFERENCES
BAHIA, A. S. R. S. et al. Field-scale spatial correlation between contents of iron oxides and CO2 emission in an Oxisol cultivated with sugarcane.
Scientia Agricola, Jaboticabal, v. 72, n. 2, p. 157-166, 2015.
BARBIERI, D. M. et al. Comportamento dos óxidos de ferro da fração argila e do fósforo adsorvido, em diferentes sistemas de colheita de cana-de-açúcar. Revista Brasileira de Ciência do Solo, Viçosa, v. 37, n. 6, p. 1557-1568, 2013.
BARBIERI, D. M. et al. Iron oxides and quality of organic matter in sugarcane harvesting systems. Revista Brasileira de Ciência do Solo, Viçosa, v. 38, n. 4, p. 1143-1152, 2014.
BARRIOS, M. R. et al. Magnetic susceptibility to identify landscape segments on a detailed scale in the region of Jaboticabal, São Paulo, Brazil. Revista Brasileira de Ciência do Solo, Viçosa, v. 36, n. 2, p. 1073-1082, 2012.
BARRÓN, V.; TORRENT, J. Iron, manganese and
aluminium oxides and oxyhydroxides. European Mineralogical Union Notes in Mineralogy, Reino Unido, v. 14, n. 9, p. 297-336, 2013.
CAMARGO, L. A. et al. Clay mineralogy and magnetic susceptibility of Oxisols in geomorphic surfaces. Scientia Agricola, Jaboticabal, v. 71, n. 3, p. 244-256, 2014.
CAMARGO, L. A. et al. Pedotransfer functions to assess adsorbed phosphate using iron oxide content and magnetic susceptibility in an Oxisol. Soil Use and Management, Oxford, v. 32, n.2, p. 172-182, 2016.
DEARING, J. A. Environmental magnetic susceptibility. Using the Bartington MS2 system. England: British Library, 1994, 104 p.
DIECKOW, J. et al. Land use, tillage, texture and organic matter stock and composition in tropical and subtropical Brazilian soils. European Journal of Soil Science, Oxford, v. 60, n. 2, p. 240-249, 2009.
DIÓGENES, L. C. et al. Microbial attributes and carbon and nitrogen stocks in Latosol under irrigated monocropping and intercropping. Revista Ciências Agrárias Amazonian Jounal of Agricultural and Environmental Sciences, Belém, v. 56, n. 2, p. 106-111, 2013.
DONAGEMA, G. K. et al. Manual de métodos de análise de solos. 2. ed. Rio de Janeiro, RJ: Embrapa Solos, 2011. 230 p.
HAIR JR., J. F. et al. Análise multivariada de dados. 5. ed. Porto Alegre, RS: Bookman, 2005. 593 p.
IMAZ, M. J. et al. Soil quality indicator response to tillage and residue management on semi-arid Mediterranean cropland. Soil & Tillage Research, Amsterdam, v. 107, n. 1, p. 17-25, 2010.
INSTITUTO DE PESQUISAS TECNOLÓGICAS DO ESTADO DE SÃO PAULO - IPT. Mapa geomorfológico do Estado de São Paulo. Escala: 1:1.000.000. 2. ed. São Paulo, SP: IPT, 1981, 70 p.
LEAL, F. T. et al. Characterization of potential CO2 emissions in agricultural areas using magnetic susceptibility. Scientia Agricola, Piracicaba, v. 72, n. 6, p. 535-539, 2015.
LIU, Q. et al. Environmental magnetism: principles and applications. Reviews of Geophysics, San Francisco, v. 50, n. 4, p. 1-50, 2012.
terrestrial loess and palaeosol sequences, in quaternary climates, environments and magnetism, Cambridge: University Press, 1999. p. 81.
MATIAS, S. S. R. et al. Ferramentas matemáticas, suscetibilidade magnética e modelos de paisagem aplicados na delimitação de áreas de manejo específico. Revista Brasileira de Ciência do Solo, Viçosa, v. 39, n. 4, p. 968-980, 2015.
MATIAS, S. S. R. et al. Modelos de paisagem e susceptibilidade magnética na identificação e caracterização do solo. Pesquisa Agropecuária Tropical, Goiânia, v. 43, n. 1, p. 93-103, 2013.
MATIAS, S. S. R. et al. Outlining precision boundaries among areas with different variability standards using magnetic susceptibility and geomorphic surfaces. Engenharia Agrícola, Jaboticabal, v. 34, n. 4, p. 695-706, 2014.
MEHRA, O. P.; JACKSON, M. C. Iron oxide removal from soil and clay by dithionite-citrate system buffered with sodium bicarbonate. In: NATIONAL CONFERENCE ON CLAY MINERALS, New York. 7., 1960.
MICHEL, F. M. et al. Ordered ferrimagnetic form of ferrihydrite reveals links between structure, composition and magnetism. Proceedings of the National Academy of Sciences of the United States of America – PNAS, New York, v. 107, n. 7, p. 2787–2792, 2010.
MILORI, D. M. B. P. et al. Organic matter study of whole soil samples using laser-induced fluorescence spectroscopy. Soil Science Society American Journal, Madison, v. 70, n. 1, p. 57-63, 2006.
PANOSSO, A. R. et al. Soil CO2 emission and its relation to soil properties in sugarcane areas under Slash-and-burn and Green harvest. Soil & Tillage Research, Amsterdam, v. 111, n. 2, p. 190-196, 2011.
RAIJ, B. VAN. Análise química para avaliação da fertilidade de solos tropicais. 1. ed. Campinas, SP: Instituto Agronômico, 2001. 285 p.
REYNOLDS, W. D. et al. Use of indicators and pore volume-function characteristics to quantify soil physical quality. Geoderma, Amsterdam, v. 152, n. 3-4, p. 252 – 263, 2009.
ROCKSTRÖM, J. et al. A safe operating space for humanity, Nature, Nova Iorque, v. 461, n. 24, p. 472-475, 2009.
SANTOS, H. G. et al. Sistema brasileiro de
classificação de solos. 3. ed. Brasília, DF: Embrapa, 2013. 353 p.
SANTOS, H. L. et al. Suscetibilidade magnética na identificação de compartimentos da paisagem em uma vertente. Revista Brasileira de Ciências Agrárias, Recife, v. 6, n. 4, p. 710-716, 2011.
SILVA JÚNIOR, J. F. et al. Classificação numérica e modelo digital de elevação na caracterização espacial de atributos dos solos. Revista Brasileira de Engenharia Agrícola e Ambiental, Campina Grande, v. 16, n.4, p. 415-424, 2012.
SIQUEIRA, D. S. et al. Correlation of properties of Brazilian Haplustalfs with magnetic susceptibility measurements. Soil Use Management, Amsterdam, v. 26, n. 2, p. 425-431, 2010.
SNEATH, P. H.; SOKAL, R. R. Numerical taxonomy: The principles and practice of numerical classification. San Francisco: W. H. Freeman, 1973. 573 p.
SPOKAS, K. et al. Black Earths (Terra Preta): Observations of wider occurrence from residual fire. In: Rattan Lal. (Eds.). Encyclopedia of Soil Science, Second Edition - Two-Volume Set Encyclopedia of Soil Science, Second Edition. 2. ed. North Andover, Massachusetts: Aries Systems Corporation, 2015, p. 1-4.
THOMPSON, R.; OLDFIELD, F. Environmental magnetism. London: Allen & Unwin, 1986. 227 p.
TORRENT, J.; BARRÓN, V.; LIU Q. S. Magnetic susceptibility changes in relation to pedogenesis in a Xeralf chronosequence in northwestern Spain. Geophysical Research Letters, Washington, v. 61, n. 3, p. 161-173, 2010.
VEROSUB, K. L.; ROBERTS, A. P. Environmental magnetism: past, present and future Journal of Geophysical Research, Washington, v. 100, n. 2 p. 2175–2192, 1995.