ARTIGO ORIGINAL ARTIGO ACEITE P ARA PUBLICAÇÃO DISPONÍVEL EM WWW .ACT AMEDICAPORTUGUESA.COM
Excess Mortality Estimation During the COVID-19
Pandemic: Preliminary Data from Portugal
Estimativa do Excesso de Mortalidade Durante a Pandemia
COVID-19: Dados Preliminares Portugueses
Paulo Jorge NOGUEIRA1,2,3,4, Miguel de Araújo NOBRE3,5,6, Paulo Jorge NICOLA3,5,7, Cristina FURTADO1,4,7,8,
António VAZ CARNEIRO1,3,5
Acta Med Port 2020 xxx;33(AOP):xxx-xxx ▪ https://doi.org/10.20344/amp.13928
ABSTRACT
Introduction: Portugal is experiencing the effects of the COVID-19 pandemic since March 2020. All-causes mortality in Portugal increased during March and April 2020 compared to previous years, but this increase is not explained by COVID-19 reported deaths. The aim of this study was to analyze and consider other criteria for estimating excessive all-cause mortality during the early COVID-19 pandemic period.
Material and Methods: Public data was used to estimate excess mortality by age and region between March 1 and April 22, proposing baselines adjusted for the lockdown period.
Results: Despite the inherent uncertainty, it is safe to assume an observed excess mortality of 2400 to 4000 deaths. Excess mortality was associated with older age groups (over age 65).
Discussion: The data suggests a ternary explanation for early excess mortality: COVID-19, non-identified COVID-19 and decrease in access to healthcare. The estimates have implications in terms of communication of non-pharmaceutical actions, for research, and to healthcare professionals.
Conclusion: The excess mortality occurred between March 1 and April 22 was 3 to 5 fold higher than what can be explained by the official COVID-19 deaths.
Keywords: Coronavirus; Coronavirus Infections; Disease Outbreaks; Mortality; Pandemics; Portugal RESUMO
Introdução: Desde março 2020, Portugal tem sofrido os efeitos da pandemia COVID-19. A mortalidade por todas as causas aumen-tou em março e abril de 2020 comparativamente a anos anteriores, mas este aumento não é explicado pelas mortes reportadas de COVID-19. O objetivo deste estudo foi analisar e considerar outros critérios para estimar o excesso de mortalidade durante a pande-mia COVID-19.
Material e Métodos: Utilizaram-se bases de dados públicas para estimar o excesso de mortalidade por idade e região entre 1 de março e 22 de abril, propondo níveis basais ajustados ao período de estado de emergência em vigor.
Resultados: Apesar da incerteza inerente, é seguro assumir um excesso de mortalidade observada de 2400 a 4000 mortes. O exces-so de mortalidade encontra-se asexces-sociado aos grupos etários mais idoexces-sos (idade superior a 65 anos).
Discussão: Os dados sugerem uma explicação tripartida para o excesso de mortalidade: COVID-19, COVID-19 não identificado e diminuição do acesso a cuidados de saúde. As estimativas efetuadas possuem implicações ao nível da comunicação de acções não farmacológicas, da investigação científica e dos profissionais de saúde.
Conclusão: Da análise dos resultados é possível concluir que o excesso de mortalidade ocorrido entre 1 de março e 22 de abril foi 3 a 5 vezes superior ao explicado pelas mortes por COVID-19 reportadas oficialmente.
Palavras-chave: Coronavírus; Infecções por Coronavírus; Mortalidade; Pandemia; Portugal; Surtos de Doenças INTRODUCTION
On March 2, 2020 the first infections by SARS-CoV-2 were reported in Portugal. Currently (April 22) 21982 infections and 785 deaths have occurred in individuals infected with the SARS-CoV-2 virus.1 Public health surveillance data
reg-istered 10096 deaths in all-causes mortality during March 2020,2 a significant increase compared to data from previous
years for the same period. This suggests potential excess mortality attributable to crisis conditions. The excess mortality observed is not explained by the number of official COVID-19 deaths during the same period.
The standard approach to calculate the expected number of deaths, in the absence of a given event of interest, uses the previous year’s historical data for the same period (either mean or median) as baseline reference.5 In the current
pan-demic situation, several studies and newspaper articles are using this approach. However, the current lockdown situation
1. Institute of Preventive Medicine and Public Health. Faculty of Medicine. University of Lisbon. Lisbon. Portugal. 2. Laboratory of Biomathematics. Faculty of Medicine. University of Lisbon. Lisbon. Portugal.
3. Institute for Evidence Based Health. Faculty of Medicine. University of Lisbon. Lisbon. Portugal. 4. Institute for Environmental Health. Faculty of Medicine. University of Lisbon. Lisbon. Portugal. 5. Cochrane Portugal. Lisbon. Portugal.
6. Stomatological University Clinic. Faculty of Medicine. University of Lisbon. Lisbon. Portugal.
7. Epidemiology Unit. Institute of Preventive Medicine and Public Health. Faculty of Medicine. University of Lisbon. Lisbon. Portugal. 8. National Institute of Health Dr. Ricardo Jorge. Lisbon. Portugal.
Autor correspondente: Paulo Jorge Nogueira. [email protected]
ARTIGO ACEITE P ARA PUBLICAÇÃO DISPONÍVEL EM WWW .ACT AMEDICAPORTUGUESA.COM
Our study consisted of the analysis of official public datasets, including on COVID-19. Using this methodology of anonymized public data dismissed the need of ethics committee approval. We retrieved, from the 1st March to the 22nd April 2020, data from public datasets on COVID-19 confirmed cases and mortality,3 distribution per district of COVID-19
confirmed cases,1 all-cause daily mortality (total, by age group and by district) available from the electronic surveillance
of mortality in real-time from the Portuguese e-Death Certification Information System (SICO/eVM),2 and access to
emer-gency services according to the Manchester Triage System.4
We herein considered the minimum observed mortality in the period, or what would be expected within one, three, or five months ahead as more plausible baselines for the current situation. In our analysis we also present the maximum observed mortality in the period, not because it is a good alternative, but because it may show clear excess mortality in the study period. Throughout our calculations up to March 11, any excess mortality was assumed to be zero. Baselines were obtained smoothing the respective mortalities series.
We calculated the excess mortality estimates considering Excess mortality (∑ observed – ∑ defined baseline) and Sum of Positive Excess Mortality (∑ [observed – defined baseline] when this difference is positive).
The estimation of excess mortality rates and COVID-19 mortality rates were performed by district of mainland Portugal, in absolute and relative terms, both per 100,000 inhabitants per district.
We estimated mortality due to reduction of daily-rate hospital Emergency Department (ED) visits between March 1 – April 22. We retrieved the data6 on ED visits according to the Manchester Triage System (MTS).7 The estimation was
performed in 3 steps: Step 1- for each MTS triage color, we calculated the 3-day average in the beginning of march (1st to
3rd of march); From day 3 onwards, within each MTS color, we calculated the difference between the number of each day
visits (3-day centered averages) and the 3-day average in the beginning of march (reference); Step 2- We calculated the total number of visits (difference between daily averages) corresponding to the sum of these daily differences, according to the MTS color; Step 3- The values obtained in step 2 for each MTS color were multiplied by the corresponding assumed death rates of 10.3% for MTS red color, 4% for MTS orange color and 0.00003% for MST yellow color,7 and the sum of
values represented the total number of potential deaths.
The estimates were performed using R software (version 3.4.4). Code is available upon request. RESULTS
First, we estimated the excess mortality from the 1st of March to the 22nd of April 2020 (Fig. 1). Results presented in Fig.
1A) show a sustained observed mortality above the usual and the new proposed alternative baselines during most of the month of March and April. Excess mortality seems associated with the increasing number of observed official COVID-19 deaths (Fig. 1B).
When excess mortality was calculated under mean and median usual standards, we observed a 2- to 3-fold increase in excess mortality accounted officially as COVID-19 deaths (Fig. 1B). In our proposed alternative baseline setting, this ex-cess mortality was remarkably higher, registering a 3.5- to 5-fold increase compared to the official COVID-19 mortality (Fig. 1B). Despite the inherent uncertainty, it is safe to assume an observed excess mortality of 2400 to 4000 deaths between March 1 and April 22.
Table 1 shows the estimation of excess mortality using all-cause mortality by age group and baseline mortality defini-tion. It can be observed that the estimated excess mortality is associated with the older age groups, with different baselines showing consistent results. Mortality in the younger age groups was, on average, below the proposed baselines, as hy-pothesized.
Our calculations indicate that the estimated excess mortality was associated with higher age groups (Fig. 1C), with the different baselines showing consistent results. Mortality in younger age groups was below average, and consistent with the different alternative baselines (see Table 1).
Considering the all-cause mortality by district of mainland Portugal (12 of 18 districts), some districts like Aveiro, Porto and Lisbon were characterized by a marked excess mortality (Fig. 2), meaning that in absolute terms, the estimated excess
ARTIGO ORIGINAL ARTIGO ACEITE P ARA PUBLICAÇÃO DISPONÍVEL EM WWW .ACT AMEDICAPORTUGUESA.COM
mortality is geographically superimposed with districts where more COVID-19 cases were observed and which are more densely populated (Fig. 3). In relative terms, estimated excess mortality seems overall homogeneous by district, tending to be higher in districts with older patients and lower population density (Fig. 4).
A considerable reduction in the daily-rate emergency department (ED) visits occurred between March 1 - April 22 with a cumulative daily average difference of -191,666 visits for patients with MTS red (n= -771 visits), orange (n= -30159 visits), and yellow colors (n= -160,736 visits) (Fig. 5). Taking into account that despite the lockdown patients still require access to urgent and emergency care, and assuming the proportions of short-term mortality occurring within the ED 24 - 48 hours after admission, we estimated a potential of, at least, 1291 deaths (MTS red color: 79 deaths; MTS orange color: 1206 deaths; MTS yellow color: six deaths) could have occurred between March 1 and April 22 2020 because of the reduction in ED visits (see Appendix 1: https://www.actamedicaportuguesa.com/revista/index.php/amp/article/view/13928/Appen-dix_01.pdf).
DISCUSSION
This paper represents one of the first attempts to present different comparative scenarios and estimates of excess mortality during the early stages of the COVID-19 pandemic in Portugal. This pandemic poses an unprecedented challenge to health systems globally, with a need to increase resource capacity across all health services, thus implying a significant healthcare burden with potential life threatening outcomes as reported in Italy and Spain. Despite the general perception that Portugal intervened rapidly to mitigate the COVID-19 effects, it is clear that none of the current monitoring instruments were prepared to perform with precision under lockdown conditions: the current monitoring instruments produce under-estimations of excess mortality given they were conceived assuming normal expected conditions (not accounting for the current special condition). Several studies were carried out under the same kind of assumptions, for example, a report produced by Statistics Portugal calculates the excess mortality in Portugal by Municipalities for March 2020, comparing only with March of 2018 and 2019,8 not considering the specific effect on the older age groups. Overall, this implies the
need for monitoring and surveillance instruments to be able to perform in scenarios like the current one.
The explanation for this increase in all-cause mortality that occurred in the over 65 age group appears ternary: (i) COVID-19; (ii) identified COVID-19; and (iii) decrease in access to healthcare. Considering that COVID-19 and non-identified COVID-19 increase mortality may be related to healthcare burden, the potential impact in all-cause mortality due to decrease in access to healthcare justifies a more thorough discussion. From the health services perspective, the focus on COVID-19 preparedness implied postponing programmed surgeries and outpatient consultations for a considerable number of patients with chronic conditions. Considering the public perspective, the announcement of the non-pharma-ceutical interventions taken by the government to control the epidemic (Fig. 1), largely disseminated by the media, might have triggered the public perception that healthcare visits should be avoided (due to concerns of potential infection from healthcare facilities). This is illustrated by the notorious reduction of more than 191,000 daily hospital ED visits occurred between March 1 - April 22, potentially impacting in 1291 or more deaths [Fig. 5 and Table in Appendix (see Appendix 1: https://www.actamedicaportuguesa.com/revista/index.php/amp/article/view/13928/Appendix_01.pdf)].
Nevertheless, the hypothesis of a potential mortality displacement effect10 should not be ruled out, given the minimum
registered number of deaths expected for February, while considering the absence of a significant seasonal influenza activ-ity11 and the warm temperatures experienced during this period.12 However, excess mortality occurred in the second half of
March, coincidental with the lockdown and persisting continuously since then. While lockdown measures do not promote the same behavior as summer vacation months, both situations result in lower mortality risk: In fact, the lowest mortality rates are observed during the summer months, and the aim of the lockdown is to reduce the health risks of citizens. It should be noted that the number of excess deaths observed has a much higher magnitude than the number of deaths in subjects infected with COVID-19. Of these deaths, only a certain proportion yet to be clearly defined will have died because of the infection. Therefore, at least in this early phase of the epidemic, it is unlikely that deaths due to known or unknown COVID-19 infections would account for the total observed excess mortality.
It is of interest to note that no excess mortality was observed in the under 55 year age group. In fact, this group re-mained around the average daily number of deaths observed in the past twelve years, including the summer months, and there was actually an improvement in the average number of deaths in the last two weeks (Fig. 1C). This suggests that mortality for the majority of the population (individuals below age 55) benefited from this lockdown period with a similar magnitude as during the summer holiday months, as hypothesized. However, and despite these conditions, excess mortal-ity was observed in the group above age 55, and in the elderly in particular.
The estimates of this paper imply a call for action with implications for policy, research, healthcare professionals (espe-cially family physicians and pharmacists) and the general public. For policy, it is important to clearly communicate that the announced non-pharmaceutical interventions should not preclude the access to healthcare services, especially for patients with chronic conditions and comorbidities, in order to prevent the increase in deaths for lack of access while attempting to focus on decreasing COVID-19 related deaths. District-level preparedness plans are important to prevent alarm and to avoid widespread fear, panic and overloading the healthcare system, but communication is paramount to deliver the
ARTIGO ACEITE P ARA PUBLICAÇÃO DISPONÍVEL EM WWW .ACT AMEDICAPORTUGUESA.COM causes of death. CONCLUSION
It is possible to conclude that there is evidence of excess mortality in Portugal between March 1 and April 22, 2020 during the COVID-19 lockdown even using the usual baselines (mean, median).
By adopting baselines more consistent with the lockdown, the excess mortality becomes more evident, with estimated 2400 to 4000 potential excess deaths during this period.
The observed excess of mortality is associated with older age groups (over age 65). The reduction of more than 191,000 daily hospital ED visits occurred between March 1 - April 22 may potentially be associated with 1291 or more deaths. Overall, these results point towards an excess mortality that is associated with and that is 3 to 5-fold higher than the official COVID-19 mortality.
ACKNOWLEDGEMENTS
This work was produced with the support of Infraestrutura Nacional de Computação Distribuída (INCD) [National In-frastructure for Distributed Computation] funded by the Fundação para a Ciência e Tecnologia (FCT) and FEDER under project 01/SAICT/2016 nº 022153.
PROTECTION OF HUMANS AND ANIMALS
The authors declare that the procedures were followed according to the regulations established by the Clinical Re-search and Ethics Committee and to the Helsinki Declaration of the World Medical Association.
DATA CONFIDENTIALITY
The authors declare having followed the protocols in use at their working center regarding patients’ data publication. CONFLICTS OF INTEREST
The authors declare they have no conflict of interest. FUNDING SOURCES
No funding was received for this study.
REFERENCES
1. Direção Geral da Saúde. Novo Coronavirus COVID-19, Relatório de situação nº 44 - 15/04/2020. Lisboa; 2020. DGS. [accessed 2020 April 12] Available from: https://covid19.min-saude.pt/wp-content/uploads/2020/04/44_DGS_boletim_20200415.pdf.
2. Direção Geral da Saúde (DGS). Lisboa: Sistema de Vigilância: SICO/eVM - Vigilância eletrónica de mortalidade em tempo real, versão 1.0.5.; [accessed 2020 April 7]. Available from: https://evm.min-saude.pt/#shiny-tab-a_total.
3. GitHub.com [homepage in the Internet]. Baltimore: Johns Hopkins University Center for Systems Science and Engineering (JHCSSE); Coronavirus COVID-19 (2019-nCoV) Data Repository; [accessed 2020 April 12]. Available from https://github.com/CSSEGISandData/COVID-19/tree/master/csse_ covid_19_data/csse_covid_19_time_series.
4. Powerbi.com.pt [homepage in the Internet]. Redmond: Microsoft Corporation: Power BI Platform; [accessed 2020 April 23]. Available from https://app. powerbi.com/w?r=eyJrIjoiZTVkZThjNDgtYTNiNC00Y2IwLTk2YzYtZTM2YTljZDUyMTQwIiwidCI6IjIyYzg0NjA4LWYwMWQtNDZjNS04MDI0LTYzY2M5N jJlNWY1MSIsImMiOjh9.
5. Nogueira PJ, Falcão JM, Contreiras MT, Paixão E, Brandão J, Batista I. Mortality in Portugal associated with the heat wave of August 2003: Early estimation of effect, using a rapid method. Euro Surveill. 2005;10:pii=553.
6. www.sns.gov [homepage in the Internet]. Lisboa: Serviço Nacional da Saúde (SNS); Portal da transparência; [accessed April 13, 2020]. Available from: https://transparencia.sns.gov.pt/explore/?sort=modified.
7. Martins HM, Cuña LM, Freitas P. Is Manchester (MTS) more than a triage system? A study of its association with mortality and admission to a large Portuguese hospital. Emerg Med J. 2009;26:183-186.
8. Instituto Nacional de Estatística (INE). Lisboa: Indicadores de contexto para a pandemia COVID-19 em Portugal. [accessed April 10, 2020]. Available from: https://www.ine.pt/ngt_server/attachfileu.jsp?look_parentBoui=427749220&att_display=n&att_download=y.
ARTIGO ORIGINAL ARTIGO ACEITE P ARA PUBLICAÇÃO DISPONÍVEL EM WWW .ACT AMEDICAPORTUGUESA.COM
9. Vieira A, Ricoca Peixoto V, Aguiar P, Abrantes A. Lisboa: Excesso de Mortalidade Em Portugal Em Tempos de Covid-19. [Accessed 2020 April 28]. Escola Nacional de Saúde Pública - Barómetro COVID-19; 2020. Available form: https://barometro-covid-19.ensp.unl.pt/excesso-de-mortalidade-em-portugal-em-tempos-de-covid-19/
10. Huynen M, Martens P, Schram D, Weijenberg MP, Kunst AE. The impact of heat waves and cold spells on mortality rates in the Dutch population. Environ Health Perspect. 2001;109:463-470.
11. Instituto Nacional de Saúde Doutor Ricardo Jorge I.P. (INSA). Lisboa: Boletim de Vigilância Epidemiológica da Gripe, Época 2019/2020, Semana 14. [accessed 2020 April 9]. Available from: http://www.insa.min-saude.pt/wp-content/uploads/2020/04/S14_2020.pdf.
12. Instituto Português do Mar e da Atmosfera I.P. (IPMA). Lisboa: Boletim Climatológico Fevereiro 2020. [accessed 2020 April 9]. Available from: http://www. ipma.pt/resources.www/docs/im.publicacoes/edicoes.online/20200317/YDtMPXJqwCRMxZXdHKhI/cli_20200201_20200229_pcl_mm_co_pt.pdf. 13. Ministério da Saúde (MS). Lisboa: Retrato da Saúde, Portugal. [accessed 2020 April 12]. Available from: https://www.sns.gov.pt/wp-content/
uploads/2018/04/RETRATO-DA-SAUDE_2018_compressed.pdf.
Table 1 – Calculation of excess mortality using all-causes mortality by age group, up to 22 April, 2020 75 +
age group age group65 + age group< 65 age group< 55 All ages
Baseline Exc1 Exc2 Exc1 Exc2 Exc1 Exc2 Exc1 Exc2 Exc1 Exc2
Minimum 2991.0 2991.0 3372.0 3372.0 458.0 467.0 233.0 249.0 4022.0 4022.0 Maximum 316.0 823.0 360.0 938.0 -382.0 50.0 -345.0 12.0 192.0 859.0 Median 1754.0 1784.0 1955.5 2006.5 55.5 164.0 -28.5 77.5 2323.0 2364.0 Mean 1683.0 1731.4 1896.6 1959.2 58.2 164.4 -19.4 80.8 1821.0 1881.8 Mean + 1 month 2427.8 2505.6 2703.2 2802.0 85.8 171.2 -19.6 78.0 2919.0 2827.0 Mean + 3 months 3264.4 3165.2 3642.2 3552.8 117.0 186.0 -13.0 84.0 4161.3 3773.2 Mean + 5 months 3364.2 3246.8 3796.8 3669.0 89.0 169.6 -26.2 74.8 3967.5 3783.0
Exc1: Excess mortality (∑ observed - ∑ defined baseline); Exc2: Sum of positive excess mortality (∑ [observed - defined baseline] when this difference is positive).
Note: Publicly available official cumulative COVID-19 deaths on April 22, 2020 by age groups: < 50 years: 9 deaths; 50 - 59 years: 20 deaths; 60 - 69 years: 67 deaths; 70 + years: 689 deaths.
ARTIGO ACEITE P ARA PUBLICAÇÃO DISPONÍVEL EM WWW .ACT AMEDICAPORTUGUESA.COM
Figure 1 – Evolution between March 1 and April 22, 2020. (A) All-cause mortality with indication of the main non-pharmaceutical interven-tions by the Portuguese Government in chronological order. All baselines were smoothed. Note the excess mortality from the second half of March onwards. (B) Cumulative excess mortality estimation compared with COVID-19 official mortality: Exc1 – Excess mortality: (∑ observed – ∑ defined baseline) on the left-hand side; Exc2 – Sum of Positive Excess Mortality: (∑ [observed – defined baseline] when this difference is positive) on the right-hand side. (C) Age-specific evolution of all-cause mortality. All baselines were smoothed. Note the excess mortality estimated for the 65+ age group.
B
ARTIGO ORIGINAL ARTIGO ACEITE P ARA PUBLICAÇÃO DISPONÍVEL EM WWW .ACT AMEDICAPORTUGUESA.COM
Figure 2 – Graphical illustration for district-specific distribution of all-cause mortality between March 6 - April 22, 2020, for Mainland Por-tugal Districts. Graphical comparison depicts observed mortality (magenta line), minimum baseline (red line), maximum baseline (orange line), mean baseline (yellow dashed line), median baseline (grey dashed line), mean + 1 month baseline (light blue dashed line), mean + 3 months baseline (dark blue dashed line) and mean + 5 months baseline (rose dashed line). Note some Districts (Aveiro, Porto, Lisbon) have marked excess mortality, while in other Districts mortality is around or below the proposed baselines.
ARTIGO ACEITE P ARA PUBLICAÇÃO DISPONÍVEL EM WWW .ACT AMEDICAPORTUGUESA.COM
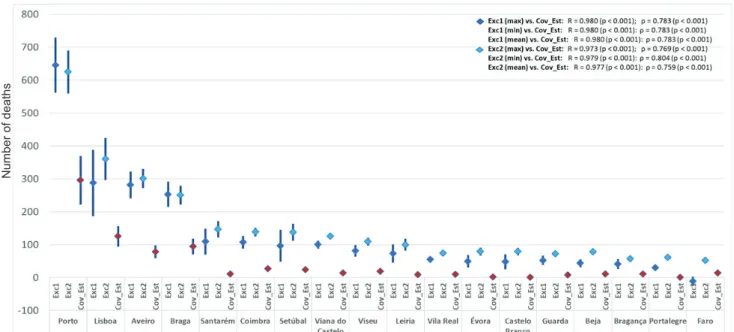
Figure 3 – Graphical representation of estimated excess mortality and COVID-19 estimated mortality in absolute terms. Vertical blue lines represent the distance between minimum and the maximum of estimated excess mortality calculated using 3 different baselines (mean + 1 month, mean + 3 months and mean + 5 months). COVID-19 [Cov_Est] mortality was estimated from municipal cases reported by DGS using three hypothetical death rates (3%, 4% and 5%).
R: Pearson correlation coefficient; Rho: Spearman correlation coefficient; Exc1: Excess mortality - (Σ observed – Σ defined baseline); Exc2: Sum of Positive Excess Mortality - (Σ [observed – defined baseline] when this difference is positive).
Figure 4 – Graphical representation of estimated excess mortality rates and COVID-19 estimated mortality rates in relative terms, both by 100,000 inhabitants per district. Vertical blue lines represent the distance between minimum and the maximum of estimated excess mortality calculated using 3 different baselines (mean + 1 month, mean + 3 months and mean + 5 months). COVID-19 [Cov_Est] mortality was estimated from municipal cases reported by DGS using three hypothetical death rates (3%, 4% and 5%).
R: Pearson correlation coefficient; Rho: Spearman correlation coefficient; Exc1: Excess mortality - (Σ observed – Σ defined baseline); Exc2: Sum of Positive Excess Mortality - (Σ [observed – defined baseline] when this difference is positive).
ARTIGO ORIGINAL ARTIGO ACEITE P ARA PUBLICAÇÃO DISPONÍVEL EM WWW .ACT AMEDICAPORTUGUESA.COM
Figure 5 – Emergency department visits between March 1 – April 22, 2020, in Portugal Mainland (counts, 3-day centered averages). Color lines according to the 5-point scale of the Manchester Triage System in crescent order of severity: Blue, Green, Yellow, Orange, Red.7
Triage color in the following way: for each triage color, we calculated the 3-day average in the
beginning of march (1
stto 3
rdof march) (Step 1). From day 3 onwards, within each color, we
calculated the difference between the number of each day visits (3-day centered averages) and
the 3-day average in the beginning of March (reference).
Step 2- The total number of visits presented in Table S1 (‘Difference between daily averages’)
corresponded to the sum of these daily differences, according to the triage color;
Step 3- The values obtained in step 2 for each Manchester Triage System color were multiplied
by the corresponding assumed death rate
1and the sum of values represented the number of
potential deaths (Table S1).
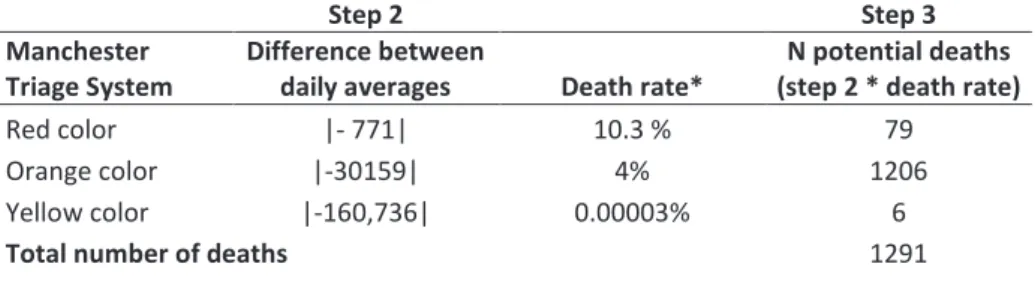
Table S1. Average difference in ED visits between March 1 and April 22, 2020,
in Mainland Portugal according to the Manchester Triage System.
Step 2 Step 3
Manchester
Triage System Difference between daily averages Death rate* (step 2 * death rate) N potential deaths
Red color |- 771| 10.3 % 79
Orange color |-30159| 4% 1206
Yellow color |-160,736| 0.00003% 6
Total number of deaths 1291
* Death rate per Manchester Triage System 1
Data for the remaining colors of the Manchester Triage System are not shown due to the non-significant contribution to the potential deaths
.
Considering the previous steps and assumptions, an estimate of at least 1291 deaths due to the
reduction in ED department visits between March 1 and April 22 could be hypothesized. These
potential 1291 deaths are considered to be an underestimation of the real number of deaths.
Supplemental References
1. Martins HM, Cuña LM, Freitas P. Is Manchester (MTS) more than a triage system? A study of its association with mortality and admission to a large Portuguese hospital. Emerg Med J 2009; 26: 183-186.
2. Serviço Nacional da Saúde (SNS). Portal da transparência. [accessed April 13, 2020] Lisbon: SNS; 2020. Available from: https://transparencia.sns.gov.pt/explore/?sort=modified.