UNIVERSIDADE DA BEIRA INTERIOR
Ciências Sociais e Humanas
The effect of Public Policies Supporting
Renewable energy: A comparative study of
installed capacity and electricity generation
Diogo André dos Santos Pereira
Dissertação para obtenção do Grau de Mestre em
Economia
(2º ciclo de estudos)
Orientador: Prof. Doutor António Manuel Cardoso Marques
Acknowledgments
This dissertation would not have been possible without the immeasurable support, comprehension and incentive of many people to whom I will be forever grateful. Without these contributions, the completion of this stage of my life not have been possible.
I would like to express my sincere gratitude to my supervisor Professor António Manuel Cardoso Marques, for his immeasurable guidance, unconditional support, and friendship. Her orientation and incentive to do a competent work and to improve my work skills were very important in the final results of this master thesis. Not to mention, all the five minutes outlays, I will always be grateful for having accepted guide and work with me since the first moment, and for all help and constant encouragements. I would also like to acknowledge to Professor José Alberto Serras Ferreira Rodrigues Fuinhas for his precious assistance, suggestions and incentive to increase and improve my econometric and economic skills, made throughout this dissertation, in order to improve this dissertation and refine my work skills. Not forgetting, I will always be grateful for all the jokes to decompress, camaraderie and friendship.
I would like to express my honest and greatest gratitude to my parents and sister for all their understanding, immeasurable support, and patience throughout the duration of my studies. Without their incentive to not waste my skills, and follow my dreams, the completion of this stage of my life not have been possible. I will never forget and I will be forever grateful for their help, affection and comprehension. Finally, special thanks also to my friends and to the friends I made in Covilhã who helped and supported me from the beginning, without them everything would be more difficult, and not least, less amusing.
iv
Resumo
A formulação e implementação de políticas de energia, nomeadamente as que focam o apoio às fontes de energia renováveis, é fundamental para enfrentar o grande desafio de conciliar o crescimento económico e o desenvolvimento sustentável. Esta dissertação foca-se nos 20 países com a maior produção de eletricidade através de energias renováveis, e usa uma base de dados de políticas públicas de apoio às renováveis desde 1971. Além disso, este estudo usa um período de tempo desde 1990 até 2014, sendo possível capturar os efeitos das políticas públicas e dos drivers que promovem a implementação de energias renováveis na sua fase de arranque. Esta dissertação contribui para a literatura devido a avaliar os efeitos das políticas públicas na geração de eletricidade e na capacidade instalada das fontes renováveis, agregadas e desagregadas pelas novas fontes de energias renovável. As características dos dados em painel exigem a utilização do estimador Driscoll-Kraay com efeitos fixos. Os resultados enfatizam que a implementação das fontes de energia renovável foi estabelecida essencialmente por políticas de incentivos financeiros e fiscais (policy-driven). No entanto, as políticas orientadas para estimular e regular o mercado (market-driven) demonstram ser eficientes na promoção das energias renováveis.
Palavras-chave
Políticas Públicas de Apoio às Renováveis, Fontes de Energia Renovável, Efeitos Dinâmicos de Painel, Estimador Driscoll-Kraay
Resumo Alargado
As políticas de apoio às renováveis (PPAR) são essenciais para lidar com as falhas no mercado de energia. Na verdade, as tecnologias de produção de eletricidade através de combustíveis fosseis não internalizam no seu preço os custos de poluição. É fundamental, nos sistemas electroprodutores, a mudança da sua produção de eletricidade através de combustíveis fosseis para a exploração das fontes de energia renovável (FER), para preservar o meio ambiente e para reduzir a dependência externa das fontes de eletricidade. Como é sabido, as FER implicam um grande investimento na sua fase inicial, devido à falta de progresso tecnológico e à insuficiência de know-how. Devido aos novos desenvolvimentos, as novas FER aumentaram a sua competitividade, ainda que as mesmas necessitem de intervenção pública. Apesar de alguns estudos empíricos recentes (por exemplo Aguirre and Ibikunle, 2014; Marques and Fuinhas, 2012; Polzin et al., 2015), a literatura que foca a relação entre as PPAR e a implementação de FER nos sistemas electroprodutores é essencialmente qualitativa e normativa ( por exemplo Abdmouleh et al., 2015; Gan et al., 2007), revelando um impacto positivo das PPAR na implementação de FER. Contudo, a literatura empírica (por exemplo Aguirre and Ibikunle, 2014; Marques and Fuinhas, 2012; Polzin et al., 2015) demonstra que as categorias e subcategorias das PPAR têm diferentes efeitos na implantação de FER nos sistemas electroprodutores. Por conseguinte, as conclusões alcançadas pela literatura estão longe de ser consensuais.
A avaliação das consequências das PPAR é crucial, dado que os governos têm de cumprir e satisfazer múltiplos objetivos. Por um lado, os governos devem manter e aumentar a implementação de FER nos sistemas electroprodutores nacionais. Por outro lado, os governos têm que implementar incentivos para aumentar a implantação de FER, e que os mesmos exijam menos recursos provenientes da economia. Visto que esses incentivos podem comprometer o crescimento económico como citado por alguns autores (por exemplo Al-mulali et al., 2014; Cowan et al., 2014; Marques and Fuinhas, 2015). Consequentemente, o equilíbrio desses objetivos é essencial na conceção de políticas de energia adequadas, e esta é a principal motivação para esta pesquisa. Por conseguinte, esta dissertação tem como objetivo prestar apoio, bem como discussão sobre a conceção e implementação adequada das PPAR para a implantação de FER, nos sistemas electroprodutores.
Esta dissertação utiliza um painel de dados anuais sobre os 20 países com a maior produção de eletricidade através de FER, e um intervalo de tempo desde 1990 até 2014. Tendo como objetivo a análise, através de uma abordagem dinâmica, dos efeitos das PPAR, nas suas diversas categorias e subcategorias, na capacidade instalada e na geração de eletricidade através das
vi FER, num formato agregado, e desagregadas pelas novas FER, nomeadamente a energia eólica e a solar fotovoltaica. Afim de avaliar a eficiência das PPAR na implementação de FER nos sistemas electroprodutores, fornecendo orientações para a conceção e afinação das PPAR, capazes de introduzir uma lógica de mercado e a autossustentabilidade das FER. Por um lado, os efeitos das PPAR na produção de eletricidade e na capacidade instalada serão avaliados em comparação. A fim de analisar se quando as PPAR têm um impacto positivo na capacidade instalada esse se traduz num aumento de geração de eletricidade através das FER. Por outro lado, serão também avaliados em comparação os efeitos das PPAR no formato agregado das FER, na energia eólica e no solar fotovoltaico, a fim de analisar se as mesmas têm efeitos específicos para as diversas tecnologias de exploração das FER.
Foram aplicados vários testes de especificação aos modelos, nomeadamente, de existência de efeitos de painel, de presença de efeitos individuais contra efeitos aleatórios, de heterocedasticidade, de auto correlação de primeira ordem, de dependência de secção transversal e de heterogeneidade do painel de dados. Como observado pelos testes de especificação, o estimador Driscoll and Kraay com efeitos fixos e a utilização do modelo ARDL (autoregressive distributed lag) demonstraram-se adequados para lidar com o painel de dados. Em geral, todos os modelos suportam a cointegração, dado que o mecanismo e correção de erro é negativo e significante a 1%. Na verdade, este estudo enfatiza a relevância da utilização do modelo ARDL, separando os efeitos, em efeitos de curto e de longo prazo. Do mesmo modo, a robustez dos resultados é realçada através das elevadas elasticidades observadas, devido às mesmas serem compatíveis com a fase de arranque, o período em analise, da implementação das FER. Em suma, os resultados mostram que os investimentos diretos, os instrumentos regulatórios e as abordagens voluntárias foram ineficazes na promoção das FER nos sistemas electroprodutores. No entanto, os incentivos financeiros e fiscais, os instrumentos baseados no mercado e as políticas de informação e educação foram eficazes na implementação das FER nos sistemas electroprodutores.
A literatura não é consensual na discussão dos diversos efeitos dos incentivos financeiros e fiscais. Todavia, os resultados, desta categoria de PPAR, demonstrados nesta dissertação também não o são. No entanto, é de destacar os efeitos das tarifas feed-in e das políticas de benefícios fiscais na implementação de energia solar fotovoltaica e eólica, respetivamente. De facto, as tarifas feed-in estão em linha com a preferência dos investidores, garantindo-lhes um preço fixo e prioridade de despacho para a eletricidade gerada. Do mesmo modo esta subcategoria de incentivos financeiros e fiscais juntamente com as políticas de empréstimos, estimularam os consumidores a serem produtores, através da instalação de painéis fotovoltaicos em suas casas. Contrariamente, os projetos de energia eólica implicam um grande investimento inicial, e as reduções e isenções fiscais são as políticas que mais têm aumentado a implementação de energia eólica. Em virtude destes resultados demonstrados podemos concluir que as PPAR têm efeitos distintos nas FER. Todavia, os incentivos financeiros e fiscais dependem
diretamente dos orçamentos públicos, por conseguinte, esta dependência pode implicar uma carga excessiva para as economias. Contrariamente, as políticas orientadas para o mercado e os instrumentos regulatórios, nomeadamente aqueles que incorporam os Renewable Standard Portfolio, têm um efeito positivo na implementação das FER. Na verdade, estas abordagens não garantem um preço fixo, mas impõem limites mínimos na geração de eletricidade através de FER e limites máximos nas emissões de dióxido de carbono. Sendo que o preço dos mesmos é delineado pela oferta e pela procura de mercado. De tal forma que, as políticas orientadas para o mercado têm impulsionado a implementação de FER nos sistemas electroprodutores e aumentado a competitividade das mesmas no mercado da energia.
Em suma, os instrumentos orientados para o mercado e os incentivos fiscais, conjuntamente, têm impulsionado a implementação da energia solar fotovoltaica. Mas, a promoção da energia eólica apenas tem sido realizada através de investimentos diretos dos governos e incentivos financeiros e fiscais. De tal forma que, estas políticas podem ter aumentado a pressão sobre as economias e ter um influencia negativa no mercado de energia, dado que o preço da eletricidade gerada através da energia eólica é independente do preço de eletricidade do mercado. Os resultados provam que um mix de políticas orientadas para o mercado e incentivos financeiros e fiscais têm aumentado a implementação da energia solar fotovoltaica nos sistemas electroprodutores. Consequentemente, os resultados sugerem que é essencial ajustar as políticas de mercado, para as mesmas tenham um efeito desejado na implementação de energia eólica. De modo que, a produção de eletricidade através de energia eólica diminua o seu custo de implementação e aumente a sua competitividade no mercado de eletricidade.
Abstract
The design of energy policies, namely those focused on supporting renewable energy sources is crucial for facing the major challenge of combining economic growth and sustainable development. This paper focuses on the 20 countries with the highest electricity production from renewables, and uses a database of policies since 1971. In addition, this paper uses a time-span from 1990 until 2014, which makes it possible to capture the effects of public policies and the drivers that promote renewable energy implementation, in its take-off phase. The paper contributes to the literature by assessing the effects of public policies supporting renewables on both aggregated renewable sources and individual new renewables. Moreover, it contributes by appraising how public policies are influencing both electricity generation and the installed capacity of renewable sources. The characteristics of the panel data require the use of the Driscoll-Kraay estimator with fixed effects to handle them. The results emphasize that the implementation of renewable energy sources has been established essentially by policy-drivers, but that market-drivers are able to promote renewable energy deployment.
Keywords
Public Policies Supporting Renewables, Renewable Energy, panel dynamic effects, Driscoll-Kraay estimator.
Index
1. Introduction 1
2. Policies to promote RES implementation 4
3. Data and methodology 11
4. Results and discussion 16
5. Conclusions 21
References 23
Figures list
Figure 1. - Installed capacities of renewables energies sources excluding hydro in Megawatts Figure 2. - Installed capacity of RES and public policies supporting renewables
Figure 3. - RES use and public policies supporting renewables.
Figure 4. - Summary of the estimated effects on wind power of the PPSR and the other drivers Figure 5 - Summary of the estimated effects on solar PV of the PPSR and the other drivers
Tables List
Table 1. - PPSR categorization of Global Energy Policies and Measures Table 2. - Data: definition, sources and descriptive statistics
Table 3. - Cross section dependence test Table 4. - Specification tests
Table 5. - Elasticities and adjustment speed Table A.1. - Unit root tests
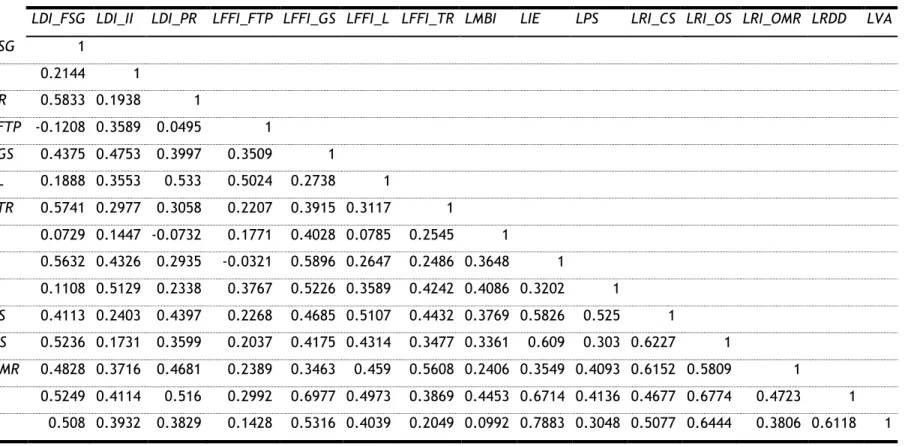
Table A.2.1. - Correlation matrices with variables in level Table A.2.2. - Correlation matrices with variables in level
Table A.3.1. - Correlation matrices with variables in first differences Table A.3.2. - Correlation matrices with variables in first differences Table A.4. - Estimation results
Table A.5. -- Estimation results of RES_EG model Table A.6. - Estimation results of RES_IC model Table A.7. - Estimation results of WIND_EG model Table A.8. - Estimation results of WIND_IC model Table A.9. - Estimation results of SOLPV_EG model Table A.10. - Estimation results of SOLPV_IC model
Acronyms list
GRP Gabinete de Relações Públicas
UBI Universidade da Beira Interior
PPAR Políticas de Apoio ás Renováveis
FER Fontes de Energia Renovável
ARDL Autoregressive Distributed Lag
PPSR Public Policies Supporting Renewables
RES Renewable Energy Sources
PV Photovoltaic
IEA International Energy Agency
DI Direct Investment
FFI Fiscal/Financial Incentives
MBI Market-based Instruments
INFE Information and Education
PS Policy Support
RDD Research, Development and Deployment
VA Voluntary Approaches
RI Regulatory Instruments
DI_PR Procurement Rules
DI_II Infrastructure Investment
DI_FSG Funds to Sub-national Governments
FFI_FTP Feed-in Tariffs/Premiums
FFI_GS Grants and Subsidies
FFI_L Loans
FFI_T Taxes
FFI_TR Tax Relief
RI_CS Codes and Standards
RI_OS Obligation Schemes
RI_OMR Other Mandatory Requirements
RPS Renewable Standard Portfolio
KGOE Kilograms of oil equivalent
MW Megawatts
Mt Million tonnes
ECM Error Correction Mechanism
VIF Variance Inflation Factor
MG Mean Group
PMG Pooled Mean Group
DFE Dynamic Fixed Effects
FE Fixed Effects
1. Introduction
Public Policies Supporting Renewables (PPSR) are designed mainly to deal with energy market failures. Indeed, it is well-known that, in general, fossil fuels do not incorporate pollution costs in their price. The shift from fossil fuels towards Renewable Energy Sources (RES) in the domestic electricity mix is a major step in preserving the environment and reducing the external dependence of electricity sources. As is also well-known, RES imply a large amount of investment in their initial phase. The new renewable sources are already finding ways to make themselves competitive, but they need public intervention (Johnstone et al., 2010; Polzin et al., 2015).
Evaluating the consequences of PPSR is clearly crucial, given that governments are attempting to meet multiple objectives. On the one hand, they must keep the deployment of RES within the domestic electricity mix. On the other hand, they have to find incentives that require fewer resources from the economy as a whole. In fact, these incentives may even compromise economic growth (Al-mulali et al., 2014; Cowan et al., 2014; Lin and Moubarak, 2014; Marques and Fuinhas, 2015). In short, the balance of these two factors is essential in designing appropriate energy policies, and this is the main motivation for this research. Therefore, this paper aims to provide support, as well as to discuss the appropriate design of PPSR for the deployment of renewables.
Despite some recent empirical studies (e.g. Aguirre and Ibikunle, 2014; Marques and Fuinhas, 2012; Polzin et al., 2015), the literature focused on the relationship between PPSR and RES deployment is mainly qualitative and normative (e.g. Abdmouleh et al., 2015; Bird et al., 2005; Gan et al., 2007; Harmelink et al., 2006; Zhao et al., 2013), and reveals a positive impact of PPSR on RES implementation. However, empirical literature (e.g. Aguirre and Ibikunle, 2014; Carley, 2009; Johnstone et al., 2010; Marques and Fuinhas, 2012; Menz and Vachon, 2006; Polzin et al., 2015) demonstrates differing effects of PPSR subcategories on RES deployment. Moreover, the conclusions reached by the literature are far from consensual. Therefore, this research uses an annual panel data based on the 20 countries with the highest electricity production using RES and a time span from 1990 until 2014. The policy framework and the economic resources of the countries under analysis are quite different. Accordingly, this panel allows assessing the level of renewables deployment in countries with both different frameworks of policies and diverse incentives to support renewable energies. In addition, the use of this time-span makes it possible to cover: (i) the oil price boom and the financial crisis; (ii) the take-off phase of implementing renewables; (iii) the most recent RES deployments and investments (from 2012 onward), stimulated by social and political pressure for the development of cleaner energies in the countries with the greatest investment in RES. The database of policy-related variables has been collected starting from the date of the first implemented policy, i.e., from 1971, thus allowing it to be considered more disaggregated.
2 The assessment of the apportionment of short- and long-run effects, thus provides a deeper understanding of the dynamic relationship between policies and RES deployment. Indeed, this apportionment is important for understanding the different effects of policy-based and market-based factors on RES deployment. The main advantage of the policy-market-based approach is the long term certainty of receiving support, which may significantly reduce investment risk and create a basis for long term investment planning. In fact, the policy-based approach enables early market diffusion of less mature and more expensive technologies, through the differentiation of tariffs and reduction of taxes according to the RES technology supported. Consequently, the policy-based approach gives larger benefits to investors, i.e., it pays a higher-than-market price for the electricity generated. Therefore, this approach allows investors to cover their costs and earn a reasonable return on investments, while consumers have to pay a higher price for the electricity, directly or indirectly (through tax payments).
In contrast, the market-based approaches are oriented toward the markets, based on the interaction between the supply and demand of certificates and quota obligations. Indeed, this type of approach increases market competition for RES technologies, and encourages the expansion of the most efficient RES technologies. However, market imperfections can lead to markets only supporting lower-cost technologies, due to the price of green and white certificates, and quota obligations that are difficult to predict and that are determined by the most expensive technology sold in the market. Price uncertainty, including the possibility that it could be zero, leads to large capital losses for the investors. Indeed, the prices of market-based instruments can lead to a higher risk level for investors, and consequently, to a lesser availability of capital for investments (Zamfir et al., 2016). In summary, market-based instruments appear to be less effective than policy-based approaches, but they can lead to the desired level of RES penetration on the market with greater cost efficiency. Nonetheless, policy-based instruments have successfully supported RES in the initial phases of their implementation, due to the low risk of investments.
The main objective of this paper is to analyse, though a dynamic approach, the effects of PPSR, in various categories and subcategories, on installed capacity and on electricity generation by RES in an aggregated format, and in a disaggregated format for new sources of renewable energies, namely wind power and solar photovoltaic (PV). Therefore, this paper makes it possible to assess the efficiency of PPSR and to provide guidelines to the design and fine-tuning of a PPSR mix capable of introducing market logic and self-sustainability for these sources of energy. On the one hand, the effects of PPSR on electricity production and on installed capacity will be evaluated in comparison, in order to analyse if, when PPSR has a positive impact on installed capacity, it also increases electricity generation. On the other hand, the effects of the PPSR on aggregated renewables, on wind power, and on solar PV will be assessed in comparison, in order to analyse the specific technological effects of PPSR.
Both panel data estimators and co-integration/long memory are pursued and discussed, specifically when dealing with the heterogeneity of the panel and the country specific effects. The comprehensive analysis of the impacts of PPSR on RES implementation requires an econometric technique that takes into consideration both short- and long-run effects, and the data requires the use of the Driscoll-Kraay estimator with fixed effects to handle the data features.
The analysis proves that PPSR stimulate the implementation of RES. However, technologically specific policies have differing effects on the deployment of wind power and solar PV. Carbon dioxide emissions proved to be an incentive to promote wind power. However, the intensity of fossil fuels on the economy is ineffective in promoting RES deployment.
In addition to this introduction, the remainder of this paper is structured as follows: Section 2 explains the role and definition of each category and subcategory of PPSR, as well a brief discussion of results in the literature. Section 3 presents the data and describes the methodology. Both the results and their interpretation are discussed in Section 4. Lastly, Section 5 presents the conclusions.
4
2. Policies to promote RES implementation
This study uses the PPSR categorization of Global Energy Policies and Measures Data Base of International Energy Agency (IEA). Both their categories and subcategories are displayed and explained in Table 1. According to the IEA criteria, the categories of PPSR are: Direct Investment (DI); Fiscal/Financial Incentives (FFI); Market-based Instruments (MBI); Information and Education (INFE); Policy Support (PS); Research, Development and Deployment (RDD); Voluntary Approaches (VA); and Regulatory Instruments (RI).
Table 1. PPSR categorization of Global Energy Policies and Measures
Category Subcategory Description
Direct Investment
(DI)
The creation of necessary conditions and framework to encourage the initial
investments, through direct public
intervention. Procurement Rules
(DI_PR) The preference of public entities for purchasing renewable energy and services.
Infrastructure Investment (DI_II)
The creation of necessary conditions to implement RES, such as grid access.
Funds to
Sub-national Governments (DI_FSG)
The preference to support RES projects in disadvantaged regions or with endogenous resources to explore RES.
Fiscal/Financial
Incentives (FFI)
Non-market based instrument to reduce the burden of initial investments on RES implementation, and to stimulate RES research and development.
Feed-in
Tariffs/Premiums (FFI_FTP)
Guarantees the access and dispatch to RES supplies, offering a fixed and guaranteed price for the generated electricity.
Grants and
Subsidies (FFI_GS)
Monetary assistance that does not need to
be repaid.
It is granted for the specific purpose of an eligible RES project.
Loans (FFI_L)
Government ensured financing of RES projects and companies, with a long-term commitment, in regional or national financial institutions.
Taxes (FFI_T)
Tax credit based on the amount of investment in a RE facility or the amount of energy that it generates in the relevant year.
Tax Relief (FFI_TR) Tax exception or reduction to projects and companies investing in renewables-related goods and services.
Market-Based
Instruments (MBI)
State tools to ensure electricity generation through RES, which can be traded between players.
Information and
general public of energy usage or emissions performance.
Policy Support (PS) Strategic development and the creation of specific plans that guide policy
bodies to support a policy. Research,
development and
deployment (RDD)
Support of technological advancement, through direct investment, or facilitation of investment, in technology research and development.
Voluntary
Approaches (VA)
Tracks the measures that are undertaken voluntarily either by public agents or by the private sector, unilaterally or bilaterally.
Regulatory
Instruments (RI) Codes Standards (RI_CS) and Covers a wide range of instruments a government uses to impose targets,
obligations and standards on actors, requiring them to undertake specific
measures and report on specific
information. Obligation Schemes (RI_OS) Other Mandatory Requirements (RI_OMR)
Note: Own elaboration, inspired by (Abdmouleh et al., 2015; International Renewable Energy Agency, 2012).
In the last few years, the literature focused on the relationship between PPSR and RES has disclosed different effects of PPSR on the deployment of RES. The most remarkable results are: (i) the positive influence of Renewable Standard Portfolio (RPS) policies on wind power and on the share of electricity generation through RES (Carley, 2009; Menz and Vachon, 2006); (ii) the dissimilar results of fiscal/financial incentives. Marques and Fuinhas (2012) found a positive influence on the contribution of renewables to energy supply, conversely, Aguirre and Ibikunle (2014) found a negative impact on the growth of renewables; and (iii) Polzin et al. (2015) used the FFI in their subcategories and found a positive influence for feed-in tariffs and premiums in adding to the installed capacity of wind power and solar PV, although, Johnstone et al. (2010) showed that feed-in tariffs have a negative impact on wind power patent activity, but, have a positive impact on solar PV patent activity.
From 1990 until 2004 the increase of installed capacity of RES has been slow, because of the technologies development and the policies supporting renewables, an increase of installed capacities of RES has been noticeable from 2004 (see Fig. 1). Indeed, only since 2004 is distinguishable the strategy of each country to increase the exploitation of RES and reduce their energy dependence. Canada, China, Denmark, Spain, Finland, India, Mexico, Poland, Portugal and Sweden have deployed large amounts of installed capacity of wind power, but not have increased their installed capacity of solar PV. However, Australia, Belgium, Germany, France, United Kingdom, Italy, Netherlands, United States have increased their installed capacity of both the wind power and solar PV, although, Belgium, Italy, Japan have increased more the Installed capacity of solar PV than the wind power.
6 0 2,000 4,000 6,000 8,000 10,000 1990 1995 2000 2005 2010 Australia 0 1,000 2,000 3,000 4,000 5,000 6,000 1990 1995 2000 2005 2010 Belgium 0 4,000 8,000 12,000 1990 1995 2000 2005 2010 Canada 0 50,000 100,000 150,000 1990 1995 2000 2005 2010 China 0 20,000 40,000 60,000 80,000 1990 1995 2000 2005 2010 Germany 0 1,000 2,000 3,000 4,000 5,000 6,000 1990 1995 2000 2005 2010 Denmark 0 10,000 20,000 30,000 1990 1995 2000 2005 2010 Spain 0 200 400 600 800 1990 1995 2000 2005 2010 Finland
0 5,000 10,000 15,000 1990 1995 2000 2005 2010 France 0 5,000 10,000 15,000 20,000 1990 1995 2000 2005 2010 United Kingdom 0 5,000 10,000 15,000 20,000 25,000 30,000 1990 1995 2000 2005 2010 India 0 10,000 20,000 30,000 1990 1995 2000 2005 2010 Italy 0 4,000 8,000 12,000 16,000 20,000 24,000 28,000 1990 1995 2000 2005 2010 Japan 0 1,000 2,000 3,000 4,000 1990 1995 2000 2005 2010 Mexico 0 1,000 2,000 3,000 4,000 5,000 1990 1995 2000 2005 2010 Netherlands 0 1,000 2,000 3,000 4,000 1990 1995 2000 2005 2010 Poland
8 Figure 1. Installed capacities of renewables energies sources excluding hydro in Megawatts
The Fig. 2 shows chronologically the evolution of PPSR, for the level of installed capacity of RES, in 1996, 2004, 2008 and 2014, and for the level of installed capacity of both wind power and solar PV in the final year of the sample (2014). It can be observed an increase of public policies implemented to support the RES deployment, while it is observed the deployment of RES. 0 1,000 2,000 3,000 4,000 5,000 6,000 1990 1995 2000 2005 2010 Portugal 0 1,000 2,000 3,000 4,000 5,000 6,000 1990 1995 2000 2005 2010 Sweden 0 20,000 40,000 60,000 80,000 100,000 1990 1995 2000 2005 2010
Installed capacity of RES excluding hydro Installed capacity of wind power
Installed capacity of solar PV
United States aus can chn deu esp fra gbr ita jpn mex nld prt swe usa 0 2 4 6 8 10 12 In st a lle d ca p a ci ty o f R ES 5 10 15 20 25 30 35 40 45 50 55 PPSR 1996 aus bel can chn deu dnk esp fin fra gbr ind ita jpn mex nld pol prt swe usa 0 2 4 6 8 10 12 In st a lle d ca p a ci ty o f R ES 5 10 15 20 25 30 35 40 45 50 55 PPSR 2004
Figure 2. Installed capacity of RES and public policies supporting renewables. Countries Australia (AUS), Belgium (BEL), Canada (CAN), China (CHN), Germany (DEU), Denmark (DEN), Spain (ESP), Finland (FIN), France (FRA), United kingdom (GBR), India (IND), Italy (ITA), Japan (JPN), Mexico (MEX), Netherlands (NLD), Poland (POL), Portugal (PRT), Sweden (SWE) and United States (USA).
A first visual inspection of Fig. 2 suggests that the number of PPSR implemented increases the amount of RES deployed, but in some countries this is not demonstrated. Indeed, Germany has a similar level of RES deployment of the United States, with fewer policies implemented and with a different strategy, increasing the implementation of both the wind power and the solar PV. However, China, since 2004 increased the number of PPSR, implemented, consequently, it went from countries group with a less installed capacity of RES for the group with more RES implementation. Furthermore, it is worth highlighted that the increased of PSSR number do not increase, similarly, the installed capacity of both the wind power and solar PV. Therefore, it can be concluded that countries apply the PPSR to a specific technology.
aus bel can chn deu dnk esp fin fra gbr ind ita jpn mex nld pol prt swe usa 0 2 4 6 8 10 12 In st a lle d ca p a ci ty o f R ES 5 10 15 20 25 30 35 40 45 50 55 PPSR 2008 aus bel can chn deu dnk esp fin fra gbr ind ita jpn mex nld pol prt swe usa 0 2 4 6 8 10 12 In st a lle d ca p a ci ty o f R ES 5 10 15 20 25 30 35 40 45 50 55 PPSR 2014 aus bel can chn deu dnk esp fin fra gbr ind ita jpnmex nldpol prt swe usa 0 2 4 6 8 10 12 In st a lle d ca p a ci ty o f w in d p o w e r 5 10 15 20 25 30 35 40 45 50 55 PPSR 2014 aus bel can chn deu dnk esp fin fra gbr ind ita jpn mex nld prt swe usa 0 2 4 6 8 10 12 In st a lle d ca p a ci ty o f so la r PV 5 10 15 20 25 30 35 40 45 50 55 PPSR 2014
10 Figure 3. RES use and public policies supporting renewables. Countries Australia (AUS), Belgium (BEL), Canada (CAN), China (CHN), Germany (DEU), Denmark (DEN), Spain (ESP), Finland (FIN), France (FRA), United kingdom (GBR), India (IND), Italy (ITA), Japan (JPN), Mexico (MEX), Netherlands (NLD), Poland (POL), Portugal (PRT), Sweden (SWE) and United States (USA).
Due to the intermittency phenomenon, the installed capacity of RES cannot correspond to the effective generation capacity. Therefore, the necessity of study the PPSR effects in both the installed capacity and the capacity effectively used (electricity generated). Indeed, the Fig. 3. shows the PPSR for the level of use of RES, in 2014. After a visual inspection of Fig. 2 and 3, it can be concluded that the PPSR have a similar effect on the installed capacities of RES and on the electricity generation from RES.
In general, all countries have increased the RES deployment through PPSR implementation, but the figures also suggest that the explanation of both the installed capacity of RES and the electricity generation from RES must be assessed within a context of other drivers towards RES deployment. aus bel can chn deu dnk esp fin fra gbr ind ita jpn mex nld pol prt swe usa 0 5 10 15 20 25 El e ct ri ci ty g e n e ra tio n f ro m R ES 5 10 15 20 25 30 35 40 45 50 55 PPSR 2014 aus bel can chn deu dnk esp fin fra gbr ind ita jpnmex nld pol prt swe usa 0 5 10 15 20 25 El e ct ri ci ty g e n e ra tio n f ro m w in d p o w e r 5 10 15 20 25 30 35 40 45 50 55 PPSR 2014 aus bel can chn deu dnk esp fin fra gbr ind ita jpn mex nld pol prt swe usa 0 5 10 15 20 25 El e ct ri ci ty g e n e ra tio n f ro m so la r PV 5 10 15 20 25 30 35 40 45 50 55 PPSR 2014
3. Data and methodology
This paper uses annual frequency data for a panel of countries, from the beginning of wind power and solar PV implementation (1990), until the last year for which the data is available (2014), thus it has used all available information. As stated before, the criteria for the selection of the countries is that their electricity production has the highest deployment of renewable sources, namely Australia, Belgium, Canada, China, Denmark, Finland, France, Germany, India, Italy, Japan, Mexico, Netherlands, Poland, Portugal, Spain, Sweden, United Kingdom and United
States1. We intend to assess the effects of PPSR when examining the RES in either an aggregated
or disaggregated format for the new sources of generation. To do that, six models were carried out with the dependent variables indicated as follows:
• Model RES_EG – electricity generation through RES excluding hydro (DLGEG_RES);
• Model RES_IC – installed capacity of RES excluding hydro (DLCAP_RES);
• Model WIND_EG – electricity generation through wind power (DLGEG_WIND);
• Model WIND_IC – installed capacity of wind power (DLCAP_WIND);
• Model SOLPV_EG – electricity generation through solar PV (DLGEG_SOL);
• Model SOLPV_IC – installed capacity of solar PV (DLCAP_SOL).
Following the literature, this paper controls the other drivers of RES and policy-related variables, as discussed below. Table 2 lists the definition of variables, sources and descriptive statistics. The prefixes “L” and “D” denote the natural logarithms and the first differences of logarithms, respectively.
Table 2. Data: definition, sources and descriptive statistics
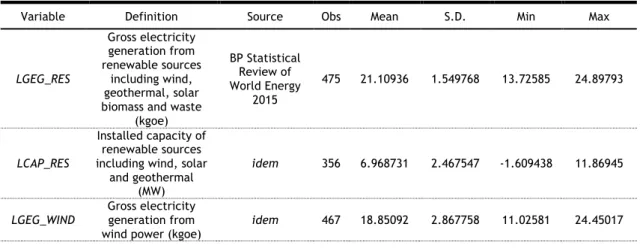
Variable Definition Source Obs Mean S.D. Min Max
LGEG_RES Gross electricity generation from renewable sources including wind, geothermal, solar biomass and waste
(kgoe) BP Statistical Review of World Energy 2015 475 21.10936 1.549768 13.72585 24.89793 LCAP_RES Installed capacity of renewable sources including wind, solar
and geothermal (MW)
idem 356 6.968731 2.467547 -1.609438 11.86945
LGEG_WIND Gross electricity generation from
wind power (kgoe) idem 467 18.85092 2.867758 11.02581 24.45017
12
LCAP_WIND installed capacity of Logarithm of
wind power (MW) idem 342 6.848448 2.351075 0.6931472 11.64928
LGEG_SOLAR Gross electricity generation from
solar PV (kgoe) idem 403 15.88722 2.824093 7.724336 22.79061
LCAP_SOLAR Installed capacity of solar PV (MW) idem 321 4.078564 2.812935 -1.609438 10.55059
LOIL economy (kg/2005 Oil intensity on U.S. dollars GDP) BP Statistical Review of World Energy/World Data Bank 475 -2.709295 0.4243617 -3.64057 -1.542425
LCOAL economy (kgoe/2005 Coal intensity on
U.S. dollars GDP) idem 475 -3.545482 1.241482 -5.567009 -0.0057675
LGAS
Natural gas intensity on economy (kgoe/2005 U.S.
dollars GDP)
idem 468 -3.679467 0.799652 -7.527457 -2.397641
LCO2 Carbon dioxide emissions (Mt) BP Statistical Review of
World Energy 475 26.77218 1.431722 24.42697 29.90942
LGDP product (2005 U.S. Gross domestic dollars per capita)
World Data
Bank 475 9.867202 1.171716 5.98734 10.83358
LDI_FSG ANPM – funds to sub-national governments
IEA policies and measures
database 475 0.0829502 0.285623 0 1.94591
LDI_II infrastructure ANPM –
investments Idem 475 0.0909984 0.2644739 0 1.098612
LDI_PR ANPM – procurement
rules Idem 475 0.0839216 0.2384819 0 1.098612
LFFI_FTP tariffs/premiums ANPM – feed-in Idem 475 0.386236 0.6513364 0 2.302585
LFFI_GS ANPM –grants and subsidies Idem 475 0.6375805 0.7184789 0 2.639057
LFFI_L ANPM - loans Idem 475 0.1751727 0.3971497 0 1.791759
LFFI_TR ANPM – tax relief Idem 475 0.4063223 0.5839833 0 2.397895
LMBI ANPM – market based instruments Idem 475 0.1791381 0.417487 0 1.791759
LIE ANPM – information and education Idem 475 0.2122854 0.5076168 0 2.772589
LPS ANPM – policy support Idem 475 0.4822872 0.6613716 0 2.833213
LRI_CS ANPM – codes and standards Idem 475 0.2397924 0.4432486 0 2.197225
LRI_OS ANPM – obligation schemes Idem 475 0.2307238 0.4011441 0 1.94591
LRI_OMR ANPM – other mandatory
requirements Idem 475 0.3310364 0.4975556 0 2.197225
LRDD development and ANPM –research,
deployment Idem 475 0.4050879 0.6280229 0 2.70805
LVA ANPM – voluntary approaches Idem 475 0.1456572 0.3553106 0 2.079442 Note: ANPM – Accumulated Number of Policies and Measures
The literature (Eberhardt, 2011; Hoechle, 2007) advises paying attention both to the nature of variables and to the idiosyncrasies of the countries under analysis when adopting an empirical approach with a macro panel. It is well-known that cross section dependence is a common occurrence. The Pesaran (2004) cross section dependence test, the CD-test (Table 3), was performed and strongly supports the presence of cross section dependence in all variables.
Table 3. Cross section dependence test
Variables CD-test Corr Abs (corr)
LGEG_RES 46.26*** 0.936 0.936 LGEG_WIND 46.65*** 0.945 0.945 LGEG_SOLAR 45.68*** 0.924 0.924 LCAP_RES 46.79*** 0.947 0.947 LCAP_WIND 46.65*** 0.945 0.945 LCAP_SOLAR 45.88*** 0.928 0.928 LOIL 57.74*** 0.898 0.898 LCOAL 27.63*** 0.43 0.759 LGAS 3.02*** 0.044 0.498 LCO2 14.23*** 0.218 0.547 LGDP 58.67*** 0.909 0.909
Notes: Cd-test has N(0,1) distribution, under the H0: cross section independence. *** denotes significance at 1% level.
The first generation unit roots tests were performed, namely LLC (Levin et al., 2002), ADF-Fisher (Maddala and Wu, 1999) and ADF-Choi (Choi, 2001). Moreover, as a consequence of the CD-test results, the second generation unit root test CIPS (Pesaran, 2007) was also performed, as this test has the advantage of being robust in the presence of cross section dependence. The Table A.1 shows the first and second generation unit root tests. Accordingly, the CIPS test proves that all variables are I(1) in their levels, except for LGEG_WIND that could be a borderline I(0)/I(1), in accordance with the first generation unit root tests.
In pursuing the main objective of this paper, the dynamic analysis of PPSR effects on RES implementation, an autoregressive distributed lag (ARDL) models has been used. The general ARDL model is specified as follows (eq. 1).
∆"#= %&+ (&)∆*#+ %)& "#+,+ %-& *#+,
.
,/) .
,/)
+ 0&,#, (1)
where ∆"# is the vector of the dependent variables, ∆*# is the vector of the independent
variables, (&) is the semi-elasticities, %)& is the error correction mechanism (ECM), %-& is the
elasticities, 0&,# is the error term and %& is the intercept. Consequently, it becomes possible to
breakdown the total effect into short- and long-run. Accordingly, the variables included in the models are in natural logarithms, and in first differences of logarithms, their coefficients are elasticities and semi-elasticities. Furthermore, this model is robust in the presence of variables I(0), I(1), or borderline. This feature allows variables with long memory patterns to be handled appropriately. Indeed, the literature shows that the ARDL model has consistent and efficient parameters estimates (Berk and Yetkiner, 2014; Fuinhas et al., 2015; Papageorgiou et al., 2016).
14 Both correlation of coefficients and the variance inflation factor (VIF) statistics were computed for all models. The low correlation values (see tables A.2 and A.3) and the low VIF statistics strongly support the idea that multicollinearity is far from being a concern in all models. This being a macro panel with policy-related variables, best practices for econometric techniques suggest assessing the cross sectional heterogeneity of the panel. Both the Mean Group (MG) and Pooled Mean Group (PMG) were applied. Indeed, the MG estimator is the most flexible estimator if the long-run average coefficients are consistent, but it is inefficient where there is a slope of homogeneity (Shin et al., 1999).
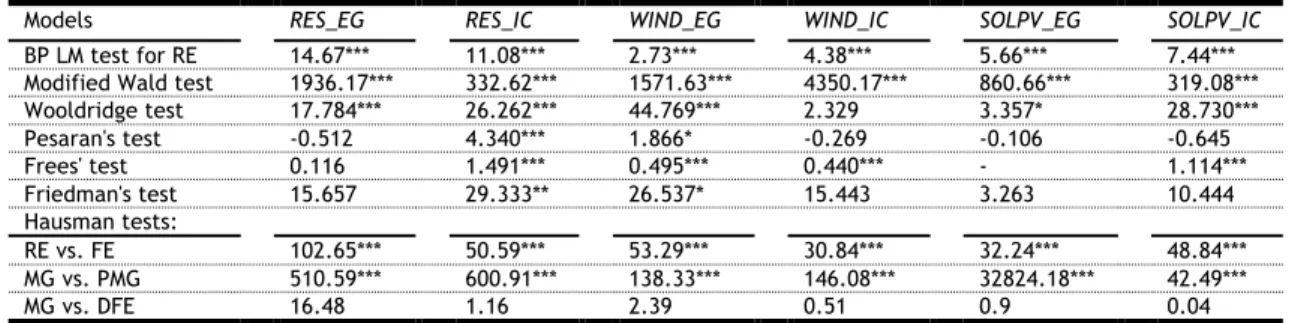
Following this, a battery of model specification tests were performed. Table 4 presents the tests: (i) the Breusch and Pagan LM test for random effects (Breusch, T. S. Pagan, 1980) to test the existence of panel effects; (ii) the modified Wald statistics for GroupWise heteroskedasticity (Greene, 2003); (iii) the Wooldridge test for serial correlation (Drukker, 2003); (iv) the test of cross sectional dependence of Pesaran (2004) , Frees (1995) , and Friedman (1937); (v) the Hausman test, Fixed Effects (FE) vs. Random Effects (RE), that tests for the presence of individual effects against random effects; and (vi) the tests to assess the panels for heterogeneity of countries, the Hausman tests by comparing the PMG vs. the MG estimators, and the MG vs. the Dynamic Fixed Effects (DFE) estimators.
Table 4. Specification tests
Models RES_EG RES_IC WIND_EG WIND_IC SOLPV_EG SOLPV_IC
BP LM test for RE 14.67*** 11.08*** 2.73*** 4.38*** 5.66*** 7.44*** Modified Wald test 1936.17*** 332.62*** 1571.63*** 4350.17*** 860.66*** 319.08*** Wooldridge test 17.784*** 26.262*** 44.769*** 2.329 3.357* 28.730*** Pesaran's test -0.512 4.340*** 1.866* -0.269 -0.106 -0.645 Frees' test 0.116 1.491*** 0.495*** 0.440*** - 1.114*** Friedman's test 15.657 29.333** 26.537* 15.443 3.263 10.444 Hausman tests: RE vs. FE 102.65*** 50.59*** 53.29*** 30.84*** 32.24*** 48.84*** MG vs. PMG 510.59*** 600.91*** 138.33*** 146.08*** 32824.18*** 42.49*** MG vs. DFE 16.48 1.16 2.39 0.51 0.9 0.04
Notes: ***, **, * denote significance at 1%, 5% and 10% level, respectively; the BP LM test for RE results
for H0: the variances across entities are zero; the modified Wald test has 22 distribution and test H0:
34-= 3-, for c=1,…,N; the Wooldridge test is normally distributed N(0,1) and tests H0: no serial
correlation; Pesaran’s, Frees’ and Friedman’s test the H0: residuals are not correlated; Hausman results for H0: difference in coefficient is not systematic including the constant.
The specification tests points to the presence of: (a) heteroskedasticity in all models; (b) panel autocorrelation in all but the WIND_IC model; (c) contemporaneous correlation in all except the RES_EG and SOLPV_EG models; and (d) homogeneity of cross sections. Accordingly, the prevalence of a homogeneous panel indicates that the countries share common coefficients and are suitable for treatment as a group. These results could be interpreted as evidence that globalization and international commitments, such as the Kyoto Protocol and EU Directives, have shaped identical measures for the countries. As noted by specification tests, the Driscoll
and Kraay (1998) estimator with fixed effects proved to be appropriate for handling these data features. Additionally, as a benchmark, the results of FE estimator with conventional standard errors, robust standard errors, autocorrelation and with dynamic fixed effects was compared with the results of Driscoll and Kraay estimator to control the presence of heteroskedasticity, contemporaneous correlation, and cross-sections dependence (see Tables A.5, A.6, A.7, A.8, A.9 and A.10 in appendix).
16
4. Results and discussion
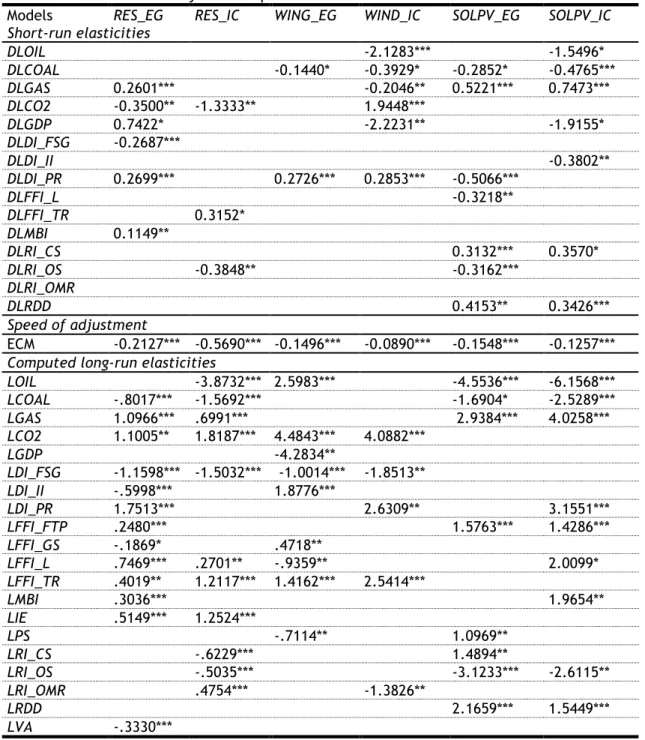
Table 5 discloses the semi-elasticities (short-run) and the elasticities (long-run) for each model. These elasticities are computed from the estimated models, which are displayed in Table A.2, by dividing the coefficient of the variables by the coefficient of ECM both lagged once, and then multiplying by -1. On the whole, all models support co-integration / long memory, given that the ECM is negative and highly statistically significant. In fact, this emphasizes the relevance of using the ARDL approach. It is worthwhile to note that the high elasticities observed are compatible with the take-off phase that renewables’ technology experienced, precisely during the time span under analysis. This evidence is an additional proof of robustness of the results. As further evidence of results robustness, the results of Driscoll and Kraay estimator are compared with the results of the FE estimator with conventional and robust standard errors, and with autocorrelation and dynamic fixed effect. In general, the models keep the robustness among the estimators for all coefficients (see Tables A.5 to A.10 in appendix).
The results show that direct investments, regulatory instruments and voluntary approaches are ineffective for promoting both electricity generation and installed capacity of RES (models RES_EG and RES_IC). In contrast, fiscal/financial incentives, market-based instruments, information and education, are effective for RES deployment. However, it is worth noting and comparing the results of the policies and the drivers on promoting the deployment of wind power and solar PV. The effects of PPSR and the other drivers on wind power and solar PV deployment can be observed in a summary form in Fig. 4 and 5 respectively. These results are compared with literature in order to provide specific indications and implications to assist policymakers in designing and fine-tuning their policies.
Wind power plant projects are large in scale, and funding arranged at regional, local or municipal levels have not produced the desired effect in implementing wind power. In contrast, “infrastructure investments” are an effective policy instrument for promoting electricity generation using wind power. Indeed, wind power plants are located in isolated areas and require road access and connection to the grid, which implies large investments by governments. The purchase of renewable energy and services by public entities has proven effective in promoting installed capacity of both wind power and solar PV. In fact, this policy instrument has always fostered competition to encourage low-cost installations of RES.
Table 5. Elasticities and adjustment speed
Models RES_EG RES_IC WING_EG WIND_IC SOLPV_EG SOLPV_IC
Short-run elasticities DLOIL -2.1283*** -1.5496* DLCOAL -0.1440* -0.3929* -0.2852* -0.4765*** DLGAS 0.2601*** -0.2046** 0.5221*** 0.7473*** DLCO2 -0.3500** -1.3333** 1.9448*** DLGDP 0.7422* -2.2231** -1.9155* DLDI_FSG -0.2687*** DLDI_II -0.3802** DLDI_PR 0.2699*** 0.2726*** 0.2853*** -0.5066*** DLFFI_L -0.3218** DLFFI_TR 0.3152* DLMBI 0.1149** DLRI_CS 0.3132*** 0.3570* DLRI_OS -0.3848** -0.3162*** DLRI_OMR DLRDD 0.4153** 0.3426*** Speed of adjustment ECM -0.2127*** -0.5690*** -0.1496*** -0.0890*** -0.1548*** -0.1257***
Computed long-run elasticities
LOIL -3.8732*** 2.5983*** -4.5536*** -6.1568*** LCOAL -.8017*** -1.5692*** -1.6904* -2.5289*** LGAS 1.0966*** .6991*** 2.9384*** 4.0258*** LCO2 1.1005** 1.8187*** 4.4843*** 4.0882*** LGDP -4.2834** LDI_FSG -1.1598*** -1.5032*** -1.0014*** -1.8513** LDI_II -.5998*** 1.8776*** LDI_PR 1.7513*** 2.6309** 3.1551*** LFFI_FTP .2480*** 1.5763*** 1.4286*** LFFI_GS -.1869* .4718** LFFI_L .7469*** .2701** -.9359** 2.0099* LFFI_TR .4019** 1.2117*** 1.4162*** 2.5414*** LMBI .3036*** 1.9654** LIE .5149*** 1.2524*** LPS -.7114** 1.0969** LRI_CS -.6229*** 1.4894** LRI_OS -.5035*** -3.1233*** -2.6115** LRI_OMR .4754*** -1.3826** LRDD 2.1659*** 1.5449*** LVA -.3330***
Notes: ***, **, * denote significance at 1%, 5% and 1% level, respectively.
According to the literature (Aguirre and Ibikunle, 2014; Marques and Fuinhas, 2012; Polzin et al., 2015), the results prove that there are negative and positive effects of fiscal/financial incentives, but the results prove that the majority of their subcategories have positive effects. Of note in this category are the effects of FIT/premiums and tax relief to promote solar PV and wind power respectively. Indeed, FITs are in line with investors’ preferences, guaranteeing a price for the electricity generated and dispatch priority order. Furthermore, this policy instrument has also stimulated consumers to be producers, through the installation of solar PV panels in their homes (International Renewable Energy Agency, 2012). They produce and consume their own electricity or sell it to the grid with the benefit of a guaranteed price. In
18 fact, this influence is shown by the positive effect of loans. Although this policy instrument is statistically significant at only 10%, it is designed to help consumers to invest and implement solar PV panels in their homes. Even though wind power projects imply a large initial investment, tax exemptions and reductions encourage large investments in wind power plants. These policy instruments have been drivers for the deployment of renewables, besides being more effective for this specific technology, but they are directly dependant on public budgets and this dependence can lead to an excessive burden on economies (Bird et al., 2005; Carley, 2009; Marques and Fuinhas, 2012; Menz and Vachon, 2006).
In contrast with these types of approach, the market-driven approach, using measures such as codes and standards, are the subcategory of regulatory instruments that incorporate Renewables’ Standard Portfolio policies. Actually, this approach does not guarantee a fixed price but imposes a minimum limit on electricity generation through RES. Furthermore, the policy instruments that incorporate green and white certificates are intended to make the electricity market more competitive, as the price of RES generation depends on the demand and supply of greenhouse gas licences, and imposes quota obligations for RES production (Menanteau et al., 2003; Ringel, 2006).
Figure 4 Summary of the estimated effects on wind power of the PPSR and the other drivers.
The policy-based measures that are independent from the electricity market, such as FIT and tax exemptions, can influence the market prices in ways that are different from market-based instruments such as RPS and green and white certificates. The producers that benefit from direct or indirect investment by governments are usually separate from price fluctuations in markets. Indeed, they have no incentive to bid in the market because they will receive a fixed price or a tax reduction and they have a dispatch priority order, which can influence the market prices. Despite this, market-driven instruments are exposed to market prices. Producers bid in electricity market and receive the market price of the electricity generated in addition to the
Funds to Sub-national Governments
Loans
Policy Support
Other Mandatory Requirements
Oil, Coal and Gas Intensity (short-run)
Gross Domestic Product
Infrastructure Investments
Procurement Rules
Grants and Subsidies
Tax Relief
Oil Intensity (long-run)
Carbon Dioxide Emissions
Wind
value of green and white certificates or quota obligations. However, these policies increase the risk for investors due to the price volatility of both electricity and market instruments, and thus may have an impact on the deployment of RES. Indeed, this market-driver can be seen as a booster of RES implementation. Indeed, its positive effect is shown in both the short- and long-run on RES production and installed capacity of solar PV.
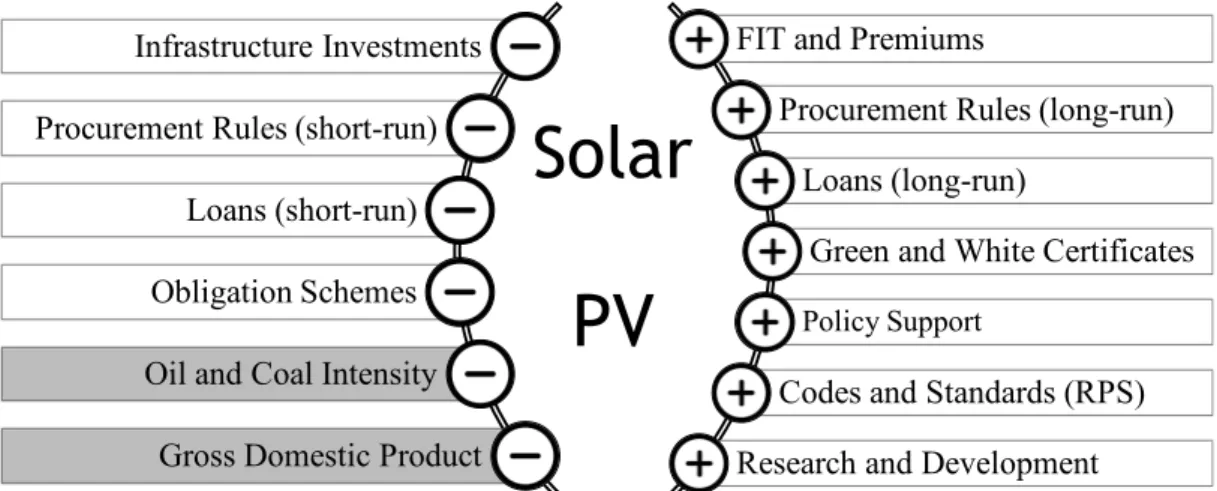
Figure 5 Summary of the estimated effects on solar PV of the PPSR and the other drivers.
Focusing, once again on solar PV results, the positive effect of research, development and deployment can be seen in both the short- and long-run. In fact, solar PV technologies have undergone great technological development, mainly since 2004 when they increased their efficiency by 16% (International Renewable Energy Agency, 2012).
Policies to promote public and stakeholder knowledge and awareness are effective in encouraging RES deployment. While, the creation of specific bodies and guidance in policy development are effective for promoting solar PV generation they are ineffective in promoting wind power. In contrast, carbon dioxide emissions constitute a strong incentive to invest in wind power. Indeed, the results demonstrate that carbon dioxide emissions and the intensity of natural gas in an economy are the only drivers that have a positive effect in both the short- and long-run on the deployment of wind power and solar PV, respectively. However, the majority of results show that fossil fuel intensity in economies is ineffective for promoting RES. This effect is quoted by some authors (Aguirre and Ibikunle, 2014; Marques et al., 2010). The proportion of electricity generated from fossil fuel sources delays the commitment to RES in the short-run, but in the long-run oil intensity in an economy has a positive effect on wind power deployment. This effect was due to high oil prices, which consequently, encouraged the shift from oil towards RES. It is worth stressing that natural gas is not a heavy polluter and remains as a back-up to RES, mainly solar PV. However, gross domestic product has been ineffective in encouraging the deployment of RES. This unexpected effect could be explained
Infrastructure Investments
Procurement Rules (short-run)
Loans (short-run)
Obligation Schemes
Oil and Coal Intensity
Gross Domestic Product
FIT and Premiums
Procurement Rules (long-run)
Loans (long-run)
Green and White Certificates
Policy Support
Codes and Standards (RPS)
Research and Development
Solar
20 by the financial crisis and the oil price boom, as mentioned by some authors (Al-mulali et al., 2014; Cowan et al., 2014; Lin and Moubarak, 2014; Marques and Fuinhas, 2015).
In summary, the results indicate that policies implemented for a specific technology are effective for RES deployment. However, policymakers have continued to implement market-driven policies to foster competition and encourage lower-costs installations of RES.
Indeed, market-driven policies are shown to boost implementation of solar PV but not wind power, because this technology is mostly implemented through direct investments and financial support. However, policy-driven approach has a positive effect on RES implementation, mainly wind power. These policies could increase the burden on economies and negatively influence the electricity market, given that wind power generation is independent of the electricity market price. In contrast, the mix of market-driven and policy-driven approaches has a positive effect on solar PV, and encourages consumers to become producers, interacting directly with the electricity market and making the economies more dynamic. In short, a mix of market-driven and policy-market-driven approaches requires fewer resources from the whole economy, and can make RES and the electricity market more competitive. Indeed, the results of solar PV have demonstrated that a mix of policy and market driven approaches is favourable for increasing the deployment of RES.
5. Conclusions
This research is focused on the 20 countries with the highest electricity production using RES, for the time span from 1990 until 2014. It adds a new empirical evaluation considering both short- and long-run components to assess the effectiveness of PPSR on RES deployment. The ARDL models are often applied disregarding the possibility of heterogeneity of crosses. However, the results showed that policies towards renewables are similar among the countries, given their obligations to meet international commitments. A battery of model specification tests were made and the Driscoll and Kraay estimator with fixed effects was selected as the most suitable estimator to handle panel data features. It is worth highlighting that the additional robustness of the models can be assessed by the high elasticities observed, because they are compatible with the take-off phase experienced by renewable technologies.
The comparative analysis of PPSR effects on RES deployment were made in two ways: (i) comparing the effectiveness of PPSR on RES installed capacity and electricity generation under RES; and (ii) comparing the effectiveness of PPSR on the RES aggregately, and individually on the new renewable sources, such as wind power and solar PV. Technologically specific policies have been more effective and, generally, so have policies that affect the installed capacity. Consequently, they have had the same effect on electricity generation. Overall, the results seem robust and suggest that the framework and implementation of policies can be changed so that economic growth is not compromised and RES can become competitive through their inherent strengths without relying on any externalities.
The dynamic analysis proves that some PPSR have not been drivers for the deployment of RES. Measures such as funds to sub-national governments, obligation schemes, and other mandatory requirements and loans have not yet produced the desired effects on RES deployment in the short-run. In contrast, the results reveal that procurement rules, infrastructure investments, grants and subsidies, tax relief, FIT and premiums, green and white certificates, codes and standards (RPS) and research and development policies have been effective in RES deployment. In addition, PPSR are not equally effective for wind and solar PV. The deployment of wind power sources has been established essentially based on policy-driven approaches rather than on market-driven instruments. In contrast, solar PV deployment has been achieved by a mix of policy and market driven instruments. Research and development policies have been important to solar PV deployment, as well as FIT, premiums and loans. Indeed, this policy not only supports the investments of big players, but encourages consumers to become producers and consequently interact directly in the energy markets. Moreover, market-based instruments, such as green and white certificates and codes and standards, have boosted electricity generation from solar PV sources and consequently increased their installed capacity. Despite this, the results showed that this type of policy is ineffective for implementing wind power. Indeed, this lack of effectiveness requires the attention of policymakers to design and
fine-22 tune market-driven instruments to integrate wind power more fully into the market and reduce the burden on economies caused by supporting wind power through policy-based instruments. Carbon dioxide emissions have been a driver for the deployment of wind power, but the intensity of fossil fuels have not. Indeed, the deployment of wind power has been established mainly by reducing the risk of investment, which may have reduced the competitiveness of this technology.
The intensity of fossil fuels in economies and carbon dioxide emissions are in line with the literature, namely validating the existence of lobbying in delaying the deployment of RES and confirming that natural gas, being a less-polluting energy source, can lead to the intermittency of RES and thus hamper RES deployment. It was also found that either gross domestic product did not play an important role in encouraging RES deployment, or that this effect was due to the period in analysis including the effects of the oil price boom and the financial crisis. Overall, the results seem robust and suggest that the deployment of solar PV has been established through a mix of policy- and market-driven approaches and that wind power was established essentially through direct subsidies and public intervention. It is essential to adjust market-based policies to produce desirable effects on wind power deployment, and decrease the burden on the cost of energy for economies. At the same time, this will make wind power more competitive in the market and, consequently, decrease the costs of implementation. Further research is needed to help design and fine-tune the policy-based approach, in order to produce the desired effects in the shortest time and at the lowest cost for society. Furthermore, it is necessary to help fine-tune market-based instruments, without causing market failures, to foster competition and encourage a less-costly installation of RES.
References
Abdmouleh, Z., Alammari, R. a. M., Gastli, A., 2015. Review of policies encouraging renewable energy integration & best practices. Renew. Sustain. Energy Rev. 45, 249–262. doi:10.1016/j.rser.2015.01.035
Aguirre, M., Ibikunle, G., 2014. Determinants of renewable energy growth: A global sample analysis. Energy Policy 69, 374–384. doi:10.1016/j.enpol.2014.02.036
Al-mulali, U., Fereidouni, H.G., Lee, J.Y.M., 2014. Electricity consumption from renewable and non-renewable sources and economic growth: Evidence from Latin American countries. Renew. Sustain. Energy Rev. 30, 290–298. doi:10.1016/j.rser.2013.10.006
Berk, I., Yetkiner, H., 2014. Energy prices and economic growth in the long run: Theory and evidence. Renew. Sustain. Energy Rev. 36, 228–235. doi:10.1016/j.rser.2014.04.051 Bird, L., Bolinger, M., Gagliano, T., Wiser, R., Brown, M., Parsons, B., 2005. Policies and market
factors driving wind power development in the United States. Energy Policy 33, 1397– 1407. doi:10.1016/j.enpol.2003.12.018
Breusch, T. S. Pagan, A.R., 1980. The Lagrange Multiplier Test and its Applications to Model Specification in Econometrics. Rev. Econ. Stud. 47, 239 – 253.
Carley, S., 2009. State renewable energy electricity policies: An empirical evaluation of effectiveness. Energy Policy 37, 3071–3081. doi:10.1016/j.enpol.2009.03.062
Choi, I., 2001. Unit root tests for panel data. J. Int. Money Financ. 20, 249–272. doi:10.1016/S0261-5606(00)00048-6
Cowan, W.N., Chang, T., Inglesi-Lotz, R., Gupta, R., 2014. The nexus of electricity consumption, economic growth and CO2 emissions in the BRICS countries. Energy Policy 66, 359–368. doi:10.1016/j.enpol.2013.10.081
Driscoll, J.C., Kraay, A.C., 1998. Consistent Covariance Matrix Estimation with Spatially Dependent Panel Data. Rev. Econ. Stat. 80, 549–560.
Drukker, D.M., 2003. Testing for serial correlation in linear panel-data models. Stata J. 3, 168– 177.
Eberhardt, M., 2011. Panel time-series modeling: New tools for analyzing xt data.
24 doi:10.1016/0304-4076(94)01658-M
Friedman, M., 1937. The use of ranks to avoid the assumption of normality implicit in the
analysis of variance. J. Am. Stat. Assoc. 32, 675–701.
doi:10.1080/01621459.1937.10503522
Fuinhas, J.A., Marques, A.C., Couto, A.P., 2015. Oil-Growth Nexus in Oil Producing Countries: Macro Panel Evidence. Int. J. Energy Econ. Policy 5, 148–163.
Gan, L., Eskeland, G.S., Kolshus, H.H., 2007. Green electricity market development: Lessons from Europe and the US. Energy Policy 35, 144–155. doi:10.1016/j.enpol.2005.10.008 Greene, W.H., 2003. Econometric Analysis, Journal of the American Statistical Association.
Prentice Hall. doi:10.1198/jasa.2002.s458
Harmelink, M., Voogt, M., Cremer, C., 2006. Analysing the effectiveness of renewable energy supporting policies in the European Union. Energy Policy 34, 343–351. doi:10.1016/j.enpol.2004.08.031
Hoechle, D., 2007. Robust standard errors for panel regressions with cross-sectional dependence. Stata J. 7, 281–312.
International Renewable Energy Agency, 2012. Handbook on Renewable Energy Nationally Appropriate Mitigation Actions for Policy Makers and Project Developers 1–56.
Johnstone, N., Haščič, I., Popp, D., 2010. Renewable energy policies and technological innovation: Evidence based on patent counts. Environ. Resour. Econ. 45, 133–155. doi:10.1007/s10640-009-9309-1
Levin, A., Lin, C.-F., Chu, C.-S.J., 2002. Unit Root Tests in Panel Data: Asymptotic and Finite Sample Properties. J. Econom. 108, 1–24.
Lin, B., Moubarak, M., 2014. Renewable energy consumption – Economic growth nexus for China. Renew. Sustain. Energy Rev. 40, 111–117. doi:10.1016/j.rser.2014.07.128
Maddala, G.S., Wu, S., 1999. A comparative study of unit root tests with panel data and a new simple test. Oxf. Bull. Econ. Stat. 61, 631–652. doi:10.1111/1468-0084.0610s1631
Marques, A.C., Fuinhas, J. a., Pires Manso, J.R., 2010. Motivations driving renewable energy in European countries: A panel data approach. Energy Policy 38, 6877–6885. doi:10.1016/j.enpol.2010.07.003