THIS
DOCUMENT
IS
NOT
AN
INVESTMENT
RECOMMENDATION
AND
SHALL
BE
USED
EXCLUSIVELY
FOR
ACADEMIC
PURPOSES
( D D )M
ASTERS IN
F
INANCE
E
QUITY
R
ESEARCH
EDP and the Portuguese government have agreed to cut the annual revenues related to the CMECs financial mechanism by €13m during the period 2013-2027. The cut represents about 1.7%
of EDP’s expected gross margin in regulated generation (€748m)
for 2013, and therefore it has a small impact on the company’s price. The impact was valued at a €0.06 decrease in EDP’s price target.
The austerity measures taken by Portugal also involve a general cut of about €375m regarding the warranty system. It was agreed in 2011 that EDP would be entitle to receive an incentive of
€20 thousands/MW per year in Portugal (liberalised generation) to prevent the company from stopping its coal and CCTG (Combined Cycle Turbine Generator) power plants. However, the current energy downward revisions imply an annual cut of €37m which has reduced our price target by €0.11.
EDP has been able to guarantee a stable market share (energy produced) in the Iberian generation market (17.5%), given
the company’s ability to produce low-priced energy. EDP’s biggest source of energy is hydro (40%), placing the company at a competitive advantage in the liberalised market since the market sets prices on a marginal cost basis.
EDP offers Free Cash Flow improvements by 2012; the future positive cash flow generation is a result of an annual average capex of €2.6bn between 2009 and 2011. The company presents and average ROIC (Return on Invested Capital) of 6.8%.
We value EDP at €2.80/share and our recommendation is to BUY. We valued the company using a sum of the parts approach in which we assess each segment individually.
EDP
–
ENERGIAS
DE
PORTUGAL
C
OMPANY
R
EPORT
“E
LECTRIC
U
TILITIES
”
04
J
UNE
2012
A
NALYST
:
J
OANA
S
ANTOS
[email protected]
The CMEC question
:Regulation and macroeconomic issues give rise to
uncertainty
Recommendation: BUY
Vs Previous Recommendation BUY
Price Target FY12: 2.80 €
Vs Previous Price Target 2.80 €
Price (as of 4-Jun-12) 1.66 €
Reuters: EDP.LS, Bloomberg: EDP PL
52-week range (€) 1.63-2.61 Market Cap (€m) 6,069.85 Outstanding Shares (m) 3.656
Source: Bloomberg
Source: Bloomberg
(Values in € millions) 2011 2012E 2013E Gross Margin 5437 5634 5790
EBITDA 3756 3819 3949
Net Profit to shareholders 1125 914 864
EPS 0.31 0.25 0.24
Net Debt/EBITDA 5.01 4.89 4.66 CAPEX/D&A 1.38 0.95 1.21 Source: EDP and Nova Research Team
Company Description
EDP – Energias de Portugal, S.A. engages in the generation, distribution and supply of electricity and it is also involved in the distribution and supply of natural gas. The company operates hydroelectric, thermal and wind power plants mainly in Portugal, Spain, France, Brasil and United States. -100.0% -50.0% 0.0% 50.0% 100.0% 1 -3 -2008 1 -3 -2009 1 -3 -2010 1 -3 -2011
“EDP–ENERGIAS DE PORTUGAL” COMPANY REPORT
THIS
DOCUMENT
IS
NOT
AN
INVESTMENT
RECOMMENDATION
AND
SHALL
BE
USED
EXCLUSIVELY
FOR
ACADEMIC
PURPOSES
(SEE DISCLOSURES AND DISCLAIMERS AT END OF DOCUMENT)TABLE OF CONTENTS
1. COMPANY OVERVIEW...3
2. SHAREHOLDER STRUCTURE...6
3. IBERIAN ELECTRICITY MARKET...7
MARKET OVERVIEW...7
ELECTRICITY VALUE CHAIN...9
4. VALUATION...11
5. ELECTRICITY GENERATION...14
MARKET OVERVIEW...14
REGULATED GENERATION...16
VALUATION...19
LIBERALISED GENERATION...21
VALUATION...23
6. ELECTRICITY SUPPLY...26
IBERIAN SUPPLY...26
VALUATION...28
7. ELECTRICITY DISTRIBUTION...29
IBERIAN DISTRIBUTION...29
VALUATION... 32
8. BRAZIL...33
MARKET OVERVIEW...33
VALUATION...34.
9. EDPR – RENEWABLE ENERGY...35
10. IBERIAN GAS...36
11. ALTERNATIVE SCENARIOS/SENSITIVITY ANALYSIS... 37
12. FINANCIALS...40
13. DISCLOSURE AND DISCLAIMER...42
“EDP–ENERGIAS DE PORTUGAL” COMPANY REPORT
THIS
DOCUMENT
IS
NOT
AN
INVESTMENT
RECOMMENDATION
AND
SHALL
BE
USED
EXCLUSIVELY
FOR
ACADEMIC
PURPOSES
(SEE DISCLOSURES AND DISCLAIMERS AT END OF DOCUMENT)31%
22% 0% 8% 18%
21%
IG ID IS IGas BR RE
1.
COMPANY OVERVIEW
EDP - ENERGIAS DE PORTUGAL
EDP - Energias de Portugal is a Portuguese listed company on the Lisbon Stock Exchange and currently the third largest group in the Portuguese Stock Index (PSI 20) with a weight of 14.57%1. It is the Portuguese electricity incumbent and was founded in 1976 as a state-owned company. During the past few years, the group has been through eight phases of re-privatisation. The last stage was recently concluded with the Portuguese State selling its controlling 21.35% stake in EDP to China Three Gorges. The latter paid €3.45 per share (€2.7bn), implying
a 53% premium to EDP’s share price at the time of the agreement.
EDP operates under the Utilities sector, being the 19th2 largest company within its sector, with a market cap of €6.1bn. It is currently organised in seven different business units: Iberian Electricity Generation (IG), Distribution (ID) and Supply (IS), Iberian Gas Distribution (IDG) and Supply (ISG), Brazil (BR) and Renewable Energy (RE). The Iberian Generation is the most relevant unit at the operational level (31.7% of total EBITDA) followed by the Renewable Energy (21.3%), Iberian Distribution (22.2%) and Brazil (18.2%) units. The remaining segments correspond to 7.9% of total EBITDA.
Diversification to other geographies and internationalization have been the main priorities of the group as a mean to attain sustainable growth and higher EBITDA. EDP is present in 11 countries; Portugal, Spain, France, Belgium, Poland, Romania, Italy, UK, United Sates, Canada and Brazil with 30% of EBITDA coming from operations out of the Iberian market. This allows the company to diversify and mitigate many of the regional risks associated with the current bearish macroeconomic conditions.
EDP’s Iberian Generation (ex-wind) operations comprise both liberalised and regulated activities. The company has currently an installed capacity of 10.4 GW (ex-wind) in Portugal and 3.9 GW (ex-wind) in Spain, implying a market share of 55% and 5.4% respectively. Almost 90% of the company’s EBITDA in this
1
NYSE Euronext as at May 25 2012.
2
Bloomberg
Source: EDP and Nova Research Team.
30% of EDP’s EBITDA comes from operations out of Iberia
Figure 1 - EBITDA breakdown 2011
“EDP–ENERGIAS DE PORTUGAL” COMPANY REPORT
THIS
DOCUMENT
IS
NOT
AN
INVESTMENT
RECOMMENDATION
AND
SHALL
BE
USED
EXCLUSIVELY
FOR
ACADEMIC
PURPOSES
(SEE DISCLOSURES AND DISCLAIMERS AT END OF DOCUMENT)0 5 10 15
2008 2009 2010 2011
Hydro Coal CCTG Nuclear Others
39%
19% 26%
1% 15%
Hydro Coal CCTG Nuclear Others
33%
36% 20%
4%7%
Hydro Coal CCTG Nuclear Others
business unit comes from regulated activities which enables EDP to benefit from stable cash flows as long as there are no revisions in the regulatory framework. Since the strength of these cash flows is dependent on future reviews by the Portuguese Government, the company is exposed to multiple risks. The current downward revision in the PPA/CMEC contracts and Warranty System implies an annual overall decrease of €50m in EDP’s regulated generation margins for 2013. However, the undergoing process of liberalisation in this unit means a higher focus on margins rather than regulatory actions in the future.
The Iberian generation mix of EDP has a bias towards hydro-based. As shown by figure 3 and 4, in 2011, hydro represented 39% of the Iberian installed capacity and 33% of the Iberian net generation. Moreover, EDP has currently 2147 MW Hydro investments under construction which require an initial investment amount
of €2.1bn. These investments are expected to increase installed capacity from 2012 to 2016 and they present an Internal Rate of Return (IRR) of 10%.3 EDP’s growth strategy is correct in our view, because it allows the company to avoid the fast increase in world energy prices and manage to reduce CO2 emissions. The Iberian Supply unit also contains liberalised and regulated activities with market deregulation scheduled for the end of 2012. This unit is somehow integrated with the liberalised generation business because of the possibility of making some hedging by integrating both activities. As so, the company develops hedging strategies by closing fuel forward contracts and setting up contracts with clients at fixed prices in order to establish a margin for a specific period. Therefore, EDP is able to minimize the risk to energy markets more efficiently by being a vertically integrated company.
The Iberian Distribution is a regulated activity and mostly based on future regulatory actions. It turns out to be more dependent on fixed parameters set by ERSE4 rather than consumption levels. It presents a stable source of revenues and it is remunerated at a 9.5% rate (before taxes) in Portugal and 7.8% (before taxes) in Spain. A new regulatory agenda started in 2012 and covers a 3-year period remunerated at the previous mentioned rates.
3The IRR is based on capex and future revenues. Hydro plants were assumed to have an average residual life of 35 years and a load factor of 22%. Please
note that the IRR is very sensitive to load factor changes. 4 Entidade Reguladora dos Serviços Energéticos Figure 2 - EDP's Iberian installed
capacity (GW) 2011
Source: EDP and Nova Research Team.
Figure 3 - EDP's Iberian installed capacity mix 2011
Source: EDP and Nova Research Team.
Figure 4 - EDP's Iberian generation mix 2011
“EDP–ENERGIAS DE PORTUGAL” COMPANY REPORT
THIS
DOCUMENT
IS
NOT
AN
INVESTMENT
RECOMMENDATION
AND
SHALL
BE
USED
EXCLUSIVELY
FOR
ACADEMIC
PURPOSES
(SEE DISCLOSURES AND DISCLAIMERS AT END OF DOCUMENT)213.8 437.9
542.5
712.7 800.7
2007 2008 2009 2010 2011
EDPR EBITDA (€M)
-2% 3% 8% 13% 18% 23%
2009 2010 2011 $R €
The Iberian Gas unit is relative small within EDP, representing about 8% of total EBITDA. The group is currently engaged in distributing and supplying activities, operating both in Portugal and Spain. Supply is both liberalised and regulated with market deregulation scheduled for the end of the year in Portugal while distribution remains as a regulated activity.
EDP entered in the Brazilian market in 1996 and has founded Energias do Brasil in 2000. The latter is a listed company on the Bovespa stock market since 2005 and mainly engaged in the generation and distribution of electricity. EDP currently owns 51% of Energias do Brazil, which is regarded as one of the business units with the highest growth opportunities. It allows the company to profit from the rapid development in emerging markets as well as from the appreciation of the Real against the Euro. Since the company’s EBITDA is very dependent on the evolution of the BRLEUR exchange, our EBITDA growth estimates remain cautious for the upcoming years. The company has a current installed capacity of 2043MW which shall be improved by 320MW by the end of 2012 with the conclusion of the first coal plant owned by EDP in Brazil.
The renewable energy sector has been developed as an alternative to other sources of electricity generation. EDP’s decision to concentrate its strategy on this segment was influenced by the fast increase in world energy prices and the possibility to enter in new markets, capturing growth both in North America and Europe. The group has become stronger in this business over the past 4 years, demonstrating higher profitability from 2007 onwards (figure 6).
Over the last years the company has not always been able to deliver positive free cash flows due to its large investment plan and past investment decisions. The cash that the company was able to generate in 2009 and 2010 was not enough to cover an annual average Capex of €2.9bn per year. The company’s investment target has been in wind power and in generation capacity expansion, having 2.8GW under construction. After the completion of these projects, EBITDA is expected to increase given their positive contribution. We anticipate Free-Cash-Flow improvements by 2012. Future growth will be based mostly on a self-financing strategy.
Source: EDP and Nova Research Team.
Figure 5 - EBITDA growth (Energias do Brasil)
Figure 6 - EDPR's EBITDA (€M)
“EDP–ENERGIAS DE PORTUGAL” COMPANY REPORT
THIS
DOCUMENT
IS
NOT
AN
INVESTMENT
RECOMMENDATION
AND
SHALL
BE
USED
EXCLUSIVELY
FOR
ACADEMIC
PURPOSES
(SEE DISCLOSURES AND DISCLAIMERS AT END OF DOCUMENT)CASHFLOW STATEMENT | € MILLION 2009 2010 2011 2012E 2013E 2014E 2015E 2016E
Effecttive after tax operating income 1,547.1 1,615.7 1,799.4 1,717.5 1,795.8 2,041.9 2,354.6 2,649.1 Depreciation 1,334.1 1,446.7 1,487.5 1,400.2 1,410.5 1,421.4 1,435.1 1,449.5 Tangible and Intagible capex -2,360.2 -3,459.6 -2,058.6 -1,327.0 -1,701.4 -1,727.6 -1,820.9 -1,863.2 Change in Working Capital -380.6 -594.9 -304.2 -446.3 -4.9 11.1 18.4 21.2
Change in other assets -1,598.6 190.1 -620.1 66.5 - - -
-OPERATING AND INVESTING CASH FLOW -1,458.1 -801.9 304.1 1,411.0 1,499.9 1,746.9 1,987.2 2,256.7 Change in financial debt 1,594.7 1,610.7 893.5 -103.8 -246.6 -706.6 -876.7 -1,001.7 Capital inflows from shareholders 750.7 133.7 -114.3 -108.1 -85.9 237.4 309.0 293.8 Others -887.3 -942.4 -1,083.3 -1,199.1 -1,167.5 -1,277.6 -1,419.6 -1,548.7
FINANCING CASH FLOW 1,458.1 801.9 -304.1 -1,411.0 -1,499.9 -1,746.9 -1,987.2 -2,256.7
Free Float 40.3%
CTG 21.4%
Iberdrola 6.8%
Cajastur 5.0%
José de Mello 4.8%
Senfora 4.1%
Parpública 3.7%
BCP Pension Fund 3.4%
Norges Bank 2.8%
Sonatrach 2.2%
BES 2.1%
QATAR 2.0%
Own shares 0.9%
CGD 0.6%
Shareholder Structure
2.
SHAREHOLDER STRUCTURE
China Three Gorges (CTG) represents the main shareholder of EDP, holding 21.4% of total shares. Free-float represents less than half of the company’s stock (40.3%). The recent partnership with CTG is in our view positive for the
company’s operations, as it provides mid-term stability in terms of the strategy developed and commitment to the company. The agreement implies CTG to keep its holding for a 4-year lock-up period promoting shareholder strength. CTG is a 100% owned and fully supported by the Chinese Government. It was founded 17 years ago and has currently more installed capacity (22.5GW) than the entire Portuguese Electrical System (18.2 GW). While EDP has 2.8 GW under construction in 11 different countries, CTG is engaged in the construction of 50.8GW in 28 countries. Both companies pursue a clean energy growth strategy (CTG - 48.9 GW under construction of Hydro; EDP - 2.1 GW under construction of Hydro and Wind) and show international development aspiration. They aim at developing projects together mostly in the renewable energy sector. The Chinese company is going to spend €2bn to purchase minority stakes in EDP wind farms up to 2015 which will strengthen the partnership between companies. CTG will assist to support the improvement of EDP’s credit profile by helping with funding. The agreement covers a credit facility up to €2bn provided by a Chinese financial institution to EDP for a maturity up to 20 years and an interest rate of approximately 6% per year.
Figure 7 - EDP Cash Flow Statement
Source: EDP and Nova Research Team.
Figure 8 - EDP's Shareholder Structure
“EDP–ENERGIAS DE PORTUGAL” COMPANY REPORT
THIS
DOCUMENT
IS
NOT
AN
INVESTMENT
RECOMMENDATION
AND
SHALL
BE
USED
EXCLUSIVELY
FOR
ACADEMIC
PURPOSES
(SEE DISCLOSURES AND DISCLAIMERS AT END OF DOCUMENT)3. IBERIAN ELECTRICITY MARKET
MARKET OVERVIEW
Significant changes have been introduced in the Utilities sector since the joint initiative from the Governments of Portugal and Spain to create a regional market (integrated market). The Iberian electricity market is preparing its future towards liberalisation and, therefore, approaching the already liberalised markets in Europe: France, Germany, UK, Netherlands, Nordic Markets and Italy. The restructuring that has occurred in the European electricity sector was mainly driven by the adoption of the 1996 Directive (96/92/CE) which set the objective of progressively achieve a single European common system, allowing full competition in all member states. As a first step, and given the complexity of creating a single market at once, seven different regional markets were set up, as an intermediary regional approach of the integration of the national markets into a single EU market. In view of that, in 2001, Portugal and Spain assigned a protocol for the creation of an Iberian Electricity Market (MIBEL) which was aimed at allowing any consumer in the Iberian Zone to acquire electrical energy under a free competition regime, from any producer or retail that operates in Portugal or Spain. As integration factors of MIBEL, two divisions (OMIP5 and OMEL6) were created so the MIBEL could work properly as expected by both governments. They were set up to manage the organized markets and each country was responsible for one of the two divisions.
The integration of the Portuguese and the Spanish markets implies a fully functioning and competitive single energy market with price convergence. In order to evaluate the level of competitiveness within the Iberian market we need to take into account the real physical networks between countries as well as the difference between regulated tariffs and market prices since both co-exist in Portugal and Spain. The Spanish electricity market is interconnected with the Portuguese grid at nine different points with a current interconnection capacity of 1300MW. Moreover and according to REN the percentage of time in which the use of the interconnection capacity reached 100% was 8% (monthly average congestion rate) during 2011. Although the monthly average congestion rate has been decreasing overtime as shown by figure 9, the Iberia Market is still not perfectly competitive. The interconnection capacity between Portugal and Spain
5
Iberian Derivatives Market of MIBEL - Portuguese division - It started operating in 2006.
6
Iberian Day and Intraday Market of MIBEL - Spanish division - It started operating in 2007. The Iberian market is
preparing its futures towards liberalisation
In 2011, Portugal and Spain assigned a protocol for the creation of an Iberian Electricity Market (MIBEL)
“EDP–ENERGIAS DE PORTUGAL” COMPANY REPORT
THIS
DOCUMENT
IS
NOT
AN
INVESTMENT
RECOMMENDATION
AND
SHALL
BE
USED
EXCLUSIVELY
FOR
ACADEMIC
PURPOSES
(SEE DISCLOSURES AND DISCLAIMERS AT END OF DOCUMENT)0% 10% 20% 30% 40% 50% 60% 70% 80% 90% 100%
Market splliting with PT price > SP price Integrated market with equal prices
Market splitting with SP price > PT price -2.5 -0.5 1.5 3.5 5.5 7.5 9.5 11.5 Ja n -08 M ai -08 Se t-08 Ja n -09 M ai -09 Se t-09 Ja n -10 M ai -10 Se t-10 Ja n -11 M ai -11 Se t-11 Difference between PT and SPA prices
has not been sufficient to bring electricity prices in each country to broad balance. When there is congestion in the interconnection between both countries, the market splits into two different price zones, with a higher price being charged by the market that is importing energy at the time of the congestion. We have identified two main trends in the Iberian Market. First, the price in the Portuguese area has been higher whenever the market is not integrated and second the harmonization of prices has been a gradual process over the past few years. We believe the increase in the interconnection capacity between the two countries, which is scheduled to boost by 1700 MW until 2014, will increase market competiveness in the liberalised market and cut EDP’s margins. Moreover the price set by ERSE annually has been systematically lower than the market price, which also has been preventing free competition.
In order to completely conclude the liberalisation process, allowing the Iberian market to become more integrated, the IMF Memorandum established January 2013 as the limit for the liberalisation of the remaining regulated electricity tariffs in Portugal. Ultimately, the semi-liberalised generation market in Portugal will be fully liberalised until 2017 (EU Directive 2003/54/CE) while the ongoing process of liberalisation in the Portuguese supply market is expected to be concluded in 2013.
In the midst of market deregulation, it is worth mentioning the impact of the liberalisation process in the end-use tariff in Portugal. 2012 is the last year in which electricity end-consumers can choose between regulated or liberalised market suppliers. In the regulated market the final retail price paid for electricity is The Iberian Market is
still not perfectly competitive and two different price zones arise when there is congestion in the interconnection
2013: Limit for the liberalization of the remain regulated market
2017: Limit for
regulated generation to start operating under the liberalised regime
Figure 9 - Use of Portugal and Spain interconnection capacity
Source: OMEL and Nova Research Team
Figure 10 - Difference between the Portuguese
and Spanish market prices (€/MWh)
“EDP–ENERGIAS DE PORTUGAL” COMPANY REPORT
THIS
DOCUMENT
IS
NOT
AN
INVESTMENT
RECOMMENDATION
AND
SHALL
BE
USED
EXCLUSIVELY
FOR
ACADEMIC
PURPOSES
(SEE DISCLOSURES AND DISCLAIMERS AT END OF DOCUMENT)7%
32%
27% 32%
2%
Use of Transport Network tariff Global Use of the System tariff Use of Distribution Network tariff Energy tariff
Network Supply tariff
0% 20% 40% 60% 80% 100%
2009 2010 2011
Iberdrola Endesa Gas Natural
E.On EDP Others
0% 20% 40% 60% 80% 100%
2009 2010 2011
Iberdrola Endesa Gas Natural
E.On EDP Others
the sum of all regulated services tariffs in the value chain, as shown by figure 117. They are set by the regulator ERSE so as to allow the suitable revenues for each activity. Alternatively, in the liberalised market the final price comprises the access tariffs, (Use of Distribution and Use of Transport tariffs) as these activities will continue to operate under a monopoly concession, the Global Use of the System tariff as well as the Retail margin. The Retail margin is fairly similar to the price charged by electricity suppliers regarding their generation and supply activities, as, under this regime, these are no longer regulated by ERSE. It can easily be understood that the liberalisation process affects approximately 34%
(Energy plus Network Supply tariffs) of the total tariff and since this part is no longer fixed we expect it to have higher volatility than under the entire regulated regime. Moreover, since ERSE use to set prices below the market price we expect electricity tariffs to be higher after the liberalization process is concluded (in 2010, ERSE forecasted an average annual market price of 46.6€/MWh8 for
2011 while the actual market price was 50€/MWh9).
ELECTRICITY VALUE CHAIN
The Iberian electricity market value chain consists of four elements; generation, transmission, distribution and supply; from the point in which electricity is produced until it reaches the final client.
The energy generation segment is operated under a semi- free competition regime with players such as EDP, Iberdrola, Endesa and Gas Natural Fenosa operating both in Portugal and Spain. Iberdrola and Endesa are the top two electricity companies in Spain, controlling about 31% and 28% respectively of the
country’s total capacity. Gas Natural Fenosa is the third player in the Spanish market followed by EDP, which owns a 6.5% market share. Despite the leading position of EDP in the Portuguese market, the company’s share in installed capacity in Portugal drop significantly (approximately 18% during 2003 to 201010)
7 The regulated service tariffs cover the following costs: Use of Transport Network - costs charged by REN regarding its transmission activities; Use of
Distribution Network - costs charged by EDP Distribuição regarding its distribution activities; Energy tariff - costs arising from buying and selling electricity (EDP Serviço Universal); Network Supply - costs associated with the supply activity; Global Use of the System - includes system technical management costs; costs associated with public energy policies (PRE – Produção em Regime Especial |CMEC - Contracts for Maintenance of Contractual Equilibrium)
8
ERSE - Proveitos permitidos das Empresas Reguladas do Sector Eléctrico em 2011
9
OMEL
10
ERSE - Relatório Anual para a Comissão Europeia Agosto 2011. Figure 11 - Tariffs set by the
regulator ERSE to 2012 (Portugal)
Source: Proveitos Permitidos das Empresas Reguladas do Sector Elétrico em 2012.
Figure 12 | 13 - Market share on the generation segment in Spain (installed capacity | energy produced)
Source: Spanish energy regulator’s
“EDP–ENERGIAS DE PORTUGAL” COMPANY REPORT
THIS
DOCUMENT
IS
NOT
AN
INVESTMENT
RECOMMENDATION
AND
SHALL
BE
USED
EXCLUSIVELY
FOR
ACADEMIC
PURPOSES
(SEE DISCLOSURES AND DISCLAIMERS AT END OF DOCUMENT)0% 20% 40% 60% 80% 100%
2009 2010 2011
EDP Ren Trading Iberdrola
Endesa Others 0% 20% 40% 60% 80% 100%
2009 2010 2011
EDP Ren Trading Iberdrola
Endesa Others 0% 20% 40% 60% 80% 100%
2009 2010 2011
Iberdrola Endesa
EDP U fenosa+G Natural
Outros
Market share Portugal Spain
EDP 42% 12%
Iberdrola 26% 26%
Endesa 24% 37%
U. Fenosa 5% 16%
Others 8% 9%
mainly driven by the growth in the special regime generation in which EDP possesses an individual minority position. Still, EDP owns most of the capacity in Portugal (54.2%) while Iberdrola (1.1%) and Endesa (7.3%) are present in the Portuguese market since 2009 and therefore only hold a small market share. Furthermore, the market share by company regarding energy produced and installed capacity show a similar trend both in Portugal and Spain. EDP has been able to guarantee a fairly stable share in energy generation (figure 15),
evidencing the company’s ability to produce low-priced energy.
The transmission segment is operated under a monopoly concession both in Spain and Portugal and it is conducted by REE11 and REN12 respectively. Transmission consists on the bulk transfer of electrical energy from generating power plants to electrical substations called distribution grid. The electricity
distribution system carries electricity from the transmission system and delivers it to consumers. EDP operates the Portuguese national distribution grid under a monopoly concession while in the Spain the market is organized under regional concessions.
Supply is the final process in the electricity market value chain and as electricity generation it is operated under a semi-free competition regime. EDP is currently the market leader in Portugal and the fourth player in Spain, lagging far behind Union fenosa, Iberdrola and Endesa (figure 16). The increased competition dynamics as a result of the liberalised process have increased the switching rates over the past three years with EDP losing an average 20% market share per year on its liberalised supply activities. However, since the latter only represents 4% of total gross margin, EDP’s share loss is not likely to affect the
company’s profitability significantly. Even though supply and generation activities are regarded as an integrated business, supply market share losses do not directly affect the performance of the generation activity, as the final supplier does not necessarily provide to its end-consumers the electricity generated by itself, but instead it is dependent on the electricity available in the Iberian pool. As so, the company’s ability to preserve its market share regarding total energy produced will depend on its ability to be competitive in the generation market. This topic will be further discussed in section 5.
11 Red Eléctrica de Espana.
12 Redes Energéticas Nacionais Figure 14 | 15 – Market share on the generation segment in Portugal (installed capacity | energy produced)
Source: Relatório Anual para a Comissão Europeia (2011) and ERSE
Figure 14 | 15 - Market share on the generation segment in Iberia (energy produced)
Source: ERSE and CNE
Figure 16 – Market share on the supply segment
“EDP–ENERGIAS DE PORTUGAL” COMPANY REPORT
THIS
DOCUMENT
IS
NOT
AN
INVESTMENT
RECOMMENDATION
AND
SHALL
BE
USED
EXCLUSIVELY
FOR
ACADEMIC
PURPOSES
(SEE DISCLOSURES AND DISCLAIMERS AT END OF DOCUMENT)4.
VALUATION
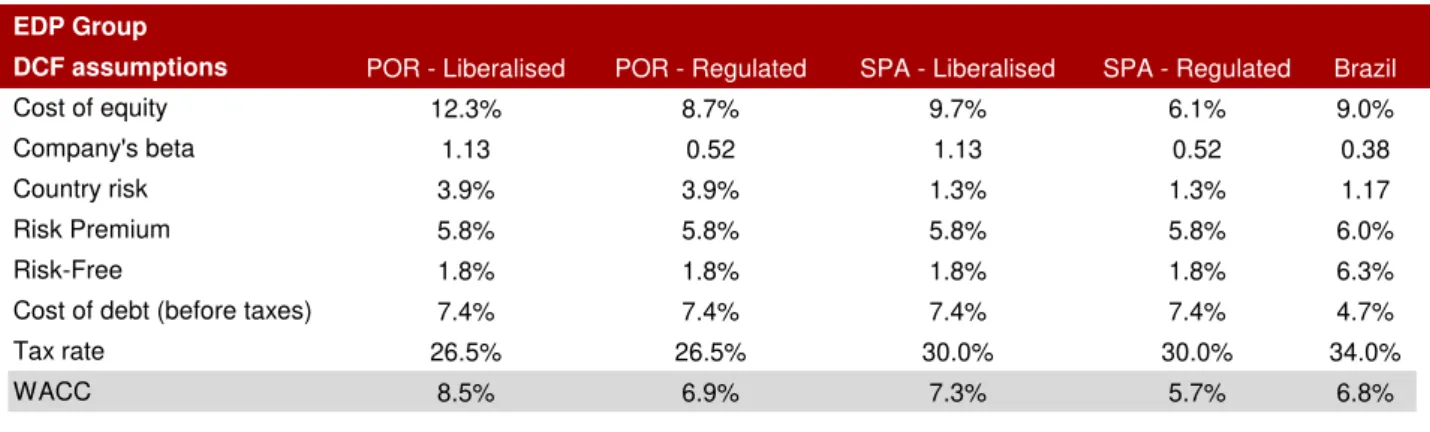
We valued EDP using the Sum-of-The Parts (SoTP) approach in which we assess each segment individually. Segments were valued in € and at current prices through a DCF-WACC13 model with an explicit forecast period of 5 years for most of the business units and 6 years for the liberalised generation activity so as to consider the effects of market deregulation. Six different segments were analysed separately in order to measure their particular key drivers. Our valuation implies a suitable cost of capital for each segment in order to evaluate the different levels of risk within EDP. The computation of the cost of capital was achieved by taking into consideration its three components; the opportunity
cost of equity and debt as well as the company’s target capital structure.
The cost of equity was computed under the CAPM14 model assuming a market premium of 5.80%15, in accordance with financial literature. In addition, the compilation of comparables16 for activities operating under different regimes allowed us to calculate the average unlevered beta, re-levering it afterwards to
EDP’s present capital structure at market values. Since Beta measures the
systematic risk of a business, it reflects the sales cycle, operational leverage and financial leverage. The current valuation implies a lower Beta for regulated activities within EDP and Energias do Brazil since the company operates under regulatory frameworks in almost all activities. We assumed the same risk-free
rate for all businesses within the Euro Zone (1.75%) and we have adapted our risk free estimates for Brasil, where a default free entity exists. We used the inflation-indexed treasury rate (TIPS)17 (denominated in Reais) as a proxy for the real risk free rate and the 10-year average of the Brazilian inflation rate (6.6%)18 in order to achieve a nominal riskless rate of return. In addition, the market premium for Brazil was adjusted by the difference between the Brazilian and US inflation rates in order to incorporate the rate of inflation in Brazil. As under the CAPM model, the systematic risk should be reflected in the cost of capital, a
13
14
Capital Asset Pricing Model
15
Pedro Santa-Clara and Shu Yan 2004 - “ Jump and Volatility Risk Premia: A New Model and Lessons from S&P 500 options”
16
The industry peer group for liberalised activities includes Iberdrola, Endesa, E.On, ENEL and Gas Natural. The industry peer group for regulated activities includes EDP - Energias do Brasil, RENE, REN and Enagás. The industry peer group for Brasil includes 10 companies operating in Brasil.
17
A treasury security that is indexed to inflation so as to protect investors from the negative effects of inflation
18
In accordance with IMF data.
WE valued EDP using the Sum-of-The Parts approach
The segments were valued through a DCF-WACC model with an explicit forecast period of5 years
The cost of capital was achieved by unlevering the beta of
comparables, re-levering it afterward to EDP’s capital structure at market values
“EDP–ENERGIAS DE PORTUGAL” COMPANY REPORT
THIS
DOCUMENT
IS
NOT
AN
INVESTMENT
RECOMMENDATION
AND
SHALL
BE
USED
EXCLUSIVELY
FOR
ACADEMIC
PURPOSES
(SEE DISCLOSURES AND DISCLAIMERS AT END OF DOCUMENT)EDP Group
DCF assumptions POR - Liberalised POR - Regulated SPA - Liberalised SPA - Regulated Brazil
Cost of equity 12.3% 8.7% 9.7% 6.1% 9.0%
Company's beta 1.13 0.52 1.13 0.52 0.38
Country risk 3.9% 3.9% 1.3% 1.3% 1.17
Risk Premium 5.8% 5.8% 5.8% 5.8% 6.0%
Risk-Free 1.8% 1.8% 1.8% 1.8% 6.3%
Cost of debt (before taxes) 7.4% 7.4% 7.4% 7.4% 4.7%
Tax rate 26.5% 26.5% 30.0% 30.0% 34.0%
WACC 8.5% 6.9% 7.3% 5.7% 6.8%
Beta for each countrywas determined based on the country’s market index and
the World MSCI Index. However, as we believe this is not the most proper way to reflect the systematic risk for Portugal and Spain, in this case, we assessed
the company’s risk exposure to the country’s risk19
.
The cost debt20 was assumed to be equal across all business areas not only because they are denominated in the same currency but they also depend on the same funding market conditions. The cost of debt was reached based on the market yield of an EDP’s bond with enough liquidity and expiring ten years from now. Moreover we used a default probability of 1.37%21, the utilities sector has historically been the sector with the lowest rate of default, and a recovery rate of 67.5%22. Since Energias do Brazil does not possess a market yield, we relied on the average market yield of its comparables that present a similar rating.
Lastly the company’s target capital structure was assumed to be in line with our forecasts of Equity and Debt for the future. As so, we considered a capital structure of 55% Debt and 45% Equity when computing our WACC. The rates below are in nominal terms reflecting a long-term inflation rate of 2%.
19
20
21Moody’s Investors Service - “Corporate Default and Recover Rates 1920-2010”
22Moody’s Investors Service
- “Corporate Default and Recover Rates 1920-2010” The cost of debt
assumes a default probability of 1.37% and a Recovery Rate of 67.5%
Figure 17 - DCF assumptions
“EDP–ENERGIAS DE PORTUGAL” COMPANY REPORT
THIS
DOCUMENT
IS
NOT
AN
INVESTMENT
RECOMMENDATION
AND
SHALL
BE
USED
EXCLUSIVELY
FOR
ACADEMIC
PURPOSES
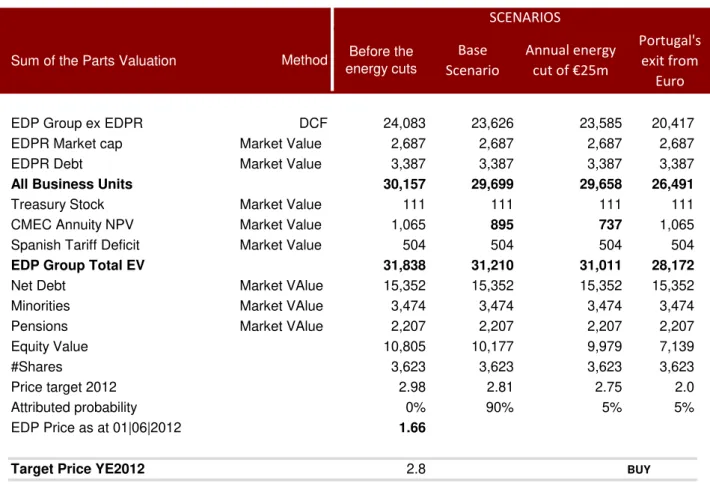
(SEE DISCLOSURES AND DISCLAIMERS AT END OF DOCUMENT)Sum of the Parts Valuation Method
EDP Group ex EDPR DCF 24,083 23,626 23,585 20,417
EDPR Market cap Market Value 2,687 2,687 2,687 2,687
EDPR Debt Market Value 3,387 3,387 3,387 3,387
All Business Units 30,157 29,699 29,658 26,491
Treasury Stock Market Value 111 111 111 111
CMEC Annuity NPV Market Value 1,065 895 737 1,065
Spanish Tariff Deficit Market Value 504 504 504 504
EDP Group Total EV 31,838 31,210 31,011 28,172
Net Debt Market VAlue 15,352 15,352 15,352 15,352
Minorities Market VAlue 3,474 3,474 3,474 3,474
Pensions Market VAlue 2,207 2,207 2,207 2,207
Equity Value 10,805 10,177 9,979 7,139
#Shares 3,623 3,623 3,623 3,623
Price target 2012 2.98 2.81 2.75 2.0
Attributed probability 0% 90% 5% 5%
EDP Price as at 01|06|2012 1.66
Target Price YE2012 2.8 BUY
Before the energy cuts
Base Scenario
Annual energy
cut of €25m
Portugal's exit from
Euro SCENARIOS
Our valuation rates EDP as BUY, with a price target at €2.80. The sum of the parts valuation includes DCF-WACC valuation, book and market values. The value of each business unit was achieved through a DCF model except for EDPR whose valuation was based on its market value as at June 1 2012. Subsequently, Non-equity claims, such as the market value of debt, pension funds and minorities, were subtracted from the enterprise value in order to achieve the equity value of EDP.
Under our analysis, we present three possible scenarios, attributing to each one of them a probability of occurrence as shown by figure below. Further information on the scenarios can be consulted in Appendix 1.
Figure 18 – Sum of the Parts Valuation
“EDP–ENERGIAS DE PORTUGAL” COMPANY REPORT
THIS
DOCUMENT
IS
NOT
AN
INVESTMENT
RECOMMENDATION
AND
SHALL
BE
USED
EXCLUSIVELY
FOR
ACADEMIC
PURPOSES
(SEE DISCLOSURES AND DISCLAIMERS AT END OF DOCUMENT)0% 10% 20% 30% 40% 50% 60% 70% 80% 90% 100%
1999 2000 2001 2002 2003 2004 2005 2006 2007 2008 2009 2010
Hydro Renewables Natural gas Coal Nuclear Others
5. ELECTRICITY GENERATION
MARKET OVERVIEW
Over time power generation has consistently grown, fuelled by increasing global energy demand, mainly from developing countries and emerging economies. Their expanding populations and robust economic growth, driven by capital inflows, more than offset European nations recover from the downturn. We expect global demand to increase in the upcoming years because of its tight connection with economic growth23. According to EIA, global energy demand expansion results in an average annual increase of 1.6% which leads global energy consumption to 769.8 quadrillion Btu in 2035, whereas, Europe alone, and despite its current economic reality, is expected to grow at an average annual rate of 0.5% until 2035.It is without surprise that one of the biggest drivers of the power generation industry is energy demand on top of politics and fuel costs volatility. Power generation can be generated via several means and fuels, including nuclear, oil, coal, gas, hydroelectric and renewable. Despite the overall positive growth in power generation, its mix has changed over the past 10 years as a result of environmental concerns, combined with the fast increase of the prices of fossil fuels. Worldwide, and in the European Union, natural gas and renewable technologies have become more important over the past years while coal and oil became less so. The biggest source of energy is nuclear, accounting for approximately 26% of total production, while the second leading source is the renewable energy (including hydro) representing 25% of total production. The later was the fastest-growing source, with its share in European electricity generation increasing from 20% (1999) to close to 26% (2010), driven by the following reasons. The high fossil fuel recorded over the past years combined with environmental concerns of greenhouse emissions fostered the development of government policies, such as feed-in-tariffs, which have encouraged the adoption of renewable energy. Despite the overall financial consolidation fears over some of the European countries and possible incentive cuts; we believe the implementation of the RES Directive24 will continue to develop the sector, as EU member states aim at raising the share of renewable energy in energy consumption in EU to 20% by 202025. One the other hand, Gas-fired plants have
23
According to Eurostat the EU energy demand has historically grown at two thirds the rate of GDP, with a 65% correlation through cycle.
24
Directive 2009/28/EC
25
According to Eurostat in 2010 the share of renewable energy as a percentage of the total energy consumption was 12%. Figure 19 – European
generation mix evolution
t
The biggest source of energy is nuclear followed by renewable energy which
“EDP–ENERGIAS DE PORTUGAL” COMPANY REPORT
THIS
DOCUMENT
IS
NOT
AN
INVESTMENT
RECOMMENDATION
AND
SHALL
BE
USED
EXCLUSIVELY
FOR
ACADEMIC
PURPOSES
(SEE DISCLOSURES AND DISCLAIMERS AT END OF DOCUMENT)80 130 75 130 83 120 130
311
Nuclear Coal Gas Onshore Wind
Minimum value Maximum value
82 137 80 142 87 122 121
233
Nuclear Coal Gas Onshore
Wind
Minimum value Maximum value
10 12 14 16 18 20
2010 2011 2012 2013 2014
C
O2
(
€
/to
n
)
CO2 emissions right futures
dominated new capacity additions over coal plants in the past ten years. Gas power has been popular due to relatively low CO2 emissions and high flexibility (plants take minutes rather than hours to be ready to produce). A coal fired plant generates CO2 emissions twice as much as a natural gas fired plant26, turning coal plants less appealing as shown by figure 13, which clearly describes an upward trend for CO2 emissions prices in the future. The EU target to reduce greenhouse emission by at least 20% by 202027 (compared with 1990 levels) also indicates a new energy path towards a low-carbon economy, making it clear that in the future, Natural gas power plants will gradually substitute coal.
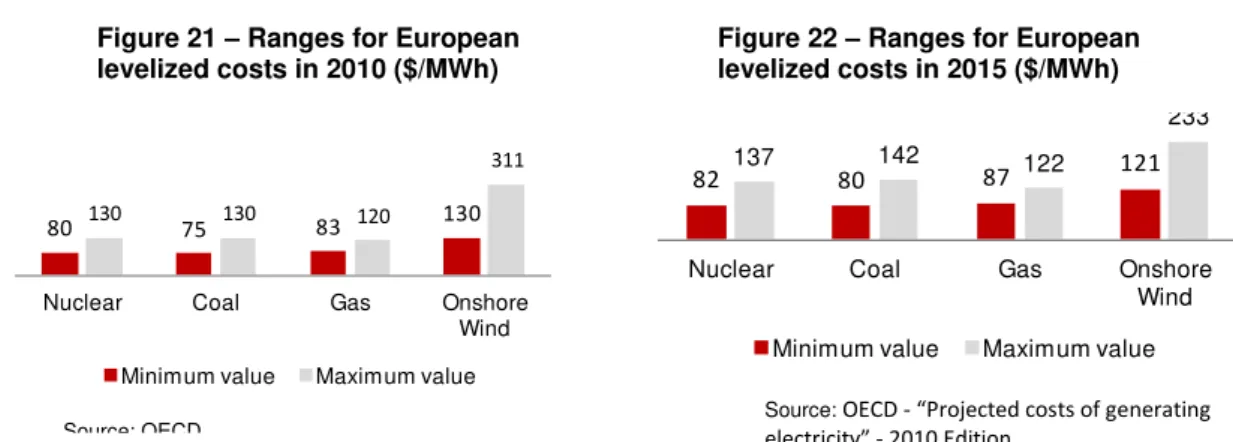
However efforts to further develop cleaner sources of energy are taking place, natural gas prices are still very much linked to the benchmark oil price remaining unclear which of the two energy sources (coal and natural gas) turns out to be more cost effective. So as to evaluate the profitability of the different types of sources of energy we relied on their levelized cost of electricity (LCOE)28, as illustrated by the figure below, which plots the ranges of the LCOE for nuclear, coal, gas and onshore wind power plants.
We have reached two main conclusions. First, coal is the most competitive solution in the absence of carbon pricing (minimum value scenario) and second Onshore Wind is expected to display higher cost efficiency, the maximum value within its range is likely to decrease overtime. The study considers innovative designs for renewable power plants and as so, construction costs were assumed to be in the range of 1900 to 3700 USD kWe for Onshore Wind.
26
US Environmental Protection Agency
27
Based on the European Comission Proposal, in March 2007 the council endorsed the target mentioned above. 28
LCOE: The price at which electricity must be generated from a specific source to break even, including all the costs over its lifetime. The OECD study uses a DCF method for LCOE calculations assuming a real discount rate of 10%.
Figure 21 – Ranges for European
levelized costs in 2010 ($/MWh) Figure 22 levelized costs in 2015 ($/MWh) – Ranges for European
Source: OECD
Source: OECD - “Projected costs of generating
electricity” - 2010 Edition Figure 20 – CO2 emission rights
for the future (2010-2014)
“EDP–ENERGIAS DE PORTUGAL” COMPANY REPORT
THIS
DOCUMENT
IS
NOT
AN
INVESTMENT
RECOMMENDATION
AND
SHALL
BE
USED
EXCLUSIVELY
FOR
ACADEMIC
PURPOSES
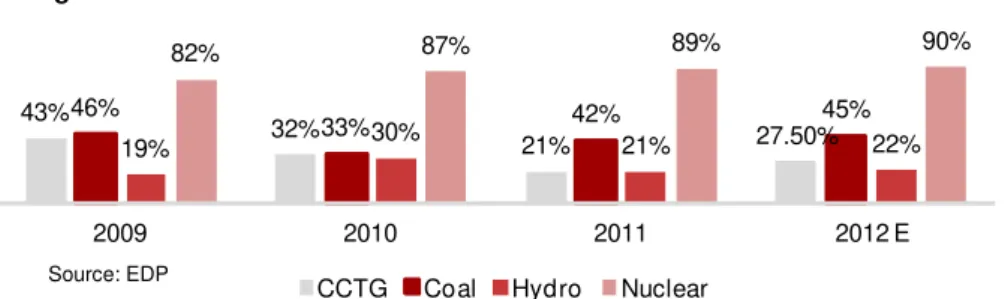
(SEE DISCLOSURES AND DISCLAIMERS AT END OF DOCUMENT)5005 5005 5005 5442
26522405 26523268 2652 2652
3736 3736
1267 1267 1267 1977
2008 2009 2010 2011
Hydro Coal CCTG Other
Despite the initial cost advantage of coal, the high probability of more expensive carbon emission rights will make it less competitive in a near future. For 2015 a price of carbon of $30 per tone was for the first time included in LCOE calculations (maximum value scenario) in order to reflect policies to reduce greenhouse gas emissions. Moreover, the study assumes a black coal price of $90 per ton for the LCOE in 2015 in opposition to $76 in 2010 and it reflects a natural gas price of $10.3 and $5.3 per MMBtu in 2015 and 2010 respectively. In addition, the fossil fuel model considered in LCOES calculations uses harmonized fuel prices.
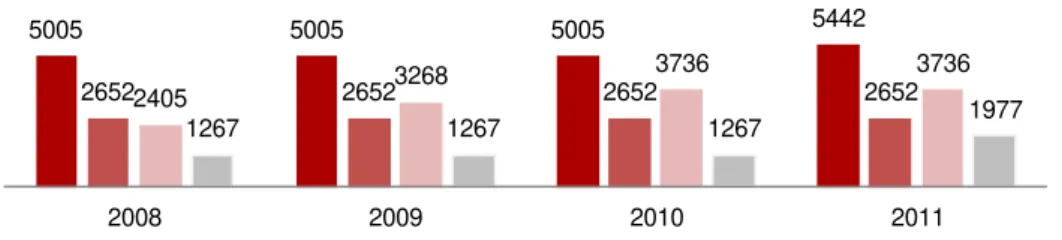
With a current installed capacity of around 14.3 GW in Iberia (excluding wind power), EDP operates a balanced generation portfolio, as shown by figure 23. The strategic choice made by EDP to diversify its generation portfolio is in our view correct, allowing the company to be less exposed to a particular source of energy. Also worth mentioning is EDP growth strategy. The company bet on CCGT and hydro should be regarded as an approach to avoid rising CO2 emission prices and unpredictable commodity prices in the current economic climate.
REGULATED GENERATION (RG)
EDP’s generation operations encompass regulated and liberalised activities. In 2011, the Iberian Generation unit represented 31.7% of total EBITDA, which is equivalent to an EBITDA volume of €1,189m. Liberalised operations are focused in Portugal and Spain in contrast with regulated generation, which is conducted only in Portugal. In 2011, regulated generation was the most relevant unit at the operational level, representing approximately 22.0% of total EBITDA. It constitutes a stable source of cash flow and it has not been affected by the Iberian generation
represents
approximately 31.7% of EBITDA
Figure 23 –EDP’s Iberian installed capacity-ex wind (GWh)
“EDP–ENERGIAS DE PORTUGAL” COMPANY REPORT
THIS
DOCUMENT
IS
NOT
AN
INVESTMENT
RECOMMENDATION
AND
SHALL
BE
USED
EXCLUSIVELY
FOR
ACADEMIC
PURPOSES
(SEE DISCLOSURES AND DISCLAIMERS AT END OF DOCUMENT)economic slowdown as this unit is based on long-term contracts remunerated at a pre-defined rate.
Until June 2007, much of the electricity generated by the company was produced under Power Purchase Agreement (PPA) schemes. These contracts entitled REN to buy all the electricity generated by EDP and were the required condition
for banks to finance the company’s projects. They guaranteed EDP an annual return of 8.5% before taxes and all the investments made by the company during the life of the PPA would also benefit from this remuneration. The pass-through of contractual fixed and variable operational and maintenance costs (O&M), as well as the depreciation charge was also assured to EDP by those contracts. The attempt to start liberalising the energy market was not in line with one single-buyer so PPA’s had to be replaced by another type of contracts, the so called Contracts for Maintenance of Contractual Equilibrium (CMEC). The CMEC system was approved by the European Commission in 2004 and established in 2007 with the aim of preserving the NPV of the former PPAs
and developing market liberalisation.
The CMEC base is the difference between the NPV of the PPA contracted gross profit and the NPV of a marked based scenario under an estimated wholesale
price of 50€/MWh (real value).The CMEC base (EUR 833.467 million29) will be paid by all customers through access tariffs until December 2027, which means that every year, the Global Energy Use tariff reflects an annual amortization of the base CMEC. Moreover, deviations between market forecasted margins (used to estimate the NPV of the market based scenario) and market reality margins are reviewed every year and are also included in the global use of the system tariff30, paid up two years after the deviation occur. If that deviation is positive, EDP is entitled to receive compensation, otherwise the company must pay the excess revenues earned. Both annual amortization and deviations represent about 20% of the global use of the system tariff and approximately 7% of the end-use tariff, which is equivalent to an annual value close to €301 m31.
The company’ margin in this unit has been far greater than it would be under the liberalised regime as per figure 17. It shows the additional amount earned by EDP’s power plants that are covered by the PPA/CMEC contracts over power plants that operate under the liberalised market. The level of risk attributed to
29 Base CMEC as of 2007.
30
Annual revisibility reflected in the end-use tariff only from 2007 to 2017
31
ERSE: Proveitos Permitidos das Empresas Reguladas do Sector Elétrico em 2012 Regulated generation is
remunerated at 8.5% before taxes
In 2007 the CMEC system replaced the PPA contracts, preserving the NPV of the former PPAs
“EDP–ENERGIAS DE PORTUGAL” COMPANY REPORT
THIS
DOCUMENT
IS
NOT
AN
INVESTMENT
RECOMMENDATION
AND
SHALL
BE
USED
EXCLUSIVELY
FOR
ACADEMIC
PURPOSES
(SEE DISCLOSURES AND DISCLAIMERS AT END OF DOCUMENT)81.2 80.1 81.2 81.2
191.6
-20.5 81.6
200.6 242.6
2010 2011 2012
Base CMEC annuity Hydro deviation Thermal deviation
PPA/CMEC contracts has been greater than what it should be under fair conditions, suggesting a rate of return above its reasonable level. Despite the quite stable CMEC base annuity of about €81m, EDP has reported over the last three years positive deviations.
In 2012 EDP is expected to report €303m of revenues from the difference between PPAs and market margins. The breakdown is: + €242.6m for thermal plants, - €21.5m due to hydro plants and + €81.2m for the base CMEC annuity. The deviation in 2012 attributable to thermal plants comes from the low market price of electricity registered in 2010, €40MWh in opposition to €50MWh implied in market forecasts, whereas the negative deviation assigned to hydro plants, comes from their exceptionally high load factors which more than offset low market prices. The market price is now significantly higher than in 2010 so we expect EDP to receive lower CMECs in 2013 so as to achieve the returns guaranteed by the PPA contracts. Since the company’s revenues replicate those of the PPA, the CMEC contracts continue to provide EDP a stable gross margin. There is no volume, price or margin risk, there is, however operational risk (a non-available plant results in an adjustment to the gross margin) and downward revision risk. The memorandum of understanding (MOU) which contains measures the IMP would like Portugal to implement to limit the additional cost associated with the production of electricity, suggests that the Portuguese government should renegotiate or revise downward CMEC costs.
The Portuguese government aims at reducing the energy costs of the electrical system and therefore it announced plans to cut costs by approximately €1.8bn until 2020. The program involves the following cuts: a cut between €280m and
€330m for power plants under the PPA/CMEC contracts, between €300m and
Figure 24 –CMEC annual maintenance cost (€m)
“EDP–ENERGIAS DE PORTUGAL” COMPANY REPORT
THIS
DOCUMENT
IS
NOT
AN
INVESTMENT
RECOMMENDATION
AND
SHALL
BE
USED
EXCLUSIVELY
FOR
ACADEMIC
PURPOSES
(SEE DISCLOSURES AND DISCLAIMERS AT END OF DOCUMENT)HYDRO MW End of PPA Total Hydro 4095
Alto Lindoso 630 2024 Miranda 369 2013 Aguieira 336 2024 Valeira 240 2024 Bemposta 240 2013 Carrapatelo 201 2024 Picote 195 2013 Frades 192 2027 Pocinho 186 2024 Réguas 180 2024 Castelo B. 159 2015 V. Nova 144 2015 Torrão 140 2024 Fratel 132 2020 Vilarinho Fumas 125 2022 Crestuma-lever 117 2024 Cabril 108 2015 Alto Rabagão 68 2015 Caniçada 62 2015 Tabuaço 58 2024 Bouça 44 2015 Salamonde 42 2015 Pracana 41 2024 Caldeirão 40 2024 Raiva 24 2024 Touvedo 22 2024
€450m for renewable power plants and a cut of €375m regarding the warranty
system. The remaining is attributed to other energy reduced costs. The austerity measures will start being implemented by 2013 and are expected to have a higher impact in 2019.
EDP and the Portuguese government have agreed to cut the annual revenues related to the CMECs financial mechanism by €13m32 from 2013 until 202733 (the end of the last contract lifetime). We valued the impact at a €0.06 decrease in
EDP’s target price.
We believe there will be no further cuts beyond the ones already mentioned above. The company is in the favorable position after it has been through the liberalisation process. Also part of the company’s debt is conditioned on those contracts which were agreed before the liberalisation start. However, exceptional circumstances currently exist and given the company minor possibility to comprise on the payment of lower CMECs, we developed an alternative scenario with a 5% probability in which there is a €25m decrease(instead of the €13m) in
EDP’s regulated margins per annum until 2027. The base scenario (90%)
incorporates the already announced adjustments by the Portuguese government
(€13m). Impacts are reported in Appendix 1.
Also worth mentioning is CMECs final review in 2017. A recalculation of additional CMECs will be conducted, with no further annual adjustments if market forecasts are different from reality. As a result, from that date onwards, EDP will no longer receive financial compensations in case of positive deviations but it still has the right to a CMEC base annuity. Therefore, from then on, the company will start facing margin risk.
VALUATION
The company has currently a capacity of 6233MW under PPA/CMEC system, of which 4095MW are hydro capacity (26 plants) whereas thermal capacity represents about 2138MW (2 plants). PPA start expiring in 2013-2015E and most of them will have been expired by 2025. Once the PPAs end, hydro plants are expected to switch to the liberalised market and their profitability starts being affected by changes in demand, contrary to oil-based plants, which are to be decommissioned. As a consequence, we expect gross margins in this business unit to reduce over time until market generation is fully liberalized. Assuming a
32
EDP Investor Day May 2012
33
Millennium BCP – Newsletter de Investimentos (May 21 2012) Figure 25 – PPA expiration date
EDP and the Portuguese government have agreed to cut the annual revenues related to the CMECs financial
mechanism by €13m per
annum
“EDP–ENERGIAS DE PORTUGAL” COMPANY REPORT
THIS
DOCUMENT
IS
NOT
AN
INVESTMENT
RECOMMENDATION
AND
SHALL
BE
USED
EXCLUSIVELY
FOR
ACADEMIC
PURPOSES
(SEE DISCLOSURES AND DISCLAIMERS AT END OF DOCUMENT)THERMAL MW End of PPA
Sines (Coal) 1192 2017
Setúbal (Fuel-Oil) 946 2012
Carregado (Fuel-Oil) 710 2010
Barreiro (Fue-Oil) 56 2009
Tunes (Gas-Oil) 165 2007
877 826 802
712 667 665 586
2010 2011 2012 2013 2014 2015 2016 RG EBITDA (€million)
situation where no downward revision occurs, gross margins on the plants operating under PPA would be as follows:
With market deregulation taking place up until 2017, we valued this business by considering PPA gross margins expected from 2012 to 2016, set in a way to evolve with inflation. For power plants whose PPA contracts were supposed to remain alive after 2016, we assumed they will switch to the liberalised market in 2017, summing up their respective NPV CMEC annuity at the end of our valuation (power plants stop receiving a CMEC adjustment but they are still entitled to a CMEC annuity).
Operational costs are mostly comprised of supplies, services and labor costs and were assumed to evolve according to the unit’s total installed capacity. At the operational level, EBITDA is likely to reduce over the next five years, which suggests a slowdown in this segment. In the future, we anticipate a lower contribution from this unit to the overall group. Regulated generation EBITDA is expected to represent about 12% of total EBITDA in 2016 in opposition to 23% in 2011.
Capital expenditures (capex) are expected to be more modest than it has historically been. Capex in the RG unit amounted to €59m in 2011 versus€96 m in 2010. The bulk of this unit investments have been reported to maintenance capex as well as to new DeNOx facilities, with EDP taking advantage of the possibility of investing at an 8.5% remuneration rate. As opposed to other segments, this unit is not intended to remain a strong investment pace so we
Figure 26 - Timeline of PPA/CMEC (GW)
Source: EDP
Source: EDP
Source: EDP and Nova Research team
Figure 27 –RG’s EBITDA evolution
“EDP–ENERGIAS DE PORTUGAL” COMPANY REPORT
THIS
DOCUMENT
IS
NOT
AN
INVESTMENT
RECOMMENDATION
AND
SHALL
BE
USED
EXCLUSIVELY
FOR
ACADEMIC
PURPOSES
(SEE DISCLOSURES AND DISCLAIMERS AT END OF DOCUMENT)PPA/PRE DCF | € Million 2010 2011E 2012E 2013E 2014E 2015E 2016E
EBIT 662.8 614.6 598.7 515.7 478.7 484.8 412.8
(-) Income taxes 198.2 162.9 158.7 136.7 126.9 128.5 109.4
(+) Depreciation 216.4 211.9 203.7 196.0 188.0 180.4 173.0
(-) CAPEX 96.0 58.9 45.1 45.1 33.0 33.0 30.2
(-) Investment in WC 99.9 50.2 25.7 7.3 3.6 0.1 5.5
Free Cash Flow (FCF) 485.1 554.5 573.0 522.7 503.3 503.7 440.7
Discounted Free Cash Flow (DCF) 573.0 488.9 440.4 412.3 337.4
PPA+PRE (ex - wind) EV WACC g ROIC PRE
3,013 6.9% 2.3% 7.4%
T. Value PRE NOPLAT2017
66.5 761.1
forecast a small decline in capex until 2016, mainly driven by the power plants move to the liberalised market.
LIBERALISED GENERATION (LG)
In 2011, the liberalised generation (LG) unit represented 9.7% of total EBITDA, which is equivalent to an EBITDA volume of approximately €363m. LG includes operations both in Portugal and Spain and it is gaining visibility within the company as the market deregulation is taking place. Under LG, EDP has currently an installed capacity of 3.9 GW in Portugal and 3.7 GW in Spain which is now one gigawatt more than its last year total value. This business unit has been one of the segments with the highest growth in installed capacity, mostly towards hydro-based, so as to avoid the fast increase in world energy prices and manages to be less penalized in terms of CO2 emission costs. The effects of the economic slowdown in this segment were mostly visible at the operational level. The overall generation output suffered an 11% decrease, from 17,144 GWh in 2010 to 15,196 GWh in 2011, however, the company’s EBITDA rose by 1% in 2011, mainly supported by the higher contribution from Spain. The output from
EDP’s coal plants increased by 26% in 2011 as a mean to avoid rising natural gas production costs, while the output from hydro plants was 24% lower in 2011. Even though the company faced higher production costs in 2011 than in 2010, the average market price increase from €49.7/MWh to €57.5MWh in 2011 resulted in a quite stable EBITDA.
m
Iberian liberalized generation represent approximately 9.7% of EBITDA
Figure 28 – PPA/PRE DCF