Point cloud quality evaluation: Towards a definition
for test conditions
Luis A. da Silva Cruz
∗§, Emil Dumi´c
†, Evangelos Alexiou
‡, Jo˜ao Prazeres
¶§, Rafael Duarte
∗§,
Manuela Pereira
¶§, Antonio Pinheiro
¶§, Touradj Ebrahimi
‡∗Department of Electrical and Computer Engineering, University of Coimbra, Portugal
§Instituto de Telecomunicacoes, Portugal
†Department of Electrical Engineering, University North, Croatia
¶University of Beira Interior, Portugal
‡Multimedia Signal Processing Group, ´Ecole Polytechnique F´ed´erale de Lausanne, Switzerland
Abstract—Recently stakeholders in the area of multimedia representation and transmission have been looking at plenoptic technologies to improve immersive experience. Among these technologies, point clouds denote a volumetric information rep-resentation format with important applications in the entertain-ment, automotive and geographical mapping industries. There is some consensus that state-of-the-art solutions for efficient storage and communication of point clouds are far from satisfactory. This paper describes a study on point cloud quality evaluation, conducted in the context of JPEG Pleno to help define the test conditions of future compression proposals. A heterogeneous set of static point clouds in terms of number of points, geo-metric structure and represented scenarios were selected and compressed using octree-pruning and a projection-based method, with three different levels of degradation. The models were comprised of both geometrical and color information and were displayed using point sizes large enough to ensure observation of watertight surfaces. The stimuli under assessment were presented to the observers on 2D displays as animations, after defining suitable camera paths to enable visualization of the models in their entirety and realistic consumption. The experiments were carried out in three different laboratories and the subjective scores were used in a series of correlation studies to benchmark objective quality metrics and assess inter-laboratory consistency. Index Terms—quality assessment, point cloud, quality metrics
2019 Eleventh International Conference on Quality of Multimedia Experience (QoMEX)
I. INTRODUCTION
In recent years several 3D volume information represen-tation formats, such as light fields, holography and points clouds (PC) have been attracting interest from industry and academia. Due to several important applications, like en-vironment mapping in autonomous driving systems, urban landscape mapping, virtual and augmented reality (VR/AR), as well as the increasing availability of lower priced scanners, PCs are becoming a first choice 3D data representation format. However, PCs can be rather expensive in terms of storage and transmission costs, due to the large number of points used to This work was partially funded by FCT/MEC project UID/EEA/50008/2019 and co-funded by Swiss National Foundation for Scientific Research project FN 178854.
represent the imaged scene and large number of attributes (e.g., color, normals, etc.) recorded per point. It is thus important to have efficient PC compression algorithms. The ISO/IEC JTC 1/SC 29/WG1 (JPEG) committee, through the activities of the JPEG Pleno project has created an ad-hoc group (AhG) focused on the development of solutions for the efficient representation of static PC. The AhG mandates include a task to “Run subjective tests and assess performance of objective metrics...”, which requires the definition of a suitable frame-work to conduct PC subjective quality evaluations in order to assemble a set of quality scores that can be used in (objective) quality estimators evaluation and tuning. To properly define the framework, research is needed on which PC rendering methods, what type of displays (2D, 3D, head-mounted), and what evaluation methodologies should be adopted.
In the literature, several studies on subjective quality as-sessment of PCs have been conducted, based on a wide range of different setups and protocols. In [1], a novel subjective quality evaluation methodology was presented that can be used to assess the difference between an original and a degraded 3D color model. The PC degradations were applied to geometry and color separately, using uniformly distributed noise. In [2] and [3] interactive approaches in a desktop setup and using a head-mounted display were proposed, respectively, in order to subjectively assess geometry-only point clouds subject to Gaussian noise and octree-based compression. In [4], a generic and real-time time-varying PC codec for 3D immersive video has been proposed, which is suitable for mixed reality appli-cations where 3D PCs are acquired at a fast rate. Subjective quality of the codec performance was evaluated in a mixed reality system that combines natural PC data and computer graphics-based 3D contents. In [5], subjective assessment of PC denoising algorithms and evaluation of commonly used objective quality metrics was conducted. The contents were evaluated after applying the screened Poisson surface reconstruction algorithm [6]. The observers rated 2D video sequences of the models after rotations around the vertical and the horizontal axis. In [7] and [8], PCs rendered as surfaces, employing the same surface reconstruction technique [6], were visualized and assessed in 2D and 3D monitors, respectively, 978-1-5386-8212-8/19/$31.00 ©2019 IEEE
following a passive evaluation. In [9], subjective and objective quality assessment of PCs degraded by compression artifacts was performed. The most popular objective quality metrics were benchmarked against human judgments obtained from the subjective experiment. The degradations considered were compression using Octree-based and graph-based methods. In [10], a subjective evaluation campaign along with bench-marking results of voxelized PCs subject to compression arti-facts using the codec proposed in [4] was conducted, showing that geometry distortions are rated more severely with respect to color. In [11], subjective and objective quality assessment results were presented for volumetric video compression using the state-of-the-art MPEG Point Cloud Compression Test Model Category 2 (TMC2). Results show that, although it has a great effect on geometric quality metrics, the higher density input point count does not affect the perceived quality as long as the presentation is plausible for human viewers.
In this work, we extend the previous efforts by including large-scale PCs in our experiment and proposing a passive evaluation scenario through animated videos with different navigation paths per model. The contents under assessment are encoded using two radically different encoding approaches, at different quality levels. The processed stimuli are displayed using a variable point size and camera distance per model and level of degradation, in order to result in perception of watertight models. Finally, the state-of-the-art objective quality metrics are benchmarked and their limitations are discussed.
II. SUBJECTIVEASSESSMENT
In this section the design of the subjective test is described. In particular, the procedure to prepare the contents under assessment and the subjective evaluation methodology that was adopted are detailed.
A. Content Preparation
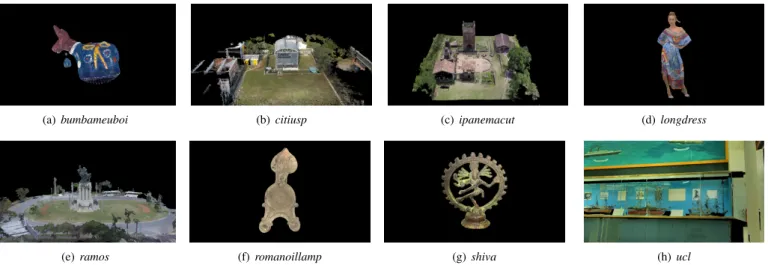
In this study, a dataset of 8 static PCs was used with texture and geometry information. In particular, 4 small-scale PCs, namely, bumbameuboi, longdress, romanoillamp and shiva, and 4 large-scale PCs, namely, ucl, citiusp, ipanemacut and
ramoswere selected. The bumbameuboi, citiusp, ipanemacut,
ramos and romanoillamp contents can be found in [12], the
longdressmodel can be found in [13], the ucl in [14], while
shiva is part of [15]. In this paper, small-scale PCs can be
defined as human sized objects or smaller, with up to about 1 million points. A frontal view of the reference PCs of every selected content are illustrated in Figure 1.
To degrade the original PCs, two different compression schemes were employed. The first method is annotated as octree pruning and it was implemented using the Point Cloud Library (PCL) [16]. Octree pruning was selected to represent artifacts occurred after regular removal of points, which are displaced by a known maximum error. Under this type of compression, the contents are enclosed in an octee structure. Modifying the size of the leaf nodes, which is referred as Level of Details (LoD), the resolution of the content is adjusted correspondingly. For instance, by increasing the LoD, the
number of points of the compressed object naturally decreases. The second method is a projection-based encoder implemented in the 3DTK toolkit [17]. Different panorama resolutions and equi-rectangular projections provided by the software were used to encode the contents under assessment.
The models were compressed at three quality levels: high, medium and low. Each quality level was defined based on a percentage of remaining points after PCL compression, which was determined per content through expert viewing. In par-ticular, starting from the first method, different octree depths were tested for every model. After defining the LoD that corresponds to the desired quality level, a target percentage of remaining points is identified. For the second method, 3DTK, a binary search tree was employed to determine the appropriate panorama size in order to achieve the required target percentage. The method starts with 32768x32768 pixels, which is a limitation imposed by the OpenCV software used by 3DTK. The number of points for every reference and distorted content, along with the octree depths that were used for octree-pruning and the panorama resolution for the projection based compression, can be found in Table I. The 3DTK panorama resolution was determined to achieve similar number of points as PCL compression for every quality level. Thus, the resulting visual quality can be different than the target quality level.
Before encoding, the original PCs were scaled to fit in a bounding box of size 1 and translated at the origin (0, 0, 0). For both small-scale and large-scale contents, different point sizes per quality level and model were used; however, the same point size was used across one model. Moreover, different distances between the camera and the origin of every content were defined. Several adjustments for the combination of these parameters (i.e., point size and camera distance) were tested, and agreed after expert viewing, in order to result in perception of watertight models. Finally, to account for a fair comparison between the two encoding schemes, the same point size was used for the two codecs per quality level and content. The exact values that were used in our test, as specified in the CloudCompare [18] software, are reported in Table I.
Regarding the generation of animated videos that were consumed by the participants in order to rate the visual quality of the models under assessment, we followed different camera paths per type of content. In particular, for small-scale PCs, to account for an outer inspection of the content, the camera was rotated around the horizontal and, then, around the vertical axis of the center of each model in steps of 1°. For large-scale PCs, excluding ucl, the camera was rotated around the vertical axis of the center of the object in steps of 0.5°. In every case, the position of the camera was set so that every content could be viewed entirely. For ucl, a navigation path through the scenery was specified, which resulted in a more immersive scenario of consuming a large-scale content inner at different visualization distances. For this content, it was not possible to find one point in space around which the camera would rotate, in order to result in the perception of a watertight scene using fixed point size. A total of 720 still frames of 1920x1080 resolution were captured for every stimulus. The still images
(a) bumbameuboi (b) citiusp (c) ipanemacut (d) longdress
(e) ramos (f) romanoillamp (g) shiva (h) ucl
Fig. 1. Frontal view of each point cloud. TABLE I
COMPRESSION AND RENDERING CONFIGURATIONS
Type of content Original name Quality variations Original number of points Target % of points
Compression Rendering
PCL (8 color bits) 3DTK
Point size Distance Octree depth # of points % of points Panorama resolution # of points % of points
Small-scale contents bumbameuboi original 150379 100 - - - 4 2.766365 high - 46.02 8 69197 46.02 651x651 68971 45.86 6 2.766365 medium - 18.55 7 27891 18.55 264x264 27796 18.48 7 2.766365 low - 5.47 6 8229 5.47 116x116 8151 5.42 13 2.766365 longdress original 857966 100 - - - 2 2.229018 high - 100 10 857966 100 32768x32768 844980 98.49 2 2.229018 medium - 29.64 9 254322 29.64 728x728 254380 29.65 3 2.229018 low - 7.75 8 66520 7.75 304x304 67045 7.81 4 2.229018 romanoillamp original 1286052 100 - - - 2 1.990584 high - 49.45 10 636008 49.45 3104x3104 635938 49.45 2 1.990584 medium - 21.00 9 270088 21.00 984x984 270663 21.05 3 1.990584 low - 6.00 8 77104 6.00 464x464 76141 5.92 5 1.990584 shiva original 1010591 100 - - - 1 2.625442 high - 89.12 10 900661 89.12 11648x11648 900724 89.13 1 2.625442 medium - 41.51 9 419522 41.51 2608x2608 419752 41.54 2 2.625442 low - 12.07 8 121995 12.07 824x824 122054 12.08 4 2.625442 Lar ge-scale contents citiusp original 5929878 100 - - - 1 1 high - 44.78 11 2655558 44.78 3520x3520 2658601 44.83 1 1 medium - 16.68 10 989112 16.68 1520x1520 992361 16.73 2 1 low - 4.89 9 289951 4.89 720x720 294695 4.97 4 1 ipanemacut original 8128921 100 - - - 1 1.400146 high - 60.76 11 4928736 60.76 8704x8704 4931486 60.67 1 1.400146 medium - 24.24 10 1970213 24.24 2976x2976 1962687 24.14 2 1.400146 low - 6.68 9 543214 6.68 1200x1200 546155 6.72 3 1.400146 ramos original 64153694 100 - - - 1 0.966166 high - 35.02 12 22468372 35.02 10176x10176 22490243 35.06 1 0.966166 medium - 11.66 11 7481209 11.66 4928x4928 7487043 11.67 2 0.966166 low - 3.04 10 1952746 3.04 2304x2304 1941900 3.03 3 0.966166 ucl original 73866302 100 - - - 2 N/A high - 17.51 11 12932875 17.51 5600x5600 12900605 17.46 3 N/A medium - 4.52 10 3339764 4.52 2560x2560 3267733 4.42 4 N/A low - 1.12 9 826790 1.12 1280x1280 849478 1.15 9 N/A
were visually losslessly compressed (i.e., constant rate factor equal to 17) with an H.264/AVC encoder (using FFmpeg software), producing an animated video of 30 fps with a total duration of 24 seconds. The background color was set to black. Finally, the camera paths for inspection, as well as the acquisition of still images was performed using the CloudCompare [18] software.
B. Evaluation Methodology
The subjective experiments were conducted in 3 different laboratories: University of Beira Interior (UBI), Covilh˜a, Por-tugal, University of Coimbra, Coimbra, Portugal and Uni-versity North (UNIN), Varaˇzdin, Croatia. The conditions of every test environment were adjusted to follow the ITU-R Recommendation BT.500-13 [19]. The equipment used per
test laboratory is described in Table II. A passive subjective methodology was applied, with the subjects visualizing the generated video sequences in the MPV video player which was adjusted for our needs. The participants were able to provide their scores through a customized interface either during, or after the completion of the playback animation. This means, that the subjects were allowed to submit their judgment, potentially, before the end of the animated video.
The simultaneous Double-Stimulus Impairment Scale
(DSIS) test method was adopted with 5levels rating (1 very annoying, 2 annoying, 3 slightly annoying, 4 -perceptible, but not annoying, 5 - imperceptible), including a hidden reference for sanity check. Both the reference and the degraded stimuli were simultaneously shown to the observer
TABLE II
EQUIPMENT INFORMATION PER LABORATORY.
Monitor Inches Resolution View Distance
UBI Sony OLED TV 55” 3840x2160 2.19 m
(±20 cm) UC Sony TV 49” 3840x2160 1.8 m KD-49X8005C (FV ±30 cm) UNIN Sony TV 55” 3840x2160 1.5 m KD-55x8505C (FV ±15 cm) TABLE III
SUBJECTS INFORMATION PER LABORATORY.
Males Females Overall Year Average Outliers
span age
UBI 10 9 19 19-31 20.5 0
UC 7 8 15 18-54 26.86 0
UNIN 15 1 16 19-58 22.75 0
side-by-side, and every subject rated the visual quality of the processed with respect to the reference stimulus, which were clearly annotated. To avoid biases, in half of the individual evaluations, the reference was placed on the right and the degraded content on the left side of the screen, and vice-versa for the rest of the evaluations. Also, particular care was given not to present the same content type consecutively.
At the beginning of each individual evaluation, a training session took place, in order to familiarize the subjects with the artifacts under assessment. The shiva content was selected to represent a small-scale, and the ipanemacut model to represent a large-scale object; thus, they were excluded from the actual subjective tests. The training was performed using 8 animated video sequences. For both training contents, 3 different levels of degradation were presented together with the original video sequences, in order to illustrate the range of visible distortions. An overall of 42 scores were obtained per evaluation session, considering that each subject assessed 6 test models degraded by 2 compression schemes at 3 distinct quality levels, plus hidden references. An outlier detection algorithm based on ITU-R Recommendation BT.500-13 [19] was applied to the collected scores from every test laboratory, separately. In every case, no outliers were found. Thus, the mean opinion scores (MOS) and the 95% Confidence Intervals (CIs), assuming a Student’s t-distribution were computed on every set of scores. For this calculation, we assumed that scores follow a normal distribution. In Table III, we report observers information, per test laboratory.
III. RESULTS
In this section, the results of our analysis are provided. The MOS curves are demonstrated, indicating the performance of each codec from every test laboratory, followed by the inter-laboratory correlations. Finally, benchmarking results of the state-of-the-art objective quality metrics are reported.
A. Subjective Scores
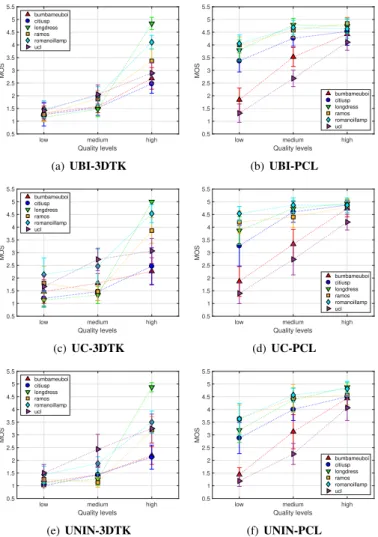
The subjective scores against the quality levels are shown in Figure 2 for each tested codec and participating laboratory, independently. Specifically, the subjective scores obtained for
low medium high
Quality levels 0.5 1 1.5 2 2.5 3 3.5 4 4.5 5 5.5 MOS bumbameuboi citiusp longdress ramos romanoillamp ucl (a) UBI-3DTK
low medium high
Quality levels 0.5 1 1.5 2 2.5 3 3.5 4 4.5 5 5.5 MOS bumbameuboi citiusp longdress ramos romanoillamp ucl (b) UBI-PCL
low medium high
Quality levels 0.5 1 1.5 2 2.5 3 3.5 4 4.5 5 5.5 MOS bumbameuboi citiusp longdress ramos romanoillamp ucl (c) UC-3DTK
low medium high
Quality levels 0.5 1 1.5 2 2.5 3 3.5 4 4.5 5 5.5 MOS bumbameuboi citiusp longdress ramos romanoillamp ucl (d) UC-PCL
low medium high
Quality levels 0.5 1 1.5 2 2.5 3 3.5 4 4.5 5 5.5 MOS bumbameuboi citiusp longdress ramos romanoillamp ucl (e) UNIN-3DTK
low medium high
Quality levels 0.5 1 1.5 2 2.5 3 3.5 4 4.5 5 5.5 MOS bumbameuboi citiusp longdress ramos romanoillamp ucl (f) UNIN-PCL
Fig. 2. Subjective scores against quality levels per laboratory and compression method.
the projection-based encoder (3DTK) and the octree-pruning (PCL), are presented in the left and right plots column, respectively. Based on observers’ opinion, the types of artifacts that are introduced by the octree-based are preferred over the types of artifacts that are caused by the projection-based encoder (as implemented by the 3DTK). This result is justified if we consider that by increasing the size of the points, distortions that occur by an encoding scheme that leads to regularly spaced sparser versions of the original contents, can be compensated. On the contrary, visible distortions, such as missing structures, or areas in a content that are presented due to occlusions, are notably more annoying and, thus, subjects rated them poorly.
B. Comparison between Subjective Scores from different Labs To confirm the validity of the subjective scores that were obtained from the participated test laboratories, we use a series of performance indexes. In particular, the Pearson Correlation Coefficient (PCC), the Spearman Rank Order Correlation Coefficient (SROCC), the Root-Mean Squared Error (RMSE) and the Outlier Ratio (OR) are computed, to measure the linearity, monotonicity, accuracy and consistency of the results.
0.5 1 1.5 2 2.5 3 3.5 4 4.5 5 5.5 MOS (UC) 0.5 1 1.5 2 2.5 3 3.5 4 4.5 5 5.5 MOS (UBI) bumbameuboi citiusp longdress ramos romanoillamp ucl linear fitting cubic fitting (a) UBI vs UC 0.5 1 1.5 2 2.5 3 3.5 4 4.5 5 5.5 MOS (UBI) 0.5 1 1.5 2 2.5 3 3.5 4 4.5 5 5.5 MOS (UC) bumbameuboi citiusp longdress ramos romanoillamp ucl linear fitting cubic fitting (b) UC vs UBI 0.5 1 1.5 2 2.5 3 3.5 4 4.5 5 5.5 MOS (UNIN) 0.5 1 1.5 2 2.5 3 3.5 4 4.5 5 5.5 MOS (UBI) bumbameuboi citiusp longdress ramos romanoillamp ucl linear fitting cubic fitting (c) UBI vs UNIN 0.5 1 1.5 2 2.5 3 3.5 4 4.5 5 5.5 MOS (UBI) 0.5 1 1.5 2 2.5 3 3.5 4 4.5 5 5.5 MOS (UNIN) bumbameuboi citiusp longdress ramos romanoillamp ucl linear fitting cubic fitting (d) UNIN vs UBI 0.5 1 1.5 2 2.5 3 3.5 4 4.5 5 5.5 MOS (UNIN) 0.5 1 1.5 2 2.5 3 3.5 4 4.5 5 5.5 MOS (UC) bumbameuboi citiusp longdress ramos romanoillamp ucl linear fitting cubic fitting (e) UC vs UNIN 0.5 1 1.5 2 2.5 3 3.5 4 4.5 5 5.5 MOS (UC) 0.5 1 1.5 2 2.5 3 3.5 4 4.5 5 5.5 MOS (UNIN) bumbameuboi citiusp longdress ramos romanoillamp ucl linear fitting cubic fitting (f) UNIN vs UC Fig. 3. No fitting, Linear and Cubic fitting, for correlation evaluation between the three laboratories results (Bold text represents the ground truth).
TABLE IV
PERFORMANCEINDEXES TO EVALUATE THE CORRELATION BETWEEN
LABORATORIES WITHOUT APPLYING ANY FITTING FUNCTION(BOLD TEXT
REPRESENTS THE GROUND TRUTH).
UBI UC UBI UNIN UC UNIN
vs vs vs vs vs vs
UC UBI UNIN UBI UNIN UC
PCC 0.981 0.981 0.982 0.982 0.981 0.981 SROCC 0.965 0.965 0.966 0.966 0.978 0.978 RMSE 0.304 0.304 0.326 0.326 0.432 0.432 OR 0.278 0.222 0.333 0.222 0.306 0.444 CE (%) 100.00 100.00 100.00 100.00 100.00 100.00 UE (%) 0.00 0.00 0.00 0.00 0.00 0.00 OE (%) 0.00 0.00 0.00 0.00 0.00 0.00 CD (%) 89.84 89.84 89.52 89.52 90.16 90.16 FR (%) 0.00 0.00 0.00 0.00 0.00 0.00 FD (%) 3.33 6.83 4.44 6.03 5.71 4.13 FT (%) 6.83 3.33 6.03 4.44 4.13 5.71
Furthermore, the Correct Estimation (CE), Under Estimation (UE) and Over Estimation (OE) percentages are used, as proposed in the Recommendation ITU-T P.1401 [20], to check for statistically equivalent MOS results. Finally, the False Ranking (FR), False Differentiation (FD), False Tie (FT) and Correct Decision (CD) percentages were computed using Recommendation ITU-T J.149 [21], to check for different
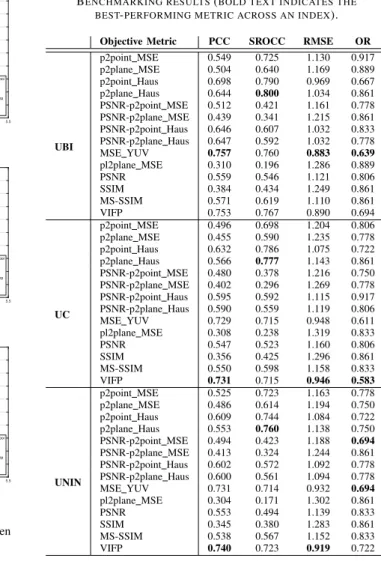
TABLE V
BENCHMARKING RESULTS(BOLD TEXT INDICATES THE
BEST-PERFORMING METRIC ACROSS AN INDEX).
Objective Metric PCC SROCC RMSE OR
UBI p2point MSE 0.549 0.725 1.130 0.917 p2plane MSE 0.504 0.640 1.169 0.889 p2point Haus 0.698 0.790 0.969 0.667 p2plane Haus 0.644 0.800 1.034 0.861 PSNR-p2point MSE 0.512 0.421 1.161 0.778 PSNR-p2plane MSE 0.439 0.341 1.215 0.861 PSNR-p2point Haus 0.646 0.607 1.032 0.833 PSNR-p2plane Haus 0.647 0.592 1.032 0.778 MSE YUV 0.757 0.760 0.883 0.639 pl2plane MSE 0.310 0.196 1.286 0.889 PSNR 0.559 0.546 1.121 0.806 SSIM 0.384 0.434 1.249 0.861 MS-SSIM 0.571 0.619 1.110 0.861 VIFP 0.753 0.767 0.890 0.694 UC p2point MSE 0.496 0.698 1.204 0.806 p2plane MSE 0.455 0.590 1.235 0.778 p2point Haus 0.632 0.786 1.075 0.722 p2plane Haus 0.566 0.777 1.143 0.861 PSNR-p2point MSE 0.480 0.378 1.216 0.750 PSNR-p2plane MSE 0.402 0.296 1.269 0.778 PSNR-p2point Haus 0.595 0.592 1.115 0.917 PSNR-p2plane Haus 0.590 0.559 1.119 0.806 MSE YUV 0.729 0.715 0.948 0.611 pl2plane MSE 0.308 0.238 1.319 0.833 PSNR 0.547 0.523 1.160 0.806 SSIM 0.356 0.425 1.296 0.861 MS-SSIM 0.550 0.598 1.158 0.833 VIFP 0.731 0.715 0.946 0.583 UNIN p2point MSE 0.525 0.723 1.163 0.778 p2plane MSE 0.486 0.614 1.194 0.750 p2point Haus 0.609 0.744 1.084 0.722 p2plane Haus 0.553 0.760 1.138 0.750 PSNR-p2point MSE 0.494 0.423 1.188 0.694 PSNR-p2plane MSE 0.413 0.324 1.244 0.861 PSNR-p2point Haus 0.602 0.572 1.092 0.778 PSNR-p2plane Haus 0.600 0.561 1.094 0.778 MSE YUV 0.731 0.714 0.932 0.694 pl2plane MSE 0.304 0.171 1.302 0.861 PSNR 0.553 0.494 1.139 0.833 SSIM 0.345 0.380 1.283 0.861 MS-SSIM 0.538 0.567 1.152 0.833 VIFP 0.740 0.723 0.919 0.722
conclusions on data points pairs.
In Figure 3, scatter plots with the MOS obtained in the different laboratories against every other participated labora-tory are presented, along with every fitting function that was applied (i.e., no-fitting, linear fitting, monotonic cubic fitting). As can be seen, the correlation is high for every regression model. Thus, in Table IV, the performance indexes without applying any fitting are reported, to account for the worst case scenario. Based on these scores, a correct estimation of 100% is achieved among each pair combination. The correct decision is very high with a percentage of approximately 90%, while the false differentiation and false tie remain quite low, with false ranking being equal to 0%. Naturally, slightly better results are observed by applying the other two models.
C. Correlation between Subjective and Objective Scores The subjective scores were correlated with state-of-the-art objective metrics for quality assessment of PCs. The point-to-point (p2point-to-point) and point-to-point-to-plane (p2plane) metrics were used to estimate geometric distortions [22], using the Mean Squared Error (MSE) and the Hausdorff distance as the geometric error measure. The geometry PSNR ratio is also computed,
as defined in [22]: ratio of the max distance of nearest neighbors divided by the squared geometric error value (MSE or Hausdorff). The MSE on the YUV representation was also employed to estimate the color degradations. In particular, the default RGB was initially converted to the YUV colorspace, following the ITU-R Recommendation BT.709-3 [23]. Then, a weight of 6 for luma, and 1 per chroma channel were applied [24], in order to compute a single value between a pair of associated points. Moreover, the plane-to-plane (pl2plane) metric [25] is employed. For every content, the normal vectors were estimated on 10 nearest neighbors using PCL. Finally, the projection-based metrics described in [10] were applied on the total number of frames that formed the animated videos which were assessed by the subjects during the experiment.
It should be noted that in order to address excessive memory allocation issues occurred during computations of objective quality metrics and normal estimation algorithms for two large-scale PCs (i.e., ucl and ramos), the latter were segmented in several smaller patches. The outputs of the objective metrics were modified appropriately and pools of individual distortions were obtained to accurately compute the global distortions.
To compare the objective scores against the subjective ground truth, the performance indexes proposed in the Rec-ommendation ITU-T P.1401 [20] are employed. Specifically, the PCC, SROCC, RMSE and OR were issued on pairs of MOS and predicted MOS, to measure the performance of each metric. The predicted MOS for every objective metric, was obtained after applying the monotonic cubic fitting function on the objective scores. Based on our results presented in Table V, the best-performing metrics found to be the MSE YUV, which captures only color distortions, and the VIFP, which is a projection-based metric, for different ground truth datasets.
IV. CONCLUSIONS
In this study, a subjective methodology for point cloud compression quality evaluation is presented. Our methodology successfully provides effective results for two different codecs, showing that point removal in a regular way is less annoy-ing to human subjects. Moreover the proposed methodology suggests an alternative framework for passive evaluation that reveals high correlation with objective measures. This can be explained because in this experiment we used a variety of point clouds regarding its size and point number, with both geometry and color information. This is opposed to the previous exper-iments in which point clouds have similar number of points, or only geometry information. The reliability of the method can be confirmed by the comparison between subjective scores between the involved test laboratories which remains high as well as similar correlation between subjective and objective scores in every laboratory.
REFERENCES
[1] J. Zhang, W. Huang, X. Zhu, and J. N. Hwang, “A subjective quality evaluation for 3D point cloud models,” in 2014 International Conference on Audio, Language and Image Processing, July 2014, pp. 827–831. [2] E. Alexiou and T. Ebrahimi, “On subjective and objective quality
evalu-ation of point cloud geometry,” in 2017 Ninth Internevalu-ational Conference on Quality of Multimedia Experience (QoMEX), May 2017, pp. 1–3.
[3] E. Alexiou, E. Upenik, and T. Ebrahimi, “Towards subjective quality assessment of point cloud imaging in augmented reality,” in 2017 IEEE 19th International Workshop on Multimedia Signal Processing (MMSP), Oct. 2017, pp. 1–6.
[4] R. Mekuria, K. Blom, and P. Cesar, “Design, Implementation, and Evaluation of a Point Cloud Codec for Tele-Immersive Video,” IEEE Transactions on Circuits and Systems for Video Technology, vol. 27, no. 4, pp. 828–842, April 2017.
[5] A. Javaheri, C. Brites, F. Pereira, and J. Ascenso, “Subjective and objective quality evaluation of 3D point cloud denoising algorithms,” in 2017 IEEE International Conference on Multimedia Expo Workshops (ICMEW), July 2017, pp. 1–6.
[6] M. Kazhdan and H. Hoppe, “Screened Poisson Surface Reconstruction,” ACM Trans. Graph., vol. 32, no. 3, pp. 29:1–29:13, July 2013. [7] E. Alexiou, T. Ebrahimi, M. V. Bernardo, M. Pereira, A. Pinheiro, L. A.
D. S. Cruz, C. Duarte, L. G. Dmitrovic, E. Dumic, D. Matkovic, and A. Skodras, “Point cloud subjective evaluation methodology based on 2d rendering,” in 2018 Tenth International Conference on Quality of Multimedia Experience (QoMEX), May 2018, pp. 1–6.
[8] E. Alexious, A. M. G. Pinheiro, C. Duarte, D. Matkovic, E. Dumic, L. A. da Silva Cruz, L. G. Dmitrovic, M. V. Bernardo, M. Pereira, and T. Ebrahimi, “Point cloud subjective evaluation methodology based on reconstructed surfaces,” vol. 10752, 2018, pp. 10 752 – 10 752 – 14. [Online]. Available: https://doi.org/10.1117/12.2321518
[9] A. Javaheri, C. Brites, F. Pereira, and J. Ascenso, “Subjective and objective quality evaluation of compressed point clouds,” in 2017 IEEE 19th International Workshop on Multimedia Signal Processing (MMSP), Oct. 2017, pp. 1–6.
[10] E. M. Torlig, E. Alexiou, T. A. Fonseca, R. L. de Queiroz, and T. Ebrahimi, “A novel methodology for quality assessment of voxelized point clouds,” in Proceedings of SPIE, ser. Applications of Digital Image Processing XLI, vol. 107520I, Sept. 2018.
[11] E. Zerman, P. Gao, C. Ozcinar, and A. Smoli´c, “Subjective and objective quality assessment for volumetric video compression,” 2018.
[12] University of Sao Paulo point cloud dataset, https://jpeg.org/plenodb/. [Online]. Available: http://uspaulopc.di.ubi.pt/
[13] JPEG Pleno Database, https://jpeg.org/plenodb/. [Online]. Available: https://jpeg.org/plenodb/pc/8ilabs/
[14] ScanLAB Projects Point Cloud data sets, https://jpeg.org/plenodb/. [Online]. Available: http://grebjpeg.epfl.ch/jpeg pc/index galleries.html [15] MPEG-I 3D Graphics Coding, “Draft Test Conditions and Complemen-tary Test material,” ISO/IEC MPEG2017/W16716, Geneva, Switzerland, Jan. 2017.
[16] R. B. Rusu and S. Cousins, “3D is here: Point Cloud Library (PCL),” in 2011 IEEE International Conference on Robotics and Automation, May 2011, pp. 1–4.
[17] 3DTK – The 3D Tookit, http://threedtk.de. [Online]. Available: http: //slam6d.sourceforge.net/
[18] 3D point cloud and mesh processing software Open Source Project. CloudCompare. [Online]. Available: http://www.danielgm.net/cc/ [19] ITU-R BT.500-13, “Methodology for the subjective assessment of the
quality of television pictures,” International Telecommunications Union, Jan. 2012.
[20] ITU-T P.1401, “Methods, metrics and procedures for statistical eval-uation, qualification and comparison of objective quality prediction models,” International Telecommunication Union, Jul. 2012.
[21] ITU-T J.149, “Method for specifying accuracy and cross-calibration of Video Quality Metrics (VQM),” International Telecommunication Union, Mar. 2004.
[22] D. Tian, H. Ochimizu, C. Feng, R. Cohen, and A. Vetro, “Evaluation metrics for point cloud compression,” ISO/IEC JTC m74008, , Geneva, Switzerland, Tech. Rep., January 2017.
[23] ITU-R BT.709-3, “Bt.709 : Parameter values for the hdtv standards for production and international programme exchange,” International Telecommunications Union, Feb. 1998.
[24] J.-R. Ohm, G. J. Sullivan, H. Schwarz, T. K. Tan, and T. Wiegand, “Comparison of the Coding Efficiency of Video Coding Standards-Including High Efficiency Video Coding (HEVC),” IEEE Trans. Cir. and Sys. for Video Technol., vol. 22, no. 12, pp. 1669–1684, 2012. [25] E. Alexiou and T. Ebrahimi, “Point Cloud Quality Assessment Metric
Based on Angular Similarity,” in 2018 IEEE International Conference on Multimedia and Expo (ICME), July 2018, pp. 1–6.