Moment Generating Function for the Rigorous
Performance Assessment of Direct-Detection
Baseband OFDM Communication Systems
João L. Rebola and Adolfo V. T. Cartaxo
Abstract—A new moment generating function (MGF) is
proposed to assess rigorously the performance of optically preamplified receivers with direct-detection employing baseband orthogonal frequency division multiplexing (OFDM). By com-parison with Monte Carlo simulation, the proposed MGF-based method shows very good accuracy when predicting the bit error probability for arbitrary optical and electrical filters, different numbers of OFDM subcarriers, and double sideband and single sideband optical OFDM signals. Its good accuracy when esti-mating the bit error probability in each individual subcarrier is also demonstrated. The new MGF-based method exhibits a signifi-cant improvement of accuracy when compared to the MGF-based method previously reported in the literature, especially for filter bandwidths not exceeding the OFDM signal bandwidth, which is the range corresponding to the optimum filter bandwidth.
Index Terms—Direct-detection receivers, moment generating
function, optical communications, orthogonal frequency division multiplexing (OFDM).
I. INTRODUCTION
I
N the past few years, orthogonal frequency division multi-plexing (OFDM) has emerged as an attractive modulation format for transmission in optical fiber telecommunication sys-tems [1], [2]. Two approaches have been mostly adopted for OFDM optical communications: coherent optical OFDM, with superior transmission performance and suitable for long-haul transmission systems, but with higher setup complexity; and di-rect detection (DD)-OFDM, which is the most cost-effective so-lution, since signal detection at the receiver side uses only a PIN photodetector and, hence, it is the most suitable for short-reach applications, such as passive optical networks based on OFDMManuscript received June 30, 2012; revised September 18, 2012; accepted October 09, 2012. Date of publication October 12, 2012; date of current version December 05, 2012. This work was supported in part by Fundação para a Ciência e a Tecnologia in the national TURBO-PTDC/EEA-TEL/104358/2008 project and by the European Union in the FIVER-FP7-ICT-2009-4-249142 project.
J. L. Rebola is with Instituto de Telecomunicações, 1049-001 Lisbon, Por-tugal and also with Instituto Universitário de Lisboa (ISCTE-IUL), IT-IUL, De-partment of Information Science and Technology, 1649-026 Lisbon, Portugal (email: [email protected]).
A. V. T. Cartaxo is with Instituto de Telecomunicações, 1049-001 Lisbon, Portugal and also with Technical University of Lisbon, Instituto Superior Téc-nico, Department of Electrical and Computer Engineering, 1049-001 Lisbon, Portugal (email: [email protected]).
Color versions of one or more of the figures in this paper are available online at http://ieeexplore.ieee.org.
Digital Object Identifier 10.1109/JLT.2012.2224639
[3]–[5]. Recent works demonstrate that DD-OFDM can be ex-tended to longer reaches and bit rates above 100 Gbit/s without enhancing excessively the receiver complexity [6].
Recently, the theoretical assessment of the performance of OFDM optical communication systems with direct-detection and pre-amplification at the receiver has been the subject of sev-eral works [7]–[10]. In the most recent work [10], an analytical formulation based on the calculation of the moment generating function (MGF) of the symbol detected in each OFDM subcar-rier was developed to evaluate the performance of a baseband DD-OFDM optical receiver. This formulation assumes that the noise samples prior to the Fast-Fourier Transform (FFT) block input can be considered uncorrelated. When this assumption is fulfilled, the proposed formulation provides reasonably accurate estimates of the performance of the DD-OFDM optical commu-nication system. However, when the impact of the noise samples correlation on the performance is high, its precision is severely diminished [10].
In this work, a new MGF, which characterizes rigorously the statistics of the noise after photodetection and OFDM signal de-modulation and solves the accuracy problem due to the noise samples correlation of the formulation reported in [10], is pro-posed. By using a semi-analytical simulation method [11], the MGF proposed in this work is used to evaluate rigorously the performance of optically pre-amplified DD-OFDM receivers. The accuracy of the MGF-based formulation is checked by com-parison of its bit error probability (BEP) estimates with the es-timates obtained from Monte Carlo (MC) simulation.
The remainder of this work is structured as follows. Section II presents the model used to characterize the decision variable at the DD-OFDM optical receiver output and the analytical development used to obtain the MGF of the decision variable and the corresponding BEP. Numerical results are presented in Section III to validate and analyze the accuracy of the proposed method. Section IV presents the final conclusions.
II. THEORY
In this section, the theory used to derive the MGF formulation proposed to assess the performance of the baseband DD-OFDM receiver is presented. In contrast to [10], this formulation char-acterizes rigorously the noise statistics after OFDM signal de-modulation. Firstly, the model of the optical DD-OFDM re-ceiver is characterized. Then, the theory developed to obtain the MGF of the current at the output of the DD-OFDM receiver and the semi-analytical simulation method used to calculate the BEP are described.
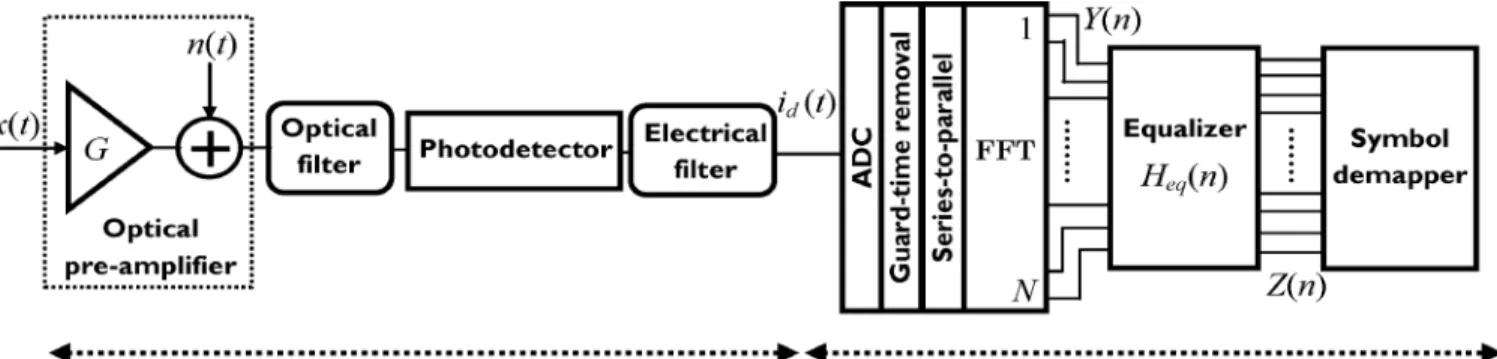
Fig. 1. Block diagram of the optical receiver followed by the baseband OFDM electrical receiver.
A. DD-OFDM Pre-Amplified Receiver Modeling
Fig. 1 depicts the block diagram of the pre-amplified DD-op-tical receiver followed by the baseband OFDM electrical re-ceiver [10]. As a baseband OFDM rere-ceiver is assumed, no radio-frequency (RF) downconversion is considered in the electrical receiver model. The formulation proposed in this work can be used in all transmitter models that allow an adequate OFDM signal demodulation using the baseband OFDM optical receiver depicted in Fig. 1, namely, the optical single sideband (SSB) transmitter described in [1], [12], which achieves an improved transmission performance in DD-baseband OFDM optical com-munication systems; or double sideband (DSB) optical trans-mitter for cheaper shorter reach implementations [5], [12]. As a consequence, it is assumed that a baseband OFDM signal is generated with Hermitian conjugate symmetry at the electrical transmitter side [1].
In the context of the semi-analytical simulation method, the signal that is transmitted along the DD-optical communication system is of finite duration. This duration is set as an integer number of OFDM symbols . We denote the complex enve-lope of the optical OFDM signal at the receiver input by . The optical pre-amplifier is assumed with a constant power gain over the amplifier bandwidth and adds amplified spontaneous emission (ASE) noise to the signal. The complex envelope of the ASE noise is defined as and is modeled as completely unpolarized additive white Gaussian noise with power spectral density . The optical filter is characterized by the impulse re-sponse and transfer function of its lowpass equiv-alent. The electrical filter has its impulse response and transfer function characterized by and , respectively. The PIN photodetector is a quadratic detector with a responsivity which we assume equal to 1 A/W, without loss of generality. The current at the input of the electrical OFDM receiver is de-noted by and is given by
(1) where stands for convolution.
The optical receiver is followed by a digital processing block which, at the analog-to-digital converter (ADC), samples
at the time instants , with
and defining the FFT size; is the first sampling instant
of the -th received OFDM symbol (of a total of symbols)
defined by is the time interval
between two successive samples taken by the ADC and is
de-fined as is the total duration of the OFDM
symbol; is the guard time duration; and is the first sam-pling time instant of the first OFDM symbol defined usually at
.
For each OFDM symbol, the samples of the current corre-sponding to the guard-time are removed, and after series-to-par-allel conversion, the remaining samples are applied to the FFT block. The output of the FFT block for the -th OFDM subcar-rier of the -th OFDM symbol is given by [1]
(2) At the equalizer output, the received symbol in the -th sub-carrier of the -th OFDM symbol, , is given by
(3) where stands for the equalizer coefficient of the -th subcarrier, which is defined by
(4) where and are the amplitude and the phase of the -th subcarrier equalizer coefficient, respectively.
B. Computation of MGF
In this subsection, the theory developed to obtain the MGF used to evaluate the performance of the optical DD-OFDM re-ceiver is described. The key idea of the derivation of the MGF is to describe the FFT operation as an equivalent continuous-time filter and incorporate this filter into the analytical treatment pro-posed in [13], [14] to evaluate the performance of an optically pre-amplified DD receiver.
The following mathematical derivation is focused on the MGF calculation of one particular OFDM symbol. So, the symbol is dropped temporarily from the notation.
The sample of the current along the overall duration of the OFDM symbol can be expressed as \
(5)
for integer and , and where is the Dirac delta
function and . By substituting (5) in (2), and by using (3) and (4), it can be shown that the received symbol in the -th subcarrier can be written as a convolution (calculated at the time instant ) as
(6) where is a continuous-time filter that describes the FFT operation for the -th subcarrier that is defined by
(7) As the decision of the received OFDM symbol is typically performed in the real and imaginary parts of , (6) can be rewritten as
(8)
where and are, respectively, the real
and imaginary parts of the FFT filter defined in (7), with
(9)
(10) The corresponding transfer functions are given, respectively, by
(11)
(12)
which can be rewritten as
(13)
(14) in order to avoid the computation of the sums in (11) and (12).
Then, in order to obtain the MGF of the real and imaginary parts of the received symbol in each OFDM subcarrier, we follow the theory presented in [13], [14]. Firstly, the current at the optical receiver output is determined considering the expansion of the complex envelopes of the signal and noise in Fourier series. Equation (A.9) of [13] or (3) of [10] show the calculated expansion for that current at a particular time instant . After some algebraic manipulation, it can be shown that the real part of the received symbol in the
-th subcarrier can be written as
(15) where are the Fourier coefficients of the received OFDM signal are the Fourier coefficients of the ASE noise
is defined as
(16) where is a dimensionless parameter; is the signal obser-vation duration, which for an OFDM signal is the symbol du-ration; and limit the number of terms of the noise and signal Fourier series development, respectively, and are defined
by and , with the noise
equivalent bandwidth of the lowpass equivalent response of the optical filter. The parameter is dimensionless and should be determined to consider all relevant harmonics of the signal. Both parameters and should be determined iteratively in order to
achieve a stabilized value of the BEP [13], [14]. The transfer
function is defined by
(17) The received symbol imaginary part in the -th subcarrier can be obtained by replacing the index in (15) and (17) by .
By following the reasoning presented in [13], [14], (15) can be written in a matricial form, and the resulting matrix cor-responding to (17) has its elements given by
(18) which is formally identical to the definition of matrix pre-sented in (A.12) of [13], except that, in our formulation, it in-cludes the influence of the continuous-time FFT filter. Notice that this matrix and the eigenvectors and eigenvalues obtained by its subsequent manipulation must be determined for every -th subcarrier. In the formulation proposed in [10], the matrix is the same for all subcarriers and only the MGFs must be com-puted for each subcarrier.
By performing the matricial manipulation and diagonaliza-tion described in [13], [14], the real part of the received symbol in the -th subcarrier can be re-written as
(19) where are independent and identically distributed Gaussian
complex random variables with variance are
the eigenvalues obtained from the matricial diagonaliza-tion and are related with the overall impulse response of the DD-OFDM optical receiver [13]; is the first term of (15); and are the vector components related to the signal similar to the ones described in [13]. Using (19) and by following the analytical development presented in [13], [14], the MGF of the real part of is derived and is given by
(20) with , when only the ASE noise in the parallel polariza-tion to the signal polarizapolariza-tion is taken into account, and , when both ASE noise polarizations are considered. Notice that (15) and (19) are written considering only the ASE noise par-allel polarization. In addition, as no particular assumption was imposed on the modulation used in each subcarrier, the derived MGF is valid for amplitude-shift keying, phase-shift keying, and quadrature amplitude (QAM) modulations with arbitrary order. The MGF corresponding to the imaginary part of the re-ceived symbol in the -th subcarrier is formally identical to the
one presented in (20), but calculated with the equivalent filter given by (14).
The MGF given by (20) and its imaginary counterpart must be computed for each OFDM symbol. In particular, for the -th symbol, this is accomplished by substituting the sampling in-stants corresponding to -th OFDM symbol on the transfer functions of the continuous-time FFT filters defined in (11) and (12), or equivalently in (13) and (14).
It should be noticed also that in a baseband OFDM signal, due to the subcarriers Hermitian conjugate symmetry, only
subcarriers are information subcarriers. This means that the MGFs of the real and imaginary parts of are only com-puted times, although the equivalent continuous-time FFT filter must be calculated considering existing subcar-riers. Similarly, if the OFDM symbol has pilot tones or other non-information subcarriers, the MGF must be computed for the information subcarriers only.
In [10], the MGF is derived considering that the samples of the current are uncorrelated from other samples taken at adjacent time instants of . This assumption is valid, if the overall impulse response of the optical receiver is shorter than the sampling time . For longer impulse responses, the sam-ples of the current , which comprise the received noise samples, exhibit correlation. As a consequence, for enhanced noise correlation, the method presented in [10] has its accu-racy severely diminished. In the formulation proposed in the present work, the MGF is calculated for the overall duration of the OFDM symbol excluding the guard time, , and hence, the correlation between the received noise samples is inherently included in the formulation. Consequently, accurate BEP esti-mates should be expected for the MGF-based method presented in this work, even when the received noise samples correlation is high. However, as the ASE noise expansion should be obtained for a much longer time, the matrices dimension required to de-termine the MGF is largely increased, and the computational time needed to determine the BEP can become prohibitive, in comparison with the computational time required by the method proposed in [10].
C. Computation of Bit Error Probability
In this subsection, the computation of the BEP from the MGFs of the real and imaginary parts of the received symbol in the -th subcarrier of the -th OFDM symbol is described. Then, the semi-analytical simulation method, which allows including signal distortion, interference and also random effects that may occur at the transmitter and channel on the MGF-based formulation, is presented.
By considering rectangular -QAM mapping at each OFDM subcarrier, the real and imaginary parts of the received symbol may be analyzed separately as two -PAM signals [15]. Hence, the symbol error probabilities corresponding to the real and imaginary components of , which are denoted
by and , respectively,
are computed in a separate way. These symbol error probabil-ities are obtained from the MGF presented in (20) and from its imaginary counterpart using the saddlepoint integration or the saddlepoint approximation (SA) [13]. Notice that, for -PAM signals, the symbol decision involves two decision
thresholds at most. For every decision threshold, an individual symbol error probability must be calculated [16]. Then, by assuming Gray coding, the BEP in the -th subcarrier of the
-th OFDM symbol is obtained from [8]
(21) The BEP of the -th OFDM symbol is obtained by averaging the BEP of each subcarrier over all information subcarriers, [8]
(22) and the overall BEP of the received OFDM signal is calculated from
(23) As seen from the derivations presented in the previous sub-sections, the effect of intersymbol interference (ISI) between OFDM symbols on the receiver performance is taken into ac-count by the MGF formulation through the numerical computa-tion of with several OFDM symbols.
In a semi-analytical simulation method of performance eval-uation, the ASE noise influence on the receiver performance is dealt with analytically and the incoming signal at the optical receiver input is assumed as a deterministic signal that is obtained by computer simulation [11], [16]. After computing through numerical simulation, by following the reasoning described in Subsections II.A–II.C [using (1)–(23)], the perfor-mance of the DD-OFDM optical receiver when impaired by ASE noise is estimated.
The only assumption considered is that must be an optical signal suitable for demodulation in the DD-OFDM receiver depicted in Fig. 1. Any deterministic effect (linear or non-linear) originated by the communication system prior to the optical receiver that changes the waveform of the signal , is taken into account in the MGF-based formulation by using a proper model of the communication system. Hence, DSB and SSB optical sig-naling, and transmission impairments, such as the degradation caused by the high peak-to-average power ratio of the OFDM signal, distortion caused by optical modulation, fiber dispersion and nonlinearities, which affect the signal waveform are well accommodated in the MGF-based method.
In order to include a rigorous statistical treatment of the dis-tortion and interference induced on the OFDM signal or any other random effect (such as laser phase noise [17]) prior to the optical DD-OFDM receiver in the semi-analytical simulation method, several different realizations of , each one com-posed of several OFDM symbols, must be computed. The BEP corresponding to each realization is calculated using the method described above and, then, an average should be performed over the number of realizations of . To ensure that the statistical treatment is accurately taken into account in the semi-analytical
method, the BEPs corresponding to uncorrelated realizations of must be computed until a stabilized value of the average BEP is attained.
III. NUMERICALRESULTS ANDDISCUSSION
In this section, the BEP of the optically pre-amplified DD-OFDM system is calculated from the MGF using the SA and its accuracy is assessed by comparison with the BEP esti-mates obtained using MC simulation. Unless otherwise stated, in the MC simulation, the symbol error probability is evaluated through direct-error counting. The counting stops when 100 symbol errors occur in the worst performing subcarrier.
In the numerical results presented in this work, the baseband electrical OFDM signal has a 4-QAM mapping with Gray coding in each subcarrier. It is assumed that the electrical OFDM signal is converted to the optical domain by a linear modulator with a modulation index . The model used for the optical OFDM signal at the input of the DD-OFDM receiver is (24)
where stands for the maximum value of is
the electrical baseband OFDM signal before optical modula-tion; and is the DC power associated with the modulator bias voltage. A modulation index of is used throughout this work, unless otherwise stated. It should be stressed that the results and main conclusions drawn from the MGF-based method do not lose generality with the assumption of a sim-plified model for the optical modulator. By using the simsim-plified model described by (24), a DSB OFDM signal is obtained at the optical modulator output. In the numerical results presented in this work to assess the accuracy of the proposed MGF and BEP formulation, the transmission of an optical DSB OFDM signal is assumed, unless otherwise stated.
Our analysis is focused on investigating if the correlation be-tween the noise samples at the FFT block input is indeed accu-rately taken into account by the MGF-based method. The addi-tion of signal distoraddi-tion to the analysis can burden the accuracy or less accuracy of description of the noise statistics after pho-todetection and OFDM signal demodulation by the formulation above presented. Additionally, the consideration of possible ISI between OFDM symbols (analyzed considering several OFDM symbols) on the analysis can have the same effect. We recall that, to take into account several OFDM symbols in the BEP as-sessment, it is necessary to evaluate the BEP averaging as given by (23), hence eventually preventing from the rigorous assess-ment of the accuracy of each one of the terms . As a con-sequence, only one OFDM symbol is used for the performance evaluation and the equalizer is trained for this OFDM symbol in order to compensate for the whole signal distortion, similarly to what was done in [10].
Throughout this section, the dB bandwidths of the optical and electrical filters of the receiver are normalized to the OFDM signal bandwidth and are referred to as normalized dB band-width; only one ASE noise polarization is considered; and the optical signal-to-noise ratio is 28 dB measured in the reference bandwidth of 0.1 nm at the output of the pre-amplifier. Unless otherwise stated, the optical filter is a 2nd order super-Gaussian
Fig. 2. Bit error probability as a function of the normalized dB bandwidth of the electrical filter for different number of OFDM subcarriers: (tri-angles), (squares), and (circles). The MGF parameters con-sidered are and . Lines: MC simulation; filled symbols: MGF proposed in this work; empty symbols: MGF proposed in [10].
optical filter with a dB bandwidth of forty times the signal bandwidth.
A. Dependence of the Accuracy of the BEP Estimated Using the MGF on the Number of OFDM Subcarriers and on the
dB Bandwidth of the Electrical Filter
In this subsection, the accuracy of the BEP estimates obtained using the MGF is investigated by comparison with the BEP ob-tained using MC simulation for a different number of OFDM subcarriers. A 6th order Butterworth electrical filter is assumed at the DD-OFDM receiver.
Fig. 2 shows the BEP as a function of the normalized dB bandwidth of the electrical filter, for the number of subcarriers
of (triangles), (squares), and (circles).
The BEPs are obtained using: MC simulation (lines); the MGF proposed in this work (filled symbols) with and
; and the MGF proposed in [10] (empty symbols).
Fig. 2 shows that the BEP estimates obtained from the MGF are very accurate, since they deviate only slightly from the ones obtained using MC simulation. Only some marginal differences can be observed for very narrow dB bandwidths of the elec-trical filter (50% and 60% the OFDM signal bandwidth) and es-pecially for . Besides these small differences, the MGF-based method predicts very accurately the BEP for the optimum dB bandwidth of the electrical filter, when it is slightly lower than the OFDM signal bandwidth, as in the case considered in Fig. 2. Furthermore, Fig. 2 indicates that, to achieve the best receiver performance, the OFDM signal should be slightly dis-torted by the receiver electrical filter, a degrading effect that is compensated by the reduction of the power of the ASE noise that arrives at the symbol decision input.
The good accuracy of the MGF-based method proposed in this work has been also confirmed for .
Fig. 2 shows also that the method proposed in [10] loses its accuracy whenever the correlation between the noise samples prior to the FFT block input becomes relevant. For dB widths of the electrical filter lower than the OFDM signal band-width, where the noise correlation is remarkably enhanced, the
method presented in [10] predicts incorrect BEP estimates with a difference that can be two orders of magnitude above the cor-rect BEP value, see the case of the electrical filter dB band-width of 70% the OFDM signal bandband-width and . Thus, the new MGF-based method proposed in this work significantly increases the accuracy of the BEP estimates where the method presented in [10] fails. Consequently, as the optimum dB bandwidth of the electrical filter occurs for bandwidths similar to the OFDM signal bandwidth, it is well predicted using the MGF-based method proposed in this work.
Fig. 2 also shows that, among the number of subcarriers an-alyzed, the best performance for the baseband OFDM optical receiver is achieved for an intermediate number of subcarriers
.
The results shown in Fig. 2 validate the MGF-based method for a different number of subcarriers and for a particular elec-trical filter type with different dB bandwidths.
B. Dependence of the Accuracy of the BEP Estimated Using the MGF on the Subcarrier Index
In [10], it was shown that, when the MGF fails to predict the BEP per subcarrier, the overall BEP of the OFDM symbol may be estimated with a significant error. This behavior was found for the situations where the noise correlation impact on the performance is enhanced, i.e., for electrical filter bandwidths lower than the OFDM signal bandwidth [10]. Although the new MGF-based method proposed in this work seems to predict ac-curate BEP estimates of the OFDM symbol, the accuracy of the BEP per subcarrier should be investigated. So, in this subsec-tion, the accuracy of the BEP per subcarrier estimated using the MGF is assessed by comparison with the estimates of MC sim-ulation. In order to increase the accuracy of the BEP estimates of each individual subcarrier obtained by MC simulation, the direct-error counting is performed until 50 erroneous symbols occur in half of the useful subcarriers.
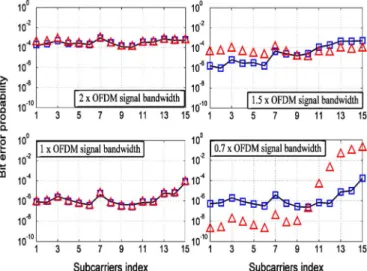
Fig. 3 depicts the BEP as a function of the subcarrier index, for the 6th Butterworth electrical filter with several different
dB bandwidths and for a number of subcarriers of . The BEPs are obtained using MC simulation (lines); from the MGF proposed in this work (squares) with and ; and from the MGF proposed in [10] (triangles). Higher subcarriers indexes correspond to higher frequency subcarriers; lower subcarriers indexes correspond to frequencies nearer zero. In order to achieve the lower BEPs shown in Fig. 3 using MC simulation, the number of simulated sample functions of ASE
noise was .
Fig. 3 shows a very good agreement between the BEP es-timates obtained by MC simulation and from the MGF pro-posed in this work and indicates that the new formulation is accurate when predicting the BEP of an individual subcarrier. As Fig. 3 shows, the narrowing of the electrical filter band-width reduces mainly the performance of the OFDM subcarriers with higher frequencies, while the performance of the lower frequency subcarriers remains practically unaffected. This be-havior is correctly described by the MGF-based method pro-posed in this work, on the contrary to the results obtained using the method proposed in [10]. In the case of very narrow elec-trical filter bandwidths (70% the OFDM signal bandwidth), the
Fig. 3. Bit error probability as a function of the subcarriers index for a 6th order Butterworth electrical filter with normalized dB bandwidth of 0.7, 1, 1.5 and 2; and for a subcarriers number of . Lines: MC simulation; squares: MGF with and ; triangles: MGF proposed in [10].
BEPs per subcarrier estimated using the MGF proposed in [10] are significantly different from the correct ones, with a discrep-ancy that can exceed two orders of magnitude for the subcar-riers with lower and higher frequencies. Even for electrical filter bandwidths larger 1.5 times the OFDM signal bandwidth, the BEP estimated for each individual subcarrier using the MGF proposed in [10] can give errors with a difference of about one order of magnitude from the correct value.
By analysis of the BEP of each subcarrier (usually of the worst and best performance subcarriers), some physical insight about the impairment that is causing the main performance degradation can be inferred. With the MGF proposed in [10], the conclusions drawn from such an analysis would be incorrect for electrical filter bandwidths where the noise samples corre-lation is significant, since the BEP per subcarrier is estimated with very low accuracy.
The good accuracy of the BEP per subcarrier estimated from the MGF proposed in this work was confirmed also for
and and for other electrical filters such as the 5th order Bessel and 4th order Butterworth filters. Those confirmations were performed for BEPs per subcarrier higher than , in order to avoid simulating a large amount of ASE noise sample functions, such as the one used to obtain the results presented in Fig. 3.
C. Dependence of the Accuracy of the BEP Estimated Using the MGF on the Parameters and
The BEP estimation from the MGF can have significant er-rors, if the values of the parameters and are not well chosen [10], [13]. The parameter is related with the time window that the ASE noise should be observed at the optical filter output in order to describe the effect of noise on the receiver performance correctly. The parameter controls the size of the frequency window where the OFDM signal should be taken into account by the MGF method in order to consider all relevant harmonics of the OFDM signal at the optical filter output. The values of both parameters must be determined iteratively and varied until
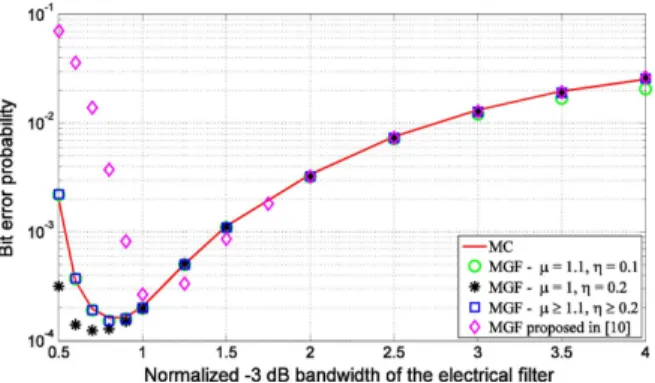
Fig. 4. Bit error probability as a function of the normalized dB bandwidth of the electrical filter for different values of with . A 6th order Butterworth electrical filter and subcarriers are considered.
Fig. 5. Bit error probability as a function of the normalized dB band-width of the electrical filter for several values of with . A 6th order Butterworth electrical filter and subcarriers are considered.
a stabilized value of the BEP is obtained. This procedure should be performed one time for every different combination of optical and electrical filters. In this subsection, the dependence of the BEP estimates accuracy on the parameters and is studied.
Fig. 4 shows the BEP as a function of the normalized dB bandwidth of the electrical filter for different values of with
. A 6th order Butterworth electrical filter and
subcarriers are considered. For , the BEP curves ob-tained using the MGF become all superimposed in Fig. 4. This means that the accuracy of the analytical formulation cannot be further increased for higher values of and that all relevant OFDM signal harmonics to the performance are considered in the determination of the MGF. Furthermore, the BEPs estimated analytically are in a very good agreement with the BEPs ob-tained by MC simulation. For , the accuracy of the BEP estimate reduces with the decreasing of the value of for larger electrical filter bandwidths, and very high BEP estimation er-rors occur for extremely low .
Fig. 5 shows the BEP as a function of the normalized dB bandwidth of the electrical filter for different values of with
. A 6th order Butterworth electrical filter and
subcarriers are considered. In Fig. 5, for , the BEP curves estimated using the MGF are overlapped, which means that a stabilized value of the BEP has been attained. Further-more, they are in a very good agreement with the BEP curve obtained by MC simulation. Thus, when using the MGF-based
Fig. 6. Bit error probability as a function of the normalized dB bandwidth of the 4th order Butterworth electrical filter, for subcarriers and several values of the parameters and .
formulation, the time window to describe correctly the influ-ence of the ASE noise on the DD-OFDM receiver performance must be a little longer than the OFDM symbol duration, in order to estimate the BEP accurately. For electrical filter bandwidths narrower than the OFDM signal bandwidth, smaller values of lead to incorrect BEP estimates which oscillate around the cor-rect estimate of the BEP.
Similar values of and , for which the BEPs estimates are stabilized, were obtained for a subcarriers number of . For each combination of electrical and optical filters of the DD-OFDM receiver, the parameters and must be determined carefully. Besides the errors in the BEP estimates obtained from the MGF observed in Figs. 4 and 5, values of much higher than the value of that accomplishes the BEP stabilization can lead to very demanding computational times. This is mainly due to the large size of the matrix defined in (18), and its respective diagonalization that has to be computed in order to obtain the MGF.
D. Dependence of the Accuracy of the BEP Estimated Using the MGF on the Electrical Filter Type
All previous BEP estimates have been obtained considering a 6th order Butterworth electrical filter. In this subsection, the study of the accuracy of the BEP estimates obtained using the MGF is extended to other electrical filter types.
Figs. 6 and 7 depict the BEP as a function of the normalized dB bandwidth of the electrical filter, for a 4th order But-terworth filter and for a 5th order Bessel filter, respectively. A number of OFDM subcarriers of and several values of the parameters and are considered. The BEPs estimated using the MGF proposed in [10] are also shown.
Figs. 6 and 7 show that the BEPs estimated using the MGF are very accurate for both types of electrical filters and allows us to believe that the MGF-based method can be used to ob-tain the performance of a DD-OFDM receiver with an arbitrary electrical filter with a very good accuracy. Also, the MGF-based method shows its good accuracy when estimating the BEP for the optimum dB bandwidth of the electrical filter, even when it is nearly half the OFDM signal bandwidth, as it is observed for the 5th order Bessel filter in Fig. 7.
Figs. 6 and 7 show that the BEPs obtained with the MGF proposed in [10] exhibit a relatively high inaccuracy, when the normalized dB bandwidth of the electrical filter is narrower
Fig. 7. Bit error probability as a function of the normalized dB bandwidth of the 5th order Bessel electrical filter, for subcarriers and several values of the parameters and .
than the OFDM signal bandwidth, for the 4th order Butterworth and 5th order Bessel electrical filters.
The values of the parameters and that lead to stabilized BEPs are nearly identical to the ones obtained for the 6th order Butterworth electrical filter shown in Figs. 4 and 5.
A similar accuracy was found for subcarriers for both electrical filter types.
E. Dependence of the Accuracy of the BEP Estimated Using the MGF on the Optical Filter Type and dB Bandwidth
Previous subsections have shown that the MGF-based method is very accurate when estimating the performance of the DD-OFDM optical receiver, considering different types of electrical filter and different number of subcarriers; however, all results presented have been obtained for a specific optical filter. In this subsection, the accuracy of the BEP estimated using the MGF is assessed considering different types of optical filter with different dB bandwidths.
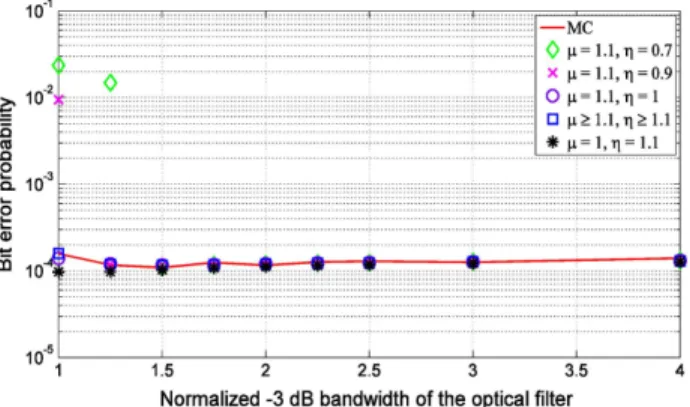
Figs. 8 and 9 depict the BEP as a function of the dB width of the optical filter normalized to the OFDM signal band-width, for a 2nd order super-Gaussian optical filter and for a Gaussian optical filter, respectively. The results of Figs. 8 and 9 have been obtained for a 6th order Butterworth electrical filter with a dB bandwidth equal to the OFDM signal bandwidth, a number of OFDM subcarriers of and several values of the parameters and .
Figs. 8 and 9 show that the BEPs estimated from the MGF are in very good agreement with the BEPs obtained from MC simulation, for both optical filters. Figs. 8 and 9 validate the use of the MGF for different optical filters and allow us to infer that the MGF provides very accurate estimates of the BEP for other optical filter types. The BEP is estimated rigorously for the optimum dB bandwidth of the optical filter, even when the bandwidth is similar to the OFDM signal bandwidth, as shown in Fig. 9 for the Gaussian optical filter.
Values of and lower than the ones that provide stabi-lized estimates of the BEP lead to a BEP estimation error for lower optical filter bandwidths. A higher value of is needed to assess accurately the DD-OFDM receiver performance, since the bandwidth of the optical filters considered in Figs. 8 and 9 is lower than the one considered in previous figures and, con-sequently, the sum corresponding to the signal Fourier series
Fig. 8. Bit error probability as a function of the normalized dB bandwidth of the 2nd order Super-Gaussian optical filter. A 6th order Butterworth electrical filter with a dB bandwidth equal to the OFDM signal bandwidth, subcarriers and several combinations of and are considered.
Fig. 9. Bit error probability as a function of the normalized dB bandwidth of the Gaussian optical filter. A 6th order Butterworth electrical filter with a dB bandwidth equal to the OFDM signal bandwidth, subcarriers and several combinations of and are considered.
development given in (15) must consider more terms. All fig-ures presented in this work indicate that the value
is sufficient to obtain accurate estimates of the BEP from the MGF for the DD-OFDM receiver with several different receiver configurations.
A similar accuracy was found for subcarriers for both optical filter types.
F. Dependence of the Accuracy of the BEP Estimated Using the MGF on Optical SSB OFDM Signals
In all previous numerical results, the OFDM signal at the op-tical receiver input was considered to be a DSB signal. In this subsection, the accuracy of the BEP obtained from the MGF is studied for an optical SSB OFDM signal. The SSB signal is obtained considering a SSB optical filter after the optical mod-ulator [4]. An ideal SSB optical filter that removes the lower sideband of the OFDM signal is assumed.
Fig. 10 shows the BEP obtained using MC simulation and
from the MGF with and as a function of the
modulation index , considering a SSB OFDM signal at the op-tical receiver input, for and subcarriers. A 6th order Butterworth electrical filter with dB bandwidths 1.5
Fig. 10. Bit error probability as a function of the modulation index , for a 6th order Butterworth electrical filter with dB bandwidths 1.5 (diamonds) and 2 (squares) times the OFDM signal bandwidth and for and subcarriers. Symbols: MC simulation; lines: MGF with and .
(diamonds) and 2 (squares) times the OFDM signal bandwidth is considered.
For both electrical filter bandwidths, Fig. 10 shows that the BEP estimates obtained from the MGF agree very well with the estimates from MC simulation, also for the case of SSB optical signaling, as expected from the assumptions made in the deriva-tion of the MGF-based method. With the increase of the mod-ulation index, the BEPs obtained from the MGF remain also very accurate. The performance degradation that occurs with SSB optical signaling (in comparison with DSB signaling, for the same modulation index) is attributed to the increase of the carrier-to-signal power ratio.
Some final remarks regarding the computational time re-quired by the methods used in this work to estimate the receiver performance are now presented. It is well known that the MC simulation demands a very high computational time for
lower BEPs. For example, for and a normalized
electrical filter bandwidth equal to the signal bandwidth, as the
BEP is about , the MC computational time is 250
times longer than the one required by the MGF-based method proposed in this work. By comparing the computational times of the MGF-based methods, in a general way, the computa-tional time of the MGF-based method proposed in this work is approximately forty times longer than the time required by the MGF-based method proposed in [10]. Although the MGF formulation proposed in the present work has some additional mathematical complexity and enhanced computational time, it provides a worthy improvement in the accuracy of the perfor-mance estimates of the OFDM optical receiver whenever the MGF method proposed in [10] fails.
IV. CONCLUSION
In this work, a rigorous method to assess the performance of baseband OFDM optically pre-amplified receivers with direct-detection has been proposed. The proposed method is based on the computation of the MGF of each OFDM subcarrier, relies on describing the FFT as a continuous-time filter, and can deal with arbitrary optical and electrical filters.
By comparison with MC simulation, it has been shown that the proposed method provides very accurate estimates of the
BEP of the DD-OFDM optical receiver for several situations: different optical and electrical filters with different dB band-widths, different numbers of OFDM subcarriers and DSB and SSB optical signalling. The dependence of the accuracy of the BEP estimated from the MGF on the parameters and has been also analyzed. It has been shown that a value of
provides very accurate estimates of the BEP for all the results presented in this work. The parameter should be carefully se-lected, since it is very dependent on the optical filter type and its
dB bandwidth. It has been shown that the value of
is a good conservative choice for this parameter, since it pro-vides very accurate BEP estimates for all optical filters and dB bandwidths studied in this work.
The proposed method has also shown a very good accuracy when assessing the performance of each individual subcarrier of the OFDM symbol providing an excellent way for identifying the main impairments of the DD-OFDM optical communication system.
In comparison with the method proposed in [10], which fails to predict the performance of the DD-OFDM receiver when the noise samples correlation at the FFT block input is high, the method proposed in this work is remarkably accurate and char-acterizes rigorously the influence of the noise statistics after OFDM signal demodulation on the receiver performance, even in presence of high correlation between the noise samples. Con-sequently, it allows calculating the BEPs for the optimum dB bandwidths of the optical and electrical filters and the BEPs of each individual subcarrier very precisely, when compared to the results obtained in [10].
The generalization of the MGF-based method to DD-OFDM receivers with RF conversion is left for future work. A possible way to obtain that MGF is to follow a procedure similar to the key idea used in this work.
REFERENCES
[1] W. Shieh and I. Djordjevic, Orthogonal Frequency Division
Multi-plexing for Optical Communications. San Diego, CA: Academic,
2010, ch. 1, 2 and 7.
[2] S. Jansen, “Multi-carrier approaches for next-generation transmission: Why, where and how?,” in Proc. 13th OFC/NFOEC’ 2012, 2012, Paper OTh1B.1.
[3] B. Lin, J. Li, H. Yang, Y. Wan, Y. He, and Z. Chen, “Comparison of DSB and SSB transmission for OFDM-PON,” in Proc. 13th OFC/
NFOEC’ 2012, 2012, Paper NTu1J.7.
[4] N. Cvijetic, “OFDM for next-generation optical access networks,” J.
Lightw. Technol., vol. 30, no. 4, pp. 384–398, Feb. 2012.
[5] F. Carvalho and A. Cartaxo, “Power requirements for coexisting base-band and wireless OFDM-based signals in hybrid metro-access net-works,” in Proc. 13th ICTON’ 2011, 2011, Paper Tu.A5.6.
[6] W. Peng, I. Morita, H. Takahashi, and T. Tsuritani, “Transmission of high-speed ( Gb/s) direct-detection optical OFDM super-channel,” J. Lightw. Technol., vol. 20, no. 12, pp. 2025–2034, June 2012.
[7] W. Peng, K. Feng, A. Willner, and S. Chi, “Estimation of the bit error rate for direct-detected OFDM signals with optically preamplified re-ceivers,” J. Lightw. Technol., vol. 27, no. 10, pp. 1340–1346, May 2009.
[8] T. Alves and A. Cartaxo, “Semi-analytical approach for performance evaluation of direct-detection OFDM optical communication systems,”
Opt. Exp., vol. 17, no. 21, pp. 18714–18729, Oct. 2009.
[9] T. Alves and A. Cartaxo, “Analysis of methods of performance evaluation of direct-detection orthogonal frequency division multi-plexing communication systems,” Fiber Integr. Opt., vol. 29, no. 3, pp. 170–186, Mar. 2010.
[10] J. Rebola and A. Cartaxo, “Bit error probability evaluation in optically preamplified direct-detection OFDM systems using the moment gen-erating function,” J. Opt. Commun. Netw., vol. 4, no. 3, pp. 229–237, Mar. 2012.
[11] M. Jeruchim, P. Balaban, and K. Shanmugan, Simulation of
Commu-nication Systems—Modeling, Methodology and Techniques, 2nd ed.
New York: Kluwer, 2000, ch. 11.
[12] D. Hewitt, “Orthogonal frequency division multiplexing using base-band optical single sidebase-band for simpler adaptive dispersion compen-sation,” in Proc. 8th OFC/NFOEC’ 2007, 2007, Paper OME-7. [13] E. Forestieri, “Evaluating the error probability in lightwave systems
with chromatic dispersion, arbitrary pulse shape and pre- and postde-tection filtering,” J. Lightw. Technol., vol. 18, no. 11, pp. 1493–1503, Nov. 2000.
[14] E. Forestieri and M. Secondini, “On the error probability evaluation in lightwave systems with optical amplification,” J. Lightw. Technol., vol. 27, no. 6, pp. 706–717, Mar. 2009.
[15] A. Carlson and P. Crilly, Communication Systems—An Introduction to
Signals and Noise in Electrical Communication, 5th ed. Boston, MA:
McGraw-Hill, 2010, ch. 14.
[16] M. Nölle, M. Seimetz, and E. Patzak, “System performance of high-order optical DPSK and star QAM modulation for direct detection an-alyzed by semi-analytical BER estimation,” J. Lightw. Technol., vol. 27, no. 19, pp. 4319–4329, Oct. 2009.
[17] W. Peng, J. Chen, and S. Chi, “On the phase noise impact in direct-detection optical OFDM transmission,” IEEE Photon. Technol. Lett., vol. 22, no. 9, pp. 649–651, May 2010.
Author biographies not included by author request due to space constraints.