ISSN 1 5 1 7 - 7 0 7 6
Revista Matéria, v. 15, n. 2, pp. 260–266, 2010. http://www.materia.coppe.ufrj.br/sarra/artigos/artigo11227
Stress-strain curves for steel fiber-reinforced concrete in compression
Luiz Álvaro de Oliveira JúniorI; Vanessa Elizabeth dos Santos BorgesII; Alice Ribeiro DaninII; Daiane Vitória Ramos MachadoIII; Daniel de Lima AraújoII; Mounir Khalil El DebsI; Paulo Fernando RodriguesIV
I
School of Engineering of São Carlos, University of São Paulo e-mail: [email protected] ; [email protected]
II
School of Civil Engineering, Federal University of Goiás
e-mail: [email protected] ; [email protected] ; [email protected]
III
Fundação de Amparo à Pesquisa, Federal University of Goiás e-mail: [email protected]
IV
Furnas Centrais Elétricas S. A. e-mail: [email protected]
ABSTRACT
This paper presents a study on the compressive behavior of steel fiber-reinforced concrete. In this study, an analytical model for stress-strain curve for steel fiber-reinforced concrete is derived for concretes with strengths of 40 MPa and 60 MPa at the age of 28 days. Those concretes were reinforced with steel fibers with hooked ends 35 mm long and with aspect ratio of 65. The analytical model was compared with some experimental stress-strain curves and with some models reported in technical literature. Also, the accuracy of the proposed stress-strain curve was evaluated by comparison of the area under stress-strain curve. The results showed good agreement between analytical and experimental data and the benefits of the using of fibers in the compressive behavior of concrete.
Keywords: Steel fiber-reinforced concrete, stress-strain curves, compressive behavior.
1 INTRODUCTION
The plain concrete capacity to absorb energy as it deforms, may not be sufficient when the structure constituted by this material must support large displacements. In this sense, the addition of steel fibers to the matrix increases, beyond the capacity of energy dissipation, the tensile, fatigue and impact strengths, the toughness and the fracture energy of the material. These improvements make the steel-fiber reinforced concrete a composite material very interesting for structural applications.
When designing or analyzing a structure, the structure strength can be determined if the materials strengths are known. Thus, the structure is safe for certain efforts since these efforts do not produce stresses exceeding the material strength. However, the fact that structure is safe for design efforts does not prevent a possible brittle failure. So, to be considered safe, the structure must also provide ductility, which can be achieved using tougher materials such as steel fiber-reinforced concrete to build structural elements.
To verify if the material presents toughness compatible with the level of ductility that must be provided to the structure, the stress-strain curves can be used. So, toughness is related to the area under this curve and, the greater the area, the greater the material toughness.
With the increasing development of engineering and the increasing on complexity of geometry and loads used in the projects, design and analysis of concrete structures have also become more complex. Thus, the use of numerical methods, such as finite element method, has become common practice in analysis of these structures. From this point of view, the stress-strain curves, representing constitutive models for material, become even more important since the accuracy of analysis depends on the ability of constitutive models to represent properly the material behavior.
stress-strain curve. The models of Ezeldin and Balaguru [3], Mansur et al. [4], Nataraja et al. [5], Barros and Figueiras [6] and Araújo [7] can be cited as examples.
The model proposed by Ezeldin and Balaguru [3] is valid for concretes with compressive strength varying from 35 MPa to 85 MPa. Steel fibers with hooked ends and with aspect ratio of 60, 75 and 100 were added in volumetric fractions of up to 0.75%. The model proposed by Mansur et al. [4] was developed for concrete with compressive strength varying from 70 MPa to 120 MPa to which were added up to 1.5% of steel fibers with hooked ands and aspect ratio of 60. Nataraja et al. [5] proposed a model valid for concretes with compressive strength varying from 30 MPa to 50 MPa using up to 1.0% of crimped steel fibers with aspect ratio of 55 and 82. Beyond these studies, Barros and Figueiras [6] presented a model developed for concretes with compressive strength varying from 30 MPa to 60 MPa, to which were added up to 0.75% of steel fiber with hooked ends and aspect ratios of 60 and 75. Finally, the model presented by Araújo [7] is valid for concretes with compressive strength varying from 50 MPa and 100 MPa, to which were added up to 2.0% of steel fiber with hooked ends, 30 mm long and with aspect ratio of 48.
All these models, except the one proposed by Barros and Figueiras [6], are based on the model proposed by Carreira and Chu [2] (or on models derived from this), whose general expression is given by Equation 1, in which σc the compressive stress, fc is the compressive strength,
ε
c c is strain,ε
c0 is the peak strain andβ
is the factor which considers the influence of fibers on the curve form. The parametersβ
andε
c,0 can be obtained, in general, by equations that correlates these parameters to fiber volumetric fraction and/or to compressive strength of concrete and, obviously, are different from one model to another.β εε β εε β σ ⎟⎟⎠ ⎞ ⎜⎜⎝ ⎛ + − ⎟⎟⎠ ⎞ ⎜⎜⎝ ⎛ = 0 , 0 , 1 c c c c c c f (1)
In this paper, results of many compression tests with displacement control performed by the authors were used. Concretes presented average compressive strength of 40 MPa and 60 MPa and were produced with steel fibers 35 mm long. These fibers had aspect ratio of 64 and were added in fiber volumetric fractions of 1.0% and 2.0%. The influence of fibers was evaluated on the peak stress and strain and on toughness in compression. An analytical model to get the complete stress-strain curve was developed based on the model of Carreira and Chu [2].
2 MATERIAL E METHODS
2.1 Composition of Concretes
Concretes with 40 MPa were produced with Portland cement type CP II F 32 (cement with limestone filler), sand, coarse aggregate with maximum size of 12.5 mm, water and superplasticizer admixture. To improve the workability of fresh concrete and reduce the consumption of cement, 5% of silica fume were added in partial replacement of cement and 20% of fly-ash as mineral addition. To these concretes steel fibers 35 mm long were added in fiber volumetric fractions of 1.0% and 2.0%, having been the fiber aspect ratio of 64. Concretes with 60 MPa were produced with the same materials, except fly-ash.
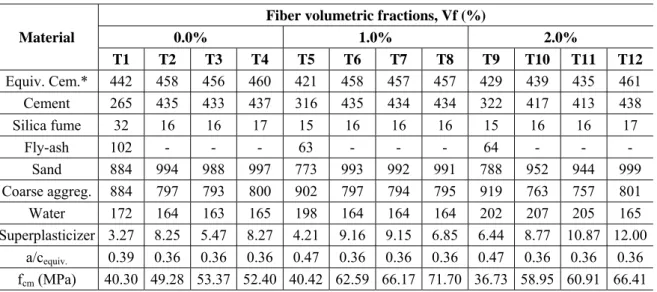
Table 1 presents compositions of the produced concretes. It was observed that amount of superplasticizer used in each mixture increased as fiber volumetric fractions increased, since the difficulty in adding high amounts of fibers to concrete increases as the amount of fibers increases. Also, the superplasticizer dosage and the water-cement ratio were calculated in relation to equivalent cement, that is, in relation to a mixture of cementitious materials (cement, silica fume and fly-ash) with the same density of cement.
Table 1: Composition of studied mixtures (kg/m3).
Material
Fiber volumetric fractions, Vf (%)
0.0% 1.0% 2.0%
T1 T2 T3 T4 T5 T6 T7 T8 T9 T10 T11 T12
Equiv. Cem.* 442 458 456 460 421 458 457 457 429 439 435 461
Cement 265 435 433 437 316 435 434 434 322 417 413 438
Silica fume 32 16 16 17 15 16 16 16 15 16 16 17
Fly-ash 102 - - - 63 - - - 64 - - -
Sand 884 994 988 997 773 993 992 991 788 952 944 999
Coarse aggreg. 884 797 793 800 902 797 794 795 919 763 757 801
Water 172 164 163 165 198 164 164 164 202 207 205 165
Superplasticizer 3.27 8.25 5.47 8.27 4.21 9.16 9.15 6.85 6.44 8.77 10.87 12.00
a/cequiv. 0.39 0.36 0.36 0.36 0.47 0.36 0.36 0.36 0.47 0.36 0.36 0.36
fcm(MPa) 40.30 49.28 53.37 52.40 40.42 62.59 66.17 71.70 36.73 58.95 60.91 66.41
*Equivalent cement is a mixture of cementitious materials with the same density of cement.
2.2 Methodology
The produced specimens were subjected to compression tests with displacement control for obtaining stress-strain curves in compression. In this test, displacements were limited to measurement capacity of the transducers that was 10 mm. However, this limitation applies only to the maximum displacement, although it is possible that some specimens present smaller displacements at the end of the test.
Once stress-strain curves are determined, the average curves were obtained for each produced mixture. Following, these curves were normalized dividing the stresses axis by the peak stress. This procedure removes the influence of compressive strength and allows direct comparison of curves. The strain axis was also normalized, but by peak strain, once the model proposed by Carreira and Chu [2] uses normalized strains.
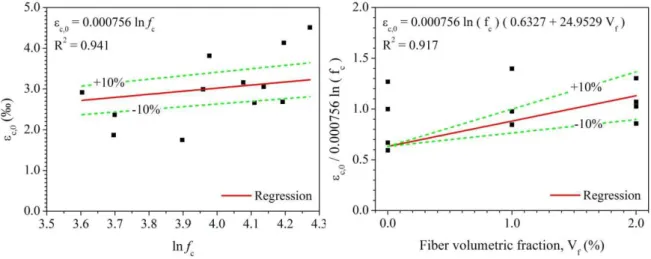
In this work, the equation proposed by Carreira and Chu [2] was chosen to perform nonlinear regressions of curves and to obtain the value of β, since the form of this curve is similar to experimental curves. Also, an equation for estimating peak strain by means of nonlinear regressions of this property with compressive strength and fiber volumetric fraction was proposed.
The model was validated by means of assessing of ratio between experimental and analytical values of relative toughness. Obviously, ratios around 1.0 are ideal, but a difference of ±10% between experimental and analytical results was considered satisfactory.
3 RESULTS AND DISCUSSION
The model proposed by Carreira and Chu [2] was used in non-linear regressions to determine the
β
values, which were correlated with the fiber volumetric fraction and with the compressive strength of concrete, as shown in Equation 2. The correlation is shown in Figure 1. It can be observed from this figure a trend to increasing ofβ
values as the compressive strength of concrete increases. However, the opposed trend is verified with the addition of fibers to concrete, being the lowestβ
values obtained for higher amounts of fibers.(
0.0536−0.5754Vf)
fc=
β
(2)(
f)
c c,0= 0.00048+0.01886V ln fε
(3)Figure 1: Regression of β.
Figure 2: Regressions to define equation to estimate the peak strain.
Once the
β
value is known, the equation that describes the proposed model gets defined by replacement of this parameter in Equation 1. So, the fiber volumetric fraction, the peak strain and the concrete compressive strength must be provided to define the complete stress-strain curve of steel fiber-reinforced concrete in compression. Replacing Equation 2 in Equation 1 and giving suitable values to parameters of the model, analytical curves can be obtained and after compared to experimental curves shown in Figure 3.It can be observed from this figure, in general, that results obtained by proposed model are well fitted to experimental results. Also, in the most cases, the material behavior in elastic range was accurately represented, except for the mixture T8. This was expected, since the action of fibers in elastic range can be neglected and the equation used in the non-linear regressions was originally developed for plain concrete. Also, the shape of analytical curve was reasonably similar to experimental curve shape, except in some cases, which presented significantly differences.
Figure 3: Comparison between experimental and analytical results.
Figure 4: Analytical curves for concretes of 40 MPa and 60 MPa.
was applied, which relates the energy dissipated by the material and the energy dissipated by a perfectly plastic material up to maximum strain of 15‰. Similar comparison was done for peak strain. Table 2 shows the results obtained from these comparisons.
From this table, variations of -21% (for mixture T10) and +52% (for mixture T4) in the ratio between relative toughness values obtained from experimental results and from proposed models were observed. The peak strain also presented high variations: -24% (for mixture T11) to +100% (for mixture T3). These differences between experimental and analytical values are due to the experimental curve shape on descending branch, whose behavior is affected by the high scattering intrinsic to the adding of fibers to concrete, since ascending branch was represented satisfactorily in the most cases. Values of relative toughness and peak strain with reasonable accuracy and confidence level of 90% were observed in 50% of the cases. Although the differences observed between experimental and analytical results, the model can be considered as valid.
Table 2: Validation of proposed model.
Traço fc (MPa) Aexp Atheo RTexp RTtheo RTexp / RTtheo εc,0,exp εc,0,theo εc,0,exp / εc,0,theo
T1 40.30 0.253 0.278 0.419 0.460 0.91 0.00187 0.00177 1.05 T2 49.28 0.302 0.278 0.409 0.376 1.09 0.00175 0.00187 0.94 T3 53.37 0.418 0.275 0.522 0.344 1.52 0.00382 0.00191 2.00 T4 52.40 0.374 0.271 0.476 0.345 1.38 0.00299 0.00190 1.57 T5 40.42 0.367 0.381 0.606 0.629 0.96 0.00237 0.00247 0.96 T6 62.59 0.325 0.412 0.346 0.439 0.79 0.00306 0.00277 1.10 T7 66.17 0.420 0.416 0.423 0.419 1.01 0.00268 0.00280 0.96 T8 71.70 0.492 0.423 0.457 0.393 1.16 0.00451 0.00286 1.58 T9 36.73 0.447 0.445 0.812 0.808 1.01 0.00292 0.00309 0.94 T10 58.95 0.431 0.543 0.488 0.614 0.79 0.00316 0.00349 0.90 T11 60.91 0.489 0.550 0.535 0.602 0.89 0.00266 0.00352 0.76 T12 66.41 0.694 0.568 0.697 0.570 1.22 0.00414 0.00360 1.15
A: area under stress-strain curve; RT: relative toughness; exp: experimental; theo: theoretical
4 CONCLUSIONS
Based on the results obtained and on the analysis presented, the following may be concluded:
• The model proposed allows to estimate the complete stress-strain curve for plain concrete and concretes reinforced with up to 2% of steel fibers with hooked ends, since these concretes have compressive strength between 40 MPa and 60 MPa;
• The differences between experimental and analytical results were acceptable and are due to the shape of the descending branch of the experimental curve, in which irregularities that does not occur in other models available in the technical literature are usually found;
• The model proposed depends only on the fiber volumetric fraction and on the concrete compressive strength, which makes it easier to be used in comparison with other models that depend on additional parameters.
5 ACKNOWLEDGMENTS
The authors are grateful to MC Bauchemie for the donation of superplasticizer admixture, without which, tests would not have been done.
6 REFERENCES
[2] CARREIRA, D.J., CHU, K.H., “Stress-strain relationship for plain concrete in compression”, ACI Journal, v. 82, n. 6, p. 797-804, 1985.
[3] EZELDIN, A.S., BALAGURU, P.N., “Normal and high-strength fiber-reinforced concrete under compression”, Journal of Materials in Civil Engineering, v. 4, n. 4, pp. 415-429, Nov. 1992.
[4] MANSUR, M.A.; CHIN, M.S., WEE, T.H., “Stress-strain relationship of high-strength fiber concrete in compression”, Journal of Materials in Civil Engineering, v. 11, n. 1, pp. 21-29, Feb. 1999.
[5] NATARAJA, M.C., DHANG, N., GUPTA, A.P., “Stress-strain curves for steel-fiber reinforced concrete under compression”, Cement & Concrete Composites, v. 21, pp. 383-390, 1999.
[6] BARROS, J.A., FIGUEIRAS, J.A., “Flexural behavior of SFRC: testing and modeling”, Journal of Materials in Civil Engineering, v. 11, n. 4, pp. 331-339, Nov. 1999.