Combined effects of electron-beam irradiation and storage time on the
chemical and antioxidant parameters of wild
Macrolepiota procera
dried samples
Ângela Fernandesa,b, João C.M. Barreiraa,b, Amilcar L. Antonioa,c,d, M. Beatriz P.P.
Oliveirab, Anabela Martinsa, Isabel C.F.R. Ferreiraa,*
a
CIMO-ESA, Instituto Politécnico de Bragança Campus de Santa Apolónia, Apartado
1172, 5301-855 Bragança, Portugal.
b
REQUIMTE/ Depto. de Ciências Químicas, Faculdade de Farmácia, Universidade do
Porto, Rua Jorge Viterbo Ferreira n.º 228, 4050-313 Porto, Portugal.
c
IST/ITN, Instituto Tecnológico e Nuclear, Estrada Nacional 10, 2686-953 Sacavém,
Portugal.
d
Departamento de Física Fundamental, Universidade de Salamanca, Plaza de la Merced,
37008 Salamanca, Spain.
*Author to whom correspondence should be addressed (I.C.F.R. Ferreira: [email protected],
Abstract
Mushrooms are very perishable foods due to their high susceptibility to moisture loss, changes in color and texture, or microbiological spoilage. Drying is considered as the most appropriate method to prevent these alterations, but it has some limitations, such as shrinkage, enzymatic and non-enzymatic browning reactions, and oxidation of lipids and vitamins. According to previous studies, irradiation might effectively attenuate the undesirable changes caused by drying process, ensuring also higher shelf-life of mushrooms and their decontamination. Electron-beam irradiation presents some technological advantages, since it allows higher dose rates and the possibility to be used in most foods/or thin products, in a short period. Herein, the combined effects of electron-beam irradiation (0, 0.5, 1 and 6 kGy) and storage time (0, 6 and 12 months) were evaluated by measuring changes in nutritional parameters, free sugars, tocopherols, fatty acids and antioxidant activity. As indicated by linear discriminant analysis, storage time had a higher effect on all the evaluated parameters, except fatty acids, which suffer significant changes with both factors. Overall, the obtained results indicate that electron-beam irradiation might be considered as a suitable technique, allowing long-lasting conservation periods, while reducing changes induced by drying treatment.
Introduction
Mushrooms are highly perishable products that undergo after harvest spoilage processes such as moisture loss, shrinkage and color and texture changes (Kulshreshtha et al., 2009). In addition, mushrooms are prone to the presence of parasites, insects and microorganisms. Accordingly, their safety and quality requirements call for better conservation techniques, urging finding alternatives to reduce losses in these food products and increase their shelf-life (Lacroix and Ouattara, 2000).
Macrolepiota procera (Scop.) Singer (parasol mushroom) is an edible saprophytic fungus appreciated and consumed all over the world. It is a common species, but, like all mushrooms, when not consumed immediately, it requires some treatment to prevent its deterioration (Arora et al. 2003). Drying is a widely used postharvest technology, which overcomes problems related to overproduction and short shelf-life. In fact, dried mushrooms, packed in airtight containers can have a shelf-life of above one year (Walde et
al. 2006). It is also expected that the decrease in moisture content may prevent the growth
and development of mold and fungi, minimizing microbial degradation (Jangam et al. 2011). Furthermore, dried products occupy less space than fresh, frozen or canned products, can be stored at room temperature and the nutritional value of the product is concentrated due to water loss (Cao et al. 2003; Celestino, 2010).
In this sense, the irradiation of mushrooms can be a safe and inexpensive method of ensuring hygienic and sensory quality (Akram and Kwon, 2010; Fernandes et al. 2012a), that could be applied to dry samples in order to prevent some of the disadvantages mentioned above. Gamma irradiation is commonly applied to fresh wild mushrooms
(Fernandes et al. 2012b), but studies with electron-beam irradiation are scarcer.
Electron-beam irradiation is known to be highly effective in reducing harmful bacteria in fruits, vegetables, and other foods while preserving the taste, aroma, texture, wholesomeness and nutritional content (Schmidt et al. 2006; Duan et al. 2010; Fernandes et al. 2012a). Moreover, this technique has some advantages when compared to gamma irradiation; the electron-beam sources can be easily connected/disconnected, whereas the gamma sources are continually decaying and gamma irradiation needs to be applied for a larger period due to its lower dose rate. Nevertheless, both technologies are suitable for irradiating mushrooms and give reproducible dose sterilization in microorganisms, despite gamma irradiation is mainly used for large volumes/packages, while the electron-beam is used for most foods/or thin products of low density (IAEA, 2002).
Electron beam irradiation was previously applied to fresh Agaricus bisporus (Koorapati et
al. 2004; Duan et al. 2010) and air-dried Tuber aestivum (Rivera et al. 2011), but its effects
on M. procera were not, as far as we know, studied. In the present work, the combined effects of electron-beam irradiation (0.5, 1 and 6 kGy) and storage time (0, 6 and 12 months) on chemical and antioxidant parameters of wild M. procera dried samples were studied in order to evaluate the feasibility of electron-beam irradiation as a complementary conservation technique.
Standards and reagents
Acetonitrile 99.9%, n-hexane 95% and ethyl acetate 99.8% were of HPLC grade from Lab-Scan (Lisbon, Portugal). The fatty acids methyl ester (FAME) reference standard mixture 37 (standard 47885-U) was purchased from Sigma (St. Louis, MO, USA), as also other individual fatty acid isomers, tocopherol and sugar standards. Racemic tocol, 50 mg/mL, was purchased from Matreya (PA, USA). 2,2-Diphenyl-1-picrylhydrazyl (DPPH) was obtained from Alfa Aesar (Ward Hill, MA, USA). Standards trolox (6-hydroxy-2,5,7,8-tetramethylchroman-2-carboxylic acid) and gallic acid were from Sigma (St. Louis, MO, USA). Methanol and all other chemicals were of analytical grade and obtained from common sources. Water was treated in a Mili-Q water purification system (TGI Pure Water Systems, USA).
Samples and electron-beam irradiation
Macrolepiota procera wild samples were obtained in Trás-os-Montes, in the Northeast of Portugal, in November 2011, and dried at 30 ºC in an oven. Subsequently, the samples were divided in four groups with three specimens in each group: control (non-irradiated, 0.0 kGy); sample 1 (0.5 kGy); sample 2 (1.0 kGy) and sample 3 (6.0 kGy).
The irradiation was performed at the INCT- Institute of Nuclear Chemistry and Technology, in Warsaw, Poland. To estimate the dose during the irradiation process three types of dosimeters were used: a standard dosimeter, a graphite calorimeter, and two routine Gammachrome YR and Amber Perspex dosimeters, from Harwell Company (UK). The irradiation took place in an e-beam irradiator of 10 MeV of energy with pulse duration
of 5.5 µs, pulse frequency of 440 Hz and average beam current of 1.1 mA; the scan width
of 20% for the two first doses and 10% for the last dose. To read the Amber and Gammachrome YR dosimeters, spectrophotometric methods were used. For the Graphite calorimeter dosimeter the electrical resistance was read and converted in dose according to a calibrated curve (Carocho et al. 2012). For simplicity, we refer to the irradiation doses as: 0, 0.5, 1 and 6 kGy.
Before analysis, the samples were reduced to a fine dried powder (20 mesh) and mixed to obtain homogenized samples. The analyses were performed after 0, 6 and 12 months of storage.
Chemical parameters
Nutritional value. Moisture, protein, fat, carbohydrates and ash were determined following the AOAC procedures (AOAC, 1995). The crude protein content (N × 4.38) of the samples was estimated by the macro-Kjeldahl method; the crude fat was determined by extracting a known weight of powdered sample with petroleum ether, using a Soxhlet apparatus; the ash content was determined by incineration at 600 ± 15 oC. Total carbohydrates were calculated by difference. Energy was calculated according to the following equation: Energy (kcal) = 4 × (gprotein) + 3.75 × (gcarbohydrate) + 9 × (gfat).
column (4.6 × 250 mm, 5 mm, Knauer) operating at 30 ºC (7971 R Grace oven). The mobile phase was acetonitrile/deionized water, 70:30 (v/v) at a flow rate of 1 mL/min. The compounds were identified by chromatographic comparisons with authentic standards. Quantification was performed using the internal standard method and sugar contents were further expressed in g per 100 g of dry weight (dw).
Fatty acids. Fatty acids were determined by gas-liquid chromatography with flame ionization detection (GC-FID), after the extraction and derivatization procedures previously described by Heleno et al. (2009). The analysis was carried out with a DANI model GC 1000 instrument equipped with a split/splitless injector, a FID at 260 ºC and a Macherey-Nagel column (30 m × 0.32 mm ID × 0.25 µm df). The oven temperature program was as follows: the initial temperature of the column was 50 ºC, held for 2 min, then a 30 ºC/min ramp to 125 ºC, 5 ºC/min ramp to 160 ºC, 20 ºC/min ramp to 180 ºC, 3 ºC/min ramp to 200 ºC, 20 ºC/min ramp to 220 ºC and held for 15 min. The carrier gas (hydrogen) flow-rate was 4.0 mL/min (0.61 bar), measured at 50 ºC. Split injection (1:40) was carried out at 250 ºC. Fatty acid identification was made by comparing the relative retention times of FAME peaks from samples with standards. The results were recorded and processed using the CSW 1.7 Software (DataApex 1.7) and expressed in relative percentage of each fatty acid.
Waters) operating at 30 ºC. The mobile phase used was a mixture of n-hexane and ethyl acetate (70:30, v/v) at a flow rate of 1 mL/min. The compounds were identified by chromatographic comparisons with authentic standards. Quantification was based on the fluorescence signal response, using the internal standard method, and tocopherols content was further expressed in mg per 100 g of dry weight (dw).
Extraction procedure
The lyophilized powder (1 g) was stirred with methanol (30 mL) at 25 ºC at 150 rpm for 1 h and filtered through Whatman No. 4 paper. The residue was then extracted with an additional portion of methanol. The combined methanolic extracts were evaporated under reduced pressure (rotary evaporator Büchi R-210; Flawil, Switzerland), re-dissolved in methanol at 20 mg/mL (stock solution), and stored at 4 ºC for further use. Successive dilutions were made from the stock solution and submitted to in vitro assays to evaluate the antioxidant activity of the samples. The sample concentrations providing 50% of antioxidant activity or 0.5 of absorbance (EC50) were calculated from the graphs of
antioxidant activity percentages (DPPH, β-carotene/linoleate and TBARS assays) or absorbance at 690 nm (reducing power assay) against sample concentrations. Trolox was used as standard.
Antioxidant activity
sample extract has been added at a particular level, and ADPPH is the absorbance of the
DPPH solution (Guimarães et al., 2013).
Two different procedures were used to evaluate the reducing power: A) Ferricyanide/Prussian blue assay, based on the reduction of ferricyanide to ferrous form and measurement of the developed color at 690 nm in the microplate reader mentioned above; and B) Folin-Ciocalteu assay, measuring the color development at 765 nm; the results were expressed as mg of gallic acid equivalents (GAE) per g of extract (Barros et
al. 2011).
Inhibition of β-carotene bleaching is based on the ability of different concentrations of the extracts to maintain the color of a β-carotene emulsion by neutralizing (50 ºC) of linoleate radicals and other free radicals formed in the system which attack the highly unsaturated β -carotene models); the zero time and endpoint (2 h) absorbances were measured at 470 nm.
β-Carotene bleaching inhibition was calculated using the following equation: (absorbance after 2 h of assay/initial absorbance) × 100 (Guimarães et al., 2013).
Lipid peroxidation inhibition evaluates the capacity of different concentrations of the extracts to prevent the formation of the malondialdehyde (MDA)-TBA complex using brain homogenates. After centrifugation at 3000g for 10 min to remove the precipitated protein, the color intensity of the complex in the supernatant was measured at 532 nm. The inhibition ratio (%) was calculated using the formula: Inhibition ratio (%) = [(A - B)/A] ×
100%, where A and B were the absorbance of the control and the sample solution, respectively (Barros et al. 2011).
Statistical analysis
ED, considering the results for all ST. In this way, the effect of each applied ED or ST is understood with higher accuracy, allowing selecting the best ST independently of applied ED, as well as the most suitable ED independently of required ST.
An analysis of variance (ANOVA) with Type III sums of squares was performed using the GLM (General Linear Model) procedure of the SPSS software, version 18.0. The dependent variables were analyzed using 2-way ANOVA, with “storage time” (ST) and “electron-beam irradiation dose” (ED) as factors. As a significant interaction (ST×ED) was detected for all cases, the two factors were evaluated simultaneously by the estimated marginal means plots (EMM) for all levels of each factor.
In addition, a linear discriminant analysis (LDA) was used to assess the effect of the ST and ED on nutritional value, free sugars, fatty acids, tocopherols and antioxidant activity results. A stepwise technique, using the Wilks’ λ method with the usual probabilities of F (3.84 to enter and 2.71 to remove), was applied for variable selection. This procedure uses a combination of forward selection and backward elimination processes, where each new included variable is preceded by the verification of significance of all previously selected variables (Maroco, 2003; López et al. 2008). With this approach, it is possible to identify the significant variables obtained for each sample. To verify the significance of canonical discriminant functions, the Wilks’ λ test was applied. The classification accuracy of the model was assessed through a leaving-one-out cross-validation procedure.
All statistical tests were performed at a 5% significance level. For each ED and or ST, three samples were analyzed, with all the assays being also carried out in triplicate. The results are expressed as mean value ± standard deviation (SD).
The fixed factors (ST and ED) showed significant (p < 0.001) interaction (ST × ED) in all
assayed parameters. Accordingly, and despite the least squares means are presented for both effects, no multiple comparisons could be performed. Nevertheless, from the analysis of the EMM (estimated marginal means) plots (data shown only in specific cases) some overall conclusions can be outlined.
The chemical parameters results are presented in Tables 1-4. Nutritionally, M. procera has
high water content (≈90%), with carbohydrates (≈60%) and proteins (≈30%) as the main components in dry mass basis, in agreement previous reports (Barros et al. 2007; Ouzouni
and Riganakos, 2007). Besides the low percentage in dry mass, M. procera presented low
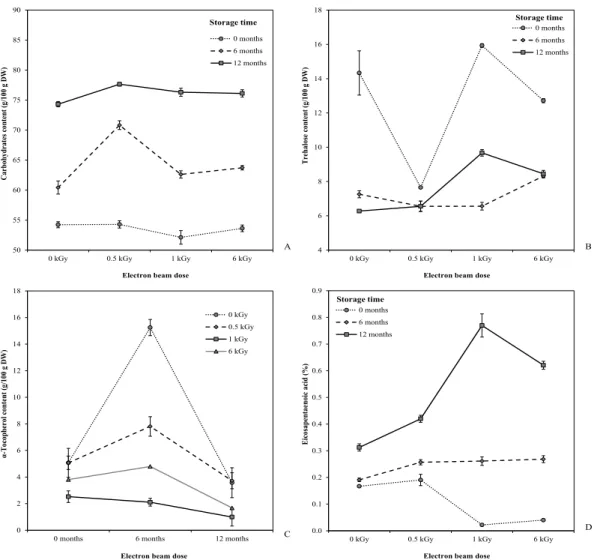
fat content, being a low caloric food. Concerning the effects of ST and ED, protein, fat and ash, showed a decrease (Table 1) tendency with time, a result reflected in carbohydrates content (Figure 1A), which increased along time. On the hand, the applied irradiation did not cause any marked tendencies, except for lower protein value in samples irradiated with 0.5 kGy (Table 1).
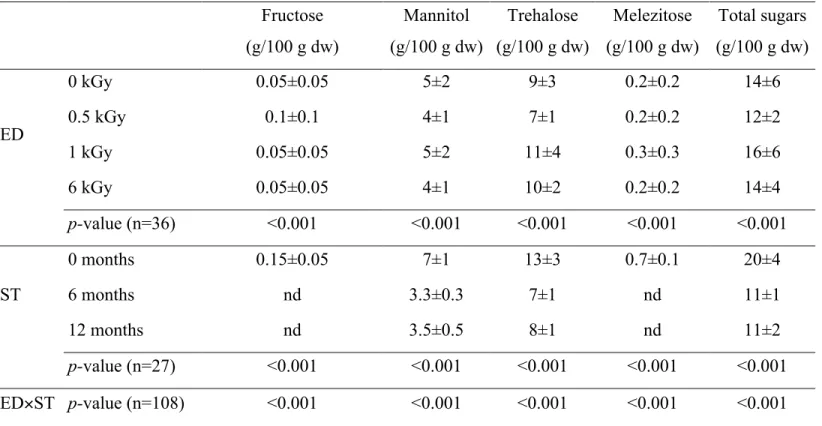
Free sugars are good indicators of a suitable conservation technology due to their
sensibility to technical practices (Barreira et al. 2010). Trehalose (≈9 g/100 g dw) and
mannitol (≈5 g/100 g dw) were the main sugars (Table 2), presenting also low contents in
fructose and melezitose in non-stored samples. The detected profiles are similar to the reported for M. procera submitted to different processing treatments (Barros et al. 2007). Once more, the applied irradiation did not cause particular changes, except for higher fructose values in samples irradiated with 0.5 kGy; on the other hand, trehalose (Figure 1B) and mannitol presented maximum values in non-stored samples.
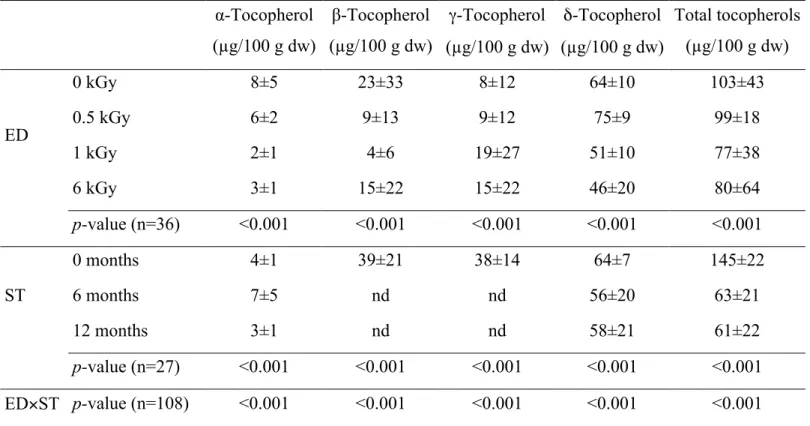
δ-Tocopherol was the main vitamin E isoform (≈60 µg/100 g dw; Table 3). β-tocopherol
and γ-tocopherol were also detected in significant amounts, but while δ-tocopherol was
detected in non-stored samples. α-Tocopherol tended to be lower in samples irradiated with higher ED (Figure 1C).
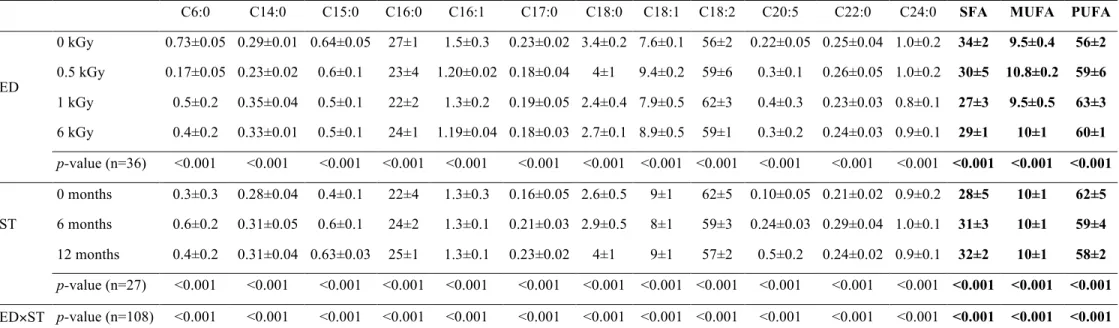
In what regards fatty acids (FA), 25 individual molecules were quantified; those detected in contents higher than 0.2% are presented in Table 4 (in the linear discriminant analysis
presented onwards all FA were included). Linoleic (≈60%), palmitic (≈25%) and oleic
(≈9%) acids were the major FA in M. procera. The abundance of linoleic acid might be
related with the organoleptic characteristics of this mushroom, since this FA is the precursor of 1-octen-3-ol, known as “fungi alcohol”, the main aromatic component in fungi
(Maga, 1981). In most cases, FA did not show marked tendencies caused by different ED
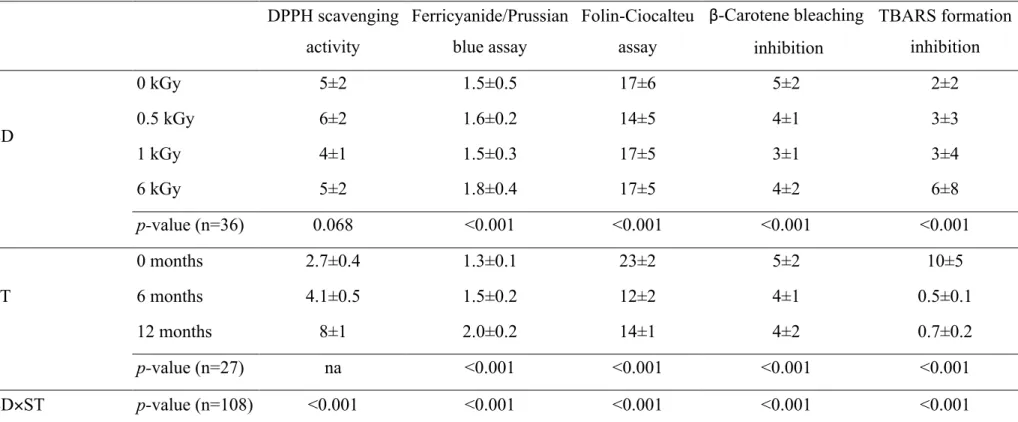
or ST. Nevertheless, C6:0, C8:0, C10:0 and C23:0 were maximized after 6 months of storage; non stored samples had the highest C12:0 and the lowest C15:0 contents; samples irradiated with 0.5 kGy presented the highest C8:0 and the lowest C14:0 levels, while the irradiation with 1 kGy minimizes the C15:0 content. C20:5, the well-known eicosapentaenoic acid (EPA), was the only FA with an increase along time (Figure 1D). The antioxidant potential of M. procera samples was used as a measure of their bioactivity
(Table 5). The results could not be classified by multiple comparison tests (the detected
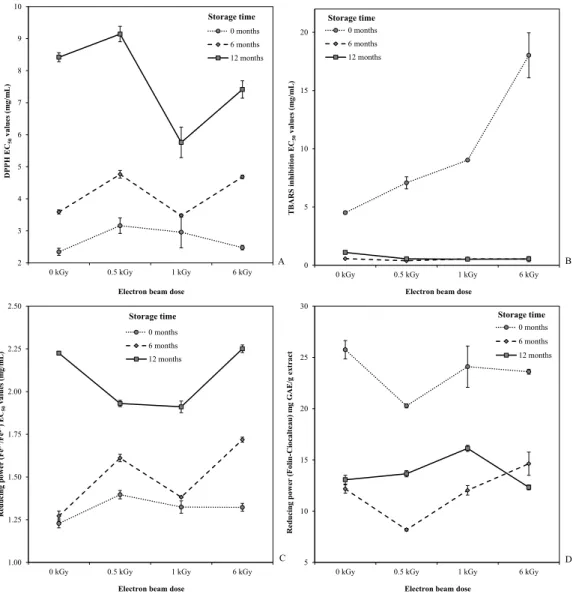
interactions were always significant), but ST seemed to cause a higher effect. This outcome was confirmed by the EMM plots, which clearly shown higher DPPH scavenging activity (Figure 2A), lower TBARS formation inhibition (Figure 2B) and higher reducing power (Figure 2C and D), for non-stored samples. Regarding different ED, the obtained results did not show to be correlated with the assayed doses.
specific cases). In this analysis, higher differences among the results obtained for each defined group (0, 6 and 12 months or 0, 0.5, 1 and 6 kGy) will allow better classification performances, as it can be assessed by evaluating the percentage of correctly classified groups. Data presented in Tables 1-5 were evaluated separately regarding differences induced by ST or by ED. Despite the similarity detected for some individual parameters, the classification performance was generally high, especially for ST.
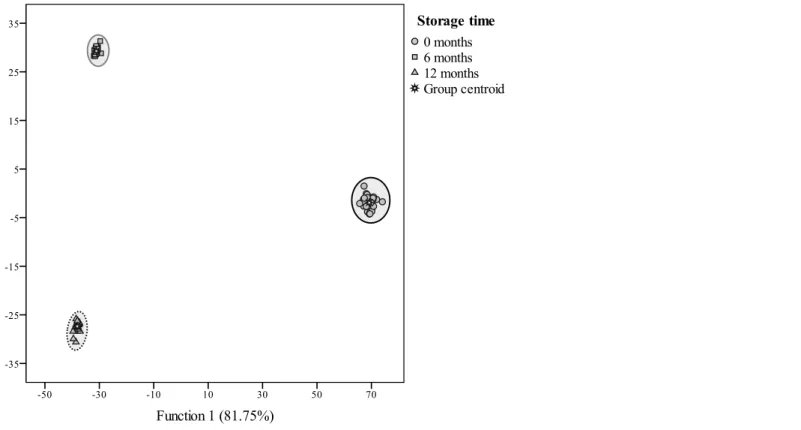
The higher effect of ST was reflected in the percentages of correctly classified cases: all parameters, fatty acids, nutritional parameters and antioxidant activity results- 100% for the original groups and for the cross-validation procedure; tocopherols- 83.8% for the original groups and for the cross-validation procedure; free sugars- 66.7% for the original groups and for the cross-validation procedure. All models defined two (except when using free sugars alone, for which only one significant function was defined) significant functions and included 100% of the variance.
Regarding ED, the percentage of correctly classified groups was lower: all parameters and fatty acids- 100% for the original groups and for the cross-validation procedure; antioxidant activity results- 66.7% for the original groups and 61.1% for the validation procedure; free sugars- 65.7% for the original groups and for the validation procedure; tocopherols- 65.7% for the original groups and 61.1% for the cross-validation procedure; nutritional parameters- 56.5% for the original groups and 40.7% for the cross-validation procedure. All models defined three significant functions and included 100% of the variance.
Further details regarding all performed LDA are presented in Table 6.
Regarding ED (Figure 3A), function 1 (means of canonical variance (MCV), 0 kGy: -18.168; 0.5 kGy: -34.190; 1 kGy: 27.782; 6 kGy: 24.577) and function 2 (MCV, 0 kGy: 19.436; 0.5 kGy: -14.209; 1 kGy: -1.322; 6 kGy: -3.905) separated primarily 0 and 0.5 kGy
from the remaining doses, indicating that fructose, δ-tocopherol, C14:0 C6:0, C15:0, C16:0, C16:1, C17:0, C18:1, C20:5, C22:1, trehalose and α-tocopherol are the parameters with highest variation among non-irradiated samples or samples irradiated with 0.5 kGy and those irradiated with higher doses (Table 6). Function 3 was effective to separate 1 and 6 kGy (MCV, 0 kGy: 0.719; 0.5 kGy: -1.120; 1 kGy: -10.961; 6 kGy. 11.363), with reducing power (RP) (Fe3+/Fe2+), β-tocopherol, C10:0, C12:0, C18:2, C20:0, C20:1 and C20:3 (Table 6) as the variables more affected by the increase from 1 to 6 kGy. On the other hand, nutritional parameters were the least affected by ED, as can be concluded from the low percentages of accurately classified groups (56.5% for the original groups and 40.7% for the cross-validation procedure) and verified on the plot of the means of canonical variance (Figure 3B), that do not individualize any specific group.
Conclusions
Overall, electron-beam irradiation did not impart additional changes to most chemical and antioxidant parameters of M. procera dried samples. Accordingly, irradiation might be applied as a potential complementary treatment, since it has decontaminating ability, while maintaining of organoleptic characteristics of mushrooms. This is a very promising result, since electron-beam irradiation might attenuate most unwanted changes caused by drying, maintaining its long-term effectiveness.
Acknowledgements
The authors are grateful to the Foundation for Science and Technology (FCT, Portugal) for financial support of research centres CIMO (PEst-OE/AGR/UI0690/2011) and REQUIMTE (PEst-C/EQB/LA0006/2011). Â. Fernandes, A.L. Antonio and J.C.M. Barreira thank FCT, POPH-QREN and FSE for their grants (SFRH/BD/76019/2011, SFRH/PROTEC/67398/2010 and SFRH/BPD/72802/2010, respectively). Prof. A. Chmielewski, General Director of the Institute of Nuclear Chemistry and Technology, Warsaw, Poland, for allowing e-beam irradiations.
References
Almeida, A.P.G. (2006). Avaliação da influência do processo de irradiação em especiarias utilizando a técnica de difração de raios-X. Dissertação - Universidade Federal do Rio de Janeiro, COPPE, Brasil.
Arora, S., Shivhare, U. S., Ahmed, J., & Raghavan, G. S. V. (2003). Drying kinetics of Agaricus bisporus and Pleurotus florida mushrooms. American Society of Agricultural Engineers, 46, 721-724.
AOAC. (1995). Official methods of analysis (16th Ed.). Arlington VA, USA: Association of Official Analytical Chemists.
Barreira, J. C. M., Pereira, J.A., Oliveira, M. B. P. P., & Ferreira, I. C. F. R. (2010). Sugars profiles of different chestnut (Castanea sativa Mill.) and Almond (Prunus dulcis) Cultivars by HPLC-RI. Plant Foods for Human Nutrition, 65, 38-43.
Barros, L., Baptista, P., Correia, D. M., Sá Morais, J., & Ferreira, I. C. F. R. (2007). Effects of conservation treatment and cooking on the chemical composition and antioxidant activity of Portuguese wild edible mushrooms. Journal of Agricultural and Food Chemistry, 55, 4781-4788.
Barros, L., Cabrita, L., Vilas Boas, Miguel, Carvalho, A. M., & Ferreira, I. C. F. R. (2011). Chemical, biochemical and electrochemical assays to evaluate phytochemicals and antioxidant activity of wild plants. Food Chemistry, 127, 1600-1608.
Cao, W., Nishiyama, Y., & Koide, S. (2003). Thin-layer drying of Maitake Mushroom analysed with a simplified model. Biosystems Engineering, 85, 331-337.
Carocho, M., Barreira, J. C. M., Antonio, A. L., Bento, A., Kaluska, I., & Ferreira, I. C. F. R. (2012). Effects of Electron Beam Radiation on Nutritional parameters of Portuguese Chestnuts (Castanea sativa Mill). Journal of Agricultural and Food Chemistry, 60, 7754-7760.
Celestino, S. M. C. (2010). Princípios de Secagem de Alimentos. Embrapa Cerrados, Planaltina. ISSN 1517-5111.
Fernandes, Â., Antonio, A. L., Oliveira, M. P. P., Martins, A., & Ferreira, I. C. F. R. (2012a). Effect of gamma and electron beam irradiation on the physico-chemical and nutritional properties of mushrooms: A review. Food Chemistry, 135, 641-650. Fernandes, Â., Antonio, A. L., Barreira, J. C. M., Botelho, L., Oliveira, M. B. P. P.,
Martins, A., & Ferreira, I. C. F. R. (2012b). Effects of gamma irradiation on the chemical composition and antioxidant activity of Lactarius deliciosus L. wild edible mushroom. Food and Bioprocess Technology, doi 10.1007/s11947-012-0931-5. Guimarães, R., Barros, L., Dueñas, M., Calhelha, R. C., Carvalho, A. M., Santos-Buelga,
C., Queiroz, M. J. R. P., Ferreira, I. C. F. R. (2013). Nutrients, phytochemicals and bioactivity of wild Roman chamomile: A comparison between the herb and its preparations. Food Chemistry, 136, 718-725.
Heleno, S. A., Barros, L., Sousa, M. J., Martins, A., & Ferreira, I. C. F. R. (2009). Study and characterization of selected nutrients in wild mushrooms from Portugal by gas chromatography and high performance liquid chromatography. Microchemical Journal, 93, 195-199.
Heleno, S. A., Barros, L., Sousa, M. J., Martins, A., & Ferreira, I. C. F. R. (2010). Tocopherols composition of Portuguese wild mushrooms with antioxidant capacity. Food Chemistry, 119, 1443-1450.
IAEA-International Atomic Energy Agency. (2002). Dosimetry for food irradiation. Technical Report Series 490, Vienna.
ICMSF. (1985). Ecologia microbiana de los alimentos 2. International Commission on Microbiological Specifications for Foods. Editorial Acribia, Zaragoza, Spain.
Koorapati, A., Foley, D., Pilling, R., & Prakash, A. (2004). Electron-beam irradiation preserves the quality of white button mushrooms (Agaricus bisporus) slices. Journal of Food Science and Tecnology, 6, 25-29.
Kulshreshtha, M., Singh, A., & Deepti and Vipul. (2009). Effect of drying conditions on mushrooms quality. Journal of Engineering Science and Technology, 4, 90-98
Lacroix, M., & Ouattara, B. (2000) Combined industrial processes with irradiation to assure innocuity and preservation of food products - a review. Food Research International, 33, 719-724.
López, A., García, P., & Garrido, A. (2008). Multivariate characterization of table olives according to their mineral nutrient composition. Food Chemistry, 106, 369-378. Maga J.A. (1981). Mushroom flavor. Journal of Agricultural and Food Chemistry, 29, 4-7. Maroco, J. (2003) Análise Estatística, com utilização do SPSS, Edições Sílabo, Lisboa,
Portugal.
Maskan, M. (2000). Microwave/air and microwave finish drying of banana. Journal of Food Engineering, 44, 71-78.
Ouzouni, P. K., & Riganakos, K. A. (2007). Nutritional value and metal content of Greek wild edible fungi. Acta Alimentaria, 36, 99-110.
Rivera, C. S., Blanco, D., Marco, P., Oria, R., & Venturini, M. E. (2011). Effects of electron-beam irradiation on the shelf life, microbial populations and sensory characteristics of summer truffles (Tuber aestivum) packaged under modified atmospheres. Food Microbioloy, 28, 141-148.
Table 1. Proximate composition and corresponding energetic value of dried M. procera submitted to different electron beam irradiation doses
(ED) and storage times (ST). The results are presented as mean±SD.
Dry matter
(g/100 g fw)
Fat
(g/100 g dw)
Protein
(g/100 g dw)
Carbohydrates
(g/100 g dw)
Ash
(g/100 g dw)
Energy
(kcal/100 g dw)
ED
0 kGy 10±1 2±1 29±6 63±8 6±1 388±2
0.5 kGy 9±1 2±1 24±8 68±10 6±1 387±3
1 kGy 9±1 2±1 28±8 64±10 6±1 385±2
6 kGy 9±1 1.8±0.5 28±8 64±9 6±1 386±3
p-value (n=36) 0.068 <0.001 <0.001 <0.001 <0.001 <0.001
ST
0 months 9±1 2.8±0.4 36±1 54±1 7.7±0.4 383±1
6 months na 2.0±0.2 28±4 64±4 5.2±0.3 389±1
12 months na 1.1±0.1 18±1 76±1 4.7±0.3 387±1
p-value (n=27) na <0.001 <0.001 <0.001 <0.001 <0.001
Table 2. Sugars composition of dried M. procera submitted to different electron beam irradiation doses (ED) and storage times (ST). The results
are presented as mean±SD.
Fructose
(g/100 g dw)
Mannitol
(g/100 g dw)
Trehalose
(g/100 g dw)
Melezitose
(g/100 g dw)
Total sugars
(g/100 g dw)
ED
0 kGy 0.05±0.05 5±2 9±3 0.2±0.2 14±6
0.5 kGy 0.1±0.1 4±1 7±1 0.2±0.2 12±2
1 kGy 0.05±0.05 5±2 11±4 0.3±0.3 16±6
6 kGy 0.05±0.05 4±1 10±2 0.2±0.2 14±4
p-value (n=36) <0.001 <0.001 <0.001 <0.001 <0.001
ST
0 months 0.15±0.05 7±1 13±3 0.7±0.1 20±4
6 months nd 3.3±0.3 7±1 nd 11±1
12 months nd 3.5±0.5 8±1 nd 11±2
p-value (n=27) <0.001 <0.001 <0.001 <0.001 <0.001
ED×ST p-value (n=108) <0.001 <0.001 <0.001 <0.001 <0.001
Table 3. Tocopherols composition of M. procera submitted to different electron beam irradiation doses (ED) and storage times (ST). The results
are presented as mean±SD.
α-Tocopherol
(µg/100 g dw)
β-Tocopherol
(µg/100 g dw)
γ-Tocopherol
(µg/100 g dw)
δ-Tocopherol
(µg/100 g dw)
Total tocopherols
(µg/100 g dw)
ED
0 kGy 8±5 23±33 8±12 64±10 103±43
0.5 kGy 6±2 9±13 9±12 75±9 99±18
1 kGy 2±1 4±6 19±27 51±10 77±38
6 kGy 3±1 15±22 15±22 46±20 80±64
p-value (n=36) <0.001 <0.001 <0.001 <0.001 <0.001
ST
0 months 4±1 39±21 38±14 64±7 145±22
6 months 7±5 nd nd 56±20 63±21
12 months 3±1 nd nd 58±21 61±22
p-value (n=27) <0.001 <0.001 <0.001 <0.001 <0.001
ED×ST p-value (n=108) <0.001 <0.001 <0.001 <0.001 <0.001
Table 4. Fatty acids composition (relative percentages)* of dried M. procera submitted to different electron beam irradiation doses (ED) and
storage times (ST). The results are presented as mean±SD.
C6:0 C14:0 C15:0 C16:0 C16:1 C17:0 C18:0 C18:1 C18:2 C20:5 C22:0 C24:0 SFA MUFA PUFA
ED
0 kGy 0.73±0.05 0.29±0.01 0.64±0.05 27±1 1.5±0.3 0.23±0.02 3.4±0.2 7.6±0.1 56±2 0.22±0.05 0.25±0.04 1.0±0.2 34±2 9.5±0.4 56±2
0.5 kGy 0.17±0.05 0.23±0.02 0.6±0.1 23±4 1.20±0.02 0.18±0.04 4±1 9.4±0.2 59±6 0.3±0.1 0.26±0.05 1.0±0.2 30±5 10.8±0.2 59±6
1 kGy 0.5±0.2 0.35±0.04 0.5±0.1 22±2 1.3±0.2 0.19±0.05 2.4±0.4 7.9±0.5 62±3 0.4±0.3 0.23±0.03 0.8±0.1 27±3 9.5±0.5 63±3
6 kGy 0.4±0.2 0.33±0.01 0.5±0.1 24±1 1.19±0.04 0.18±0.03 2.7±0.1 8.9±0.5 59±1 0.3±0.2 0.24±0.03 0.9±0.1 29±1 10±1 60±1
p-value (n=36) <0.001 <0.001 <0.001 <0.001 <0.001 <0.001 <0.001 <0.001 <0.001 <0.001 <0.001 <0.001 <0.001 <0.001 <0.001
ST
0 months 0.3±0.3 0.28±0.04 0.4±0.1 22±4 1.3±0.3 0.16±0.05 2.6±0.5 9±1 62±5 0.10±0.05 0.21±0.02 0.9±0.2 28±5 10±1 62±5
6 months 0.6±0.2 0.31±0.05 0.6±0.1 24±2 1.3±0.1 0.21±0.03 2.9±0.5 8±1 59±3 0.24±0.03 0.29±0.04 1.0±0.1 31±3 10±1 59±4
12 months 0.4±0.2 0.31±0.04 0.63±0.03 25±1 1.3±0.1 0.23±0.02 4±1 9±1 57±2 0.5±0.2 0.24±0.02 0.9±0.1 32±2 10±1 58±2
p-value (n=27) <0.001 <0.001 <0.001 <0.001 <0.001 <0.001 <0.001 <0.001 <0.001 <0.001 <0.001 <0.001 <0.001 <0.001 <0.001
ED×ST p-value (n=108) <0.001 <0.001 <0.001 <0.001 <0.001 <0.001 <0.001 <0.001 <0.001 <0.001 <0.001 <0.001 <0.001 <0.001 <0.001
Table 5. In vitro antioxidant properties obtained forthe extracts of dried M. procera submitted to different electron beam irradiation doses (ED)
and storage times (ST) (mean±SD). Values are presented as EC50 values (mg/mL) for all assays except Folin-Ciocalteau, expressed as mg GAE/g
extract.
Reducing power Lipid peroxidation inhibition
DPPH scavenging
activity
Ferricyanide/Prussian
blue assay
Folin-Ciocalteu
assay
β-Carotene bleaching
inhibition
TBARS formation
inhibition
ED
0 kGy 5±2 1.5±0.5 17±6 5±2 2±2
0.5 kGy 6±2 1.6±0.2 14±5 4±1 3±3
1 kGy 4±1 1.5±0.3 17±5 3±1 3±4
6 kGy 5±2 1.8±0.4 17±5 4±2 6±8
p-value (n=36) 0.068 <0.001 <0.001 <0.001 <0.001
ST
0 months 2.7±0.4 1.3±0.1 23±2 5±2 10±5
6 months 4.1±0.5 1.5±0.2 12±2 4±1 0.5±0.1
12 months 8±1 2.0±0.2 14±1 4±2 0.7±0.2
p-value (n=27) na <0.001 <0.001 <0.001 <0.001
ED×ST p-value (n=108) <0.001 <0.001 <0.001 <0.001 <0.001
na- not applicable; EC50- extract concentration corresponding to 50% of antioxidant activity or 0.5 of absorbance for the Ferricyanide/Prussian
Table 6. Discriminant analysis features for the models obtained from the results of the applied assays.
Selected
variables
Most correlated variables with:
Function 1 Function 2 Function 3
ED
All
parameters
reducing power (RP) (Fe3+/Fe2+), fructose,
trehalose, α-tocopherol, β-tocopherol, δ -tocopherol, C6:0, C10:0, C12:0, C14:0,
C15:0, C16:0, C16:1, C17:0, C18:1, C18:2,
C20:0, C20:1, C20:3, C20:5, C22:1
fructose,
δ-tocopherol,
C14:0
C6:0, C15:0, C16:0,
C16:1, C17:0, C18:1,
C20:5, C22:1,
trehalose, α -tocopherol
RP (Fe3+/Fe2+), β -tocopherol, C10:0, C12:0, C18:2, C20:0, C20:1, C20:3 Antioxidant activity
β-carotene, DPPH, RP (Folin-Ciocalteau and
Fe3+/Fe2+), TBARS TBARS
RP
(Folin-Ciocalteau)
β-carotene, DPPH,
RP (Fe3+/Fe2+)
Nutritional energetic value, carbohydrates and fat energetic value energetic value carbohydrates, fat
Free sugars fructose, mannitol and trehalose trehalose trehalose, mannitol fructose
Tocopherols α-tocopherol, β-tocopherol, γ-tocopherol and
δ-tocopherol
α-tocopherol β-tocopherol, δ -tocopherol
α-tocopherol, γ -tocopherol
Fatty acids
C6:0, C10:0, C14:0, C16:1, C17:0, C18:1, C18:3, C20:1, C20:3 and C22:1
C14:0, C18:3,
C20:2, C22:0
C6:0, C8:0, C16:1,
C17:0, C18:1, C22:1,
C24:1 C10:0, C12:0, C15:0, C16:0, C18:0, C20:1, C20:3, C20:5, C24:0, ST All parameters
RP (Fe3+/Fe2+), fructose, melezitose,
trehalose, β-tocopherol, C6:0, C10:0, C14:0, C15:0, C16:0, C17:0, C18:0, C20:0, C20:2,
C20:3, C20:5, C24:0
melezitose,
fructose,
trehalose, β -tocopherol,
C14:0, C16:0,
C15:0, C17:0,
RP (Fe3+/Fe2+), C6:0,
C10:0, C18:0, C20:3,
C20:5, C23:0, C24:0
C20:0, C20:2
Antioxidant
activity
β-carotene, DPPH, RP (Folin-Ciocalteau and
Fe3+/Fe2+), TBARS
DPPH, reducing
power
(Fe3+/Fe2+)
DPPH, RP
(Folin-Ciocalteau) -
Nutritional ash, carbohydrate and protein ash,
carbohydrate ash -
Free sugars fructose and melezitose fructose,
melezitose - -
Tocopherols α-tocopherol, β-tocopherol and γ-tocopherol β-tocopherol, γ
-tocopherol α-tocopherol -
Fatty acids
C6:0, C10:0, C12:0, C14:1, C16:0, C16:1, C18:0, C20:3, C20:5, C22:0, C22:1, C23:0, C24:0
C12:0, C16:0,
C20:3, C22:0
C6:0, C10:0, C14:1,
C16:1, C18:0, C20:5,
C22:1, C23:0, C24:0
50 55 60 65 70 75 80 85 90
0 kGy 0.5 kGy 1 kGy 6 kGy
Ca rbo hy dra tes c o nte nt (g /1 0 0 g DW)
Electron beam dose
0 months 6 months 12 months A Storage time 4 6 8 10 12 14 16 18
0 kGy 0.5 kGy 1 kGy 6 kGy
T re ha lo se co nte nt (g /1 0 0 g DW)
Electron beam dose
0 months 6 months 12 months B Storage time 0 2 4 6 8 10 12 14 16 18
0 months 6 months 12 months
α -T o co ph er o l c o nte nt (g /1 0 0 g DW)
Electron beam dose
0 kGy 0.5 kGy 1 kGy 6 kGy C 0.0 0.1 0.2 0.3 0.4 0.5 0.6 0.7 0.8 0.9
0 kGy 0.5 kGy 1 kGy 6 kGy
E ico sa penta eno ic a cid ( %)
Electron beam dose 0 months 6 months 12 months D Storage time
Figure 1. Interactions among storage time and electron-beam irradiation dose effects on the chemical parameters of M. procera dried samples. A- carbohydrates; B- trehalose;
2 3 4 5 6 7 8 9 10
0 kGy 0.5 kGy 1 kGy 6 kGy
DP P H E C50 v a lues ( m g /m L )
Electron beam dose
0 months 6 months 12 months Storage time 1.00 1.25 1.50 1.75 2.00 2.25 2.50
0 kGy 0.5 kGy 1 kGy 6 kGy
Reducing po w er ( F e 3+ /Fe 2+) E C50 v a lues ( m g /m L )
Electron beam dose 0 months 6 months 12 months C Storage time 0 5 10 15 20
0 kGy 0.5 kGy 1 kGy 6 kGy
T B ARS inh ibi tio n E C50 v a lues ( m g /m L )
Electron beam dose 0 months 6 months 12 months B Storage time 5 10 15 20 25 30
0 kGy 0.5 kGy 1 kGy 6 kGy
Reducing po w er ( F o lin -Cio ca lt ea u) m g G AE /g ex tra ct
Electron beam dose
0 months 6 months 12 months Storage time D A
Figure 3. Discriminant scores scatter plot of the canonical functions defined for all assayed parameters (A) and the nutritional parameters alone
(B) results according with electron-beam irradiation dose.
A