Full Terms & Conditions of access and use can be found at
http://www.tandfonline.com/action/journalInformation?journalCode=rspb20
Sports Biomechanics
ISSN: 1476-3141 (Print) 1752-6116 (Online) Journal homepage: http://www.tandfonline.com/loi/rspb20
Start and turn performances of elite sprinters at
the 2016 European Championships in swimming
Jorge E. Morais, Daniel A. Marinho, Raul Arellano & Tiago M. Barbosa
To cite this article: Jorge E. Morais, Daniel A. Marinho, Raul Arellano & Tiago M. Barbosa (2018): Start and turn performances of elite sprinters at the 2016 European Championships in swimming, Sports Biomechanics, DOI: 10.1080/14763141.2018.1435713
To link to this article: https://doi.org/10.1080/14763141.2018.1435713
Published online: 26 Mar 2018.
Submit your article to this journal
View related articles
SportS BiomechanicS, 2018
https://doi.org/10.1080/14763141.2018.1435713
Start and turn performances of elite sprinters at the 2016
European Championships in swimming
Jorge E. Moraisa,d, Daniel A. Marinhoa,d, Raul Arellanoe and Tiago M. Barbosab,c,d
aDepartment of Sport Sciences, Faculty of Social and human Sciences, University of Beira interior, covilhã, portugal; bDepartment of Sport Sciences, Superior School of education, polytechnic institute of Bragança, Bragança, portugal; cnational institute of education, nanyang technological University, Singapore, Singapore; dresearch centre in Sports, health and human Development, University of trás-os-montes and alto Douro, Vila real, portugal; eDepartment of physical and Sports education, University of Granada, Granada, Spain
ABSTRACT
The aim of this study was to examine the performance characteristics of male and female finalists in the 100-m distance at the 2016 European Championships in swimming (long-course-metre). The performances of all 64 (32-males and 32-females) were analysed (8 swimmers per event; Freestyle, Backstroke, Breaststroke and Butterfly). A set of start and turn parameters were analysed. In the start main outcome, male swimmers were faster in Butterfly (5.71 ± 0.14s) and females in Freestyle (6.68 ± 0.28s). In the turn main outcome, male and female swimmers were faster in Freestyle (males: 9.55 ± 0.13s; females: 10.78 ± 0.28s). A significant and strong stroke effect was noted in the start and turn main outcome, in both sexes. In the start plus the turn combined, males and females were faster in Freestyle (males: 15.40 ± 0.20s; females: 17.45 ± 0.54s). The start and the turn combined accounted almost one-third of the total race time in all events, and non-significant differences (p > 0.05) were noted across the four swim strokes. Once this research made evident the high relevance of start and turns, it is suggested that coaches and swimmers should dedicate an expressive portion of the training perfecting these actions.
Introduction
Olympic and World records are broken on regular basis in competitive swimming. Literature notes that performance enhancement in elite swimmers is multifactorial (Barbosa, Bragada, Reis, Marinho, & Silva, 2010). The planning and execution of an appropriate race strategy is one of those key-factors and considered as paramount to excel in competitive swimming (Arellano, Brown, Cappaert, & Nelson, 1994).
The swim race can be split-up into several components or phases: the start, the clean swimming (or swim stroke), the turn(s) and the finish. The swimming speed is deter-mined by the stroke length and stroke rate (Craig & Pendergast, 1979). Over the last few
KEYWORDS
Kinematics; technique; performance analysis; race
ARTICLE HISTORY
received 8 June 2017 accepted 25 January 2018
© 2018 informa UK Limited, trading as taylor & Francis Group
decades, the swim stroke profile of elite swimmers at major competitions, such as World Championships and Olympic Games, have been reported (e.g., Arellano et al., 1994; Hellard et al., 2008; Jesus et al., 2011; Wakayoshi, Nomura, Takahashi, Mutoh, & Miyashita, 1992). Overall, researchers had a strong interest on the swim stroke, disregarding the acyclic phases of the race (i.e., the start and the turn). Albeit, studies can be found about such topic (e.g., Mason & Cossor, 2001; Pereira et al., 2015; Vantorre, Seifert, Fernandes, Vilas-Boas, & Chollet, 2010; Veiga & Roig, 2016; Veiga, Roig, & Gómez-Ruano, 2016). However, there is no evidence about how elite swimmers behave in major competitions in all four strokes. In short-distance events (i.e., sprinting), the start and turn(s) account for a significant proportion of time and distance, e.g., in a 100-m sprint the swimmer might spend a total of 40-m in the start, turn and finish (e.g., Cossor & Mason, 2001; Mason & Cossor, 2001). Nevertheless, one may argue that the last 5-m of each lap can also be considered as part of the clean swim segment of the race, reducing that length to no more than 30-m. In middle- and long-distance events, the addition of trivial enhancements in each turn can account for a significant improvement in the final race time. For instance, in the long course 800-m Freestyle event the swimmer performs 15 turns. If this swimmer improves just 0.1s in each turn, this accounts for an overall improvement of 1.5s in the final race time.
Studies have pointed out the key-determinants of the start (Arellano, García, Gavilán, & Pardillo, 1996; Blanksby, Nicholson, & Elliott, 2002; Tor, Pease, & Ball, 2015; Vantorre et al., 2010) and turn (Lyttle, Blanksby, Elliott, & Lloyd, 1999; Veiga & Roig, 2016). The split time at the 15-m mark is significantly associated to the start performance (Cossor & Mason,
2001). Moreover, it was reported that the start performance should rely on the optimisation of the underwater phase (i.e., gliding, dolphin kicks and water breakout) before starting the swim stroke (e.g., Cossor & Mason, 2001; Guimarães & Hay, 1985). The body of knowledge on turning is also rather scarce, when comparing to the swim stroke (e.g., Mason & Cossor,
2001; Pereira et al., 2015; Slawson, Conway, Jusham, Le Sage, & West, 2010; Veiga & Roig,
2016, 2017). A study conducted by Mason and Cossor (2001) concluded that the fastest swimmers were not the fastest turners. A non-significant relationship was noted between the pre-turn swim velocity and the turn velocity, suggesting that swim stroke and turning performances are not related. It was also noted that the push-off and underwater phase were the most determinant moments of the turn performance (Mason & Cossor, 2001). This emphasises the need of specific training sets to improve the turning performance. Recently, Veiga & Roig (2016) pointed out that coaches and swimmers should prepare a race strategy, for the turn(s), based on the underwater performance of each swimmer, since they are strongly related (the turn and the underwater performance).
To the best of our knowledge, a comparison of the start and turning performances between the four swimming strokes, in major competition events, in both sexes is also very limited. Only few studies can be found in the literature, assessing the start (e.g., Arellano et al., 1994; Cossor & Mason, 2001; Veiga & Roig, 2017), and the turn (e.g., Arellano et al.,
1994; Mason & Cossor, 2001; Veiga & Roig, 2016; Veiga et al., 2016). Besides that, only few provide information about what happens in intermediate stages of the total start and turn (as the underwater time and distance) (e.g., Tor et al., 2015; Veiga & Roig, 2016; Veiga et al.,
2016). This information might be important in understanding how swimmers can improve their total start and turn time. Moreover, there have been only a few studies reporting the contribution of the start and turn performances to the final race time (e.g., Arellano et al.,
SPORTS BIOMECHANICS 3
in understanding how starts and turns can help enhancing the performance, and how these moments can affect the overall race strategy (e.g., Tor et al., 2015; Veiga & Roig, 2017).
The aims of this study were to: (i) examine the start and turn performances of male and female elite sprinting swimmers (racing the final of the 100-m events at a major swimming competition) and; (ii) compute the partial contribution of the start and turn to the final race time It was hypothesised that: (i) a stroke effect would be verified (i.e., significant variations should be found between swimming strokes in each sex) and; (ii) the start and turn show meaningful contributions to the final race time.
Methods
Participants
The performances of all 64 (32 males and 32 females) finalists in the 100-m events at the 2016 long course metre LEN European Aquatic Championships, held in London, were analysed (8 swimmers per event; Freestyle, Backstroke, Breaststroke and Butterfly; males and females).
Data collection
The official race times (final race time of the 100-m event, 50-m split time and reaction/block time) were retrieved from the competition official website ( www.london2016.microplust-iming.com).
The championships organisation provided the recordings of all races in high-definition (HD) video (f = 50 Hz). The system delivered real-time multi-angle recordings. A set of 10 pan-tilt-zoom cameras tracked the swimmers, one camera for each lane (AXIS v5915, Lund, Sweden). Each swimmer was recorded by one of these cameras. Two fixed cameras (AXIS q1635, Lund, Sweden) recorded both ends of the swimming pool, enabling the analysis of the start and turn. The official timer was synchronised with starting lights that were visible by all cameras. The starting light was used as reference to set the time-stamp on the race analysis software. The videos were analysed by one expert evaluator, on an in-house customised software for race analysis in competitive swimming. The Intra-class Correlation Coefficient (ICC) was computed to verify the absolute agreement between repeated measures. A very-high agreement was obtained (ICC ranged between 0.989 and 0.999).
Starting parameters
head breaking out the water surface); (ix) break distance (the distance between the starting head-wall and the head water breakout). All distances were calibrated based on the pool’s marks (e.g., the 5-m and 15-m marks of the swim lanes). The parameters selected are often reported in the literature (e.g., Hubert, Silveira, Freitas, Pereira, & Roesler, 2006; Ruschel, Araùjo, Pereira, & Roesler, 2007; Vantorre et al., 2010).
Turning parameters
The following variables were measured: (i) total turning time (i.e., turn main outcome: the time lag between the 45-m mark and the 15-m mark of the following split); (ii) the 5 m-in time (the time lag between the 45-m mark and the touch on the wall); (iii) water break distance (the distance between the wall and the head breaking out the water surface); (iv) water break time (the time lag between the touch on the wall and the head water break); (v) 15-m out time (the time lag between the touch on the wall and the 15-m mark). All distances were calibrated based on the pool’s marks (e.g., the 5-m and 15-m marks of the swim lanes). These turning variables, are also noted by the literature on regular basis (Blanksby, Simpson, Elliott, & McElroy, 1998; Lyttle, Blanksby, Elliott, & Lloyd, 2000; Veiga & Roig, 2017).
Statistical analysis
Normality and homocedasticity assumptions were analysed by the Kolmogorov-Smirnov and Levene tests, respectively. The mean ± one standard deviation (SD), and the 95% of the confidence interval (95CI) were selected as descriptive statistics.
The stroke effect (i.e., variation in the performance of the start and turn across the four swimming events, in each sex), and the partial contribution effect (i.e., variation in the contribution of each start and turn parameter assessed to the final race time) were computed by one-way ANOVAs, and Bonferroni as post-hoc test (p ≤ 0.05). The eta square (η2) was selected as effect size index and interpreted as: (i) without effect if 0 < η2 ≤ 0.04; (ii) minimum/trivial if 0.04 < η2 ≤ 0.25; (iii) moderate if 0.25 < η2 ≤ 0.64 and; (iv) strong if η2>0.64 (Ferguson, 2009). Cohen’s d was also computed to assess the standard effect size in pairwise strokes, and interpreted as: (i) small/trivial if d ≤ 0.2; (ii) moderate if 0.8 ≥ d ≥ 0.2 and; (iii) large if d ≥ 0.8 (Cohen, 1988).
Results
Final race time
A significant and strong stroke effect was noted in the final race time in both sexes (males:
F = 540.35, p < 0.001, η2 = 0.98; females: F = 235.51, p < 0.001, η2 = 0.96) (Tables 1 and 3). Both sexes were faster in Freestyle, followed-up by Butterfly, Backstroke and Breaststroke (Table 1). The pairwise comparison showed significant differences (p ≤ 0.001) between all swimming strokes, in both sexes. The highest difference was noted between Freestyle and Breaststroke in male and female swimmers (males: d = 16.91, p < 0.001; females: d = 13.20,
SPOR
T
S
BIOMECHANICS
5
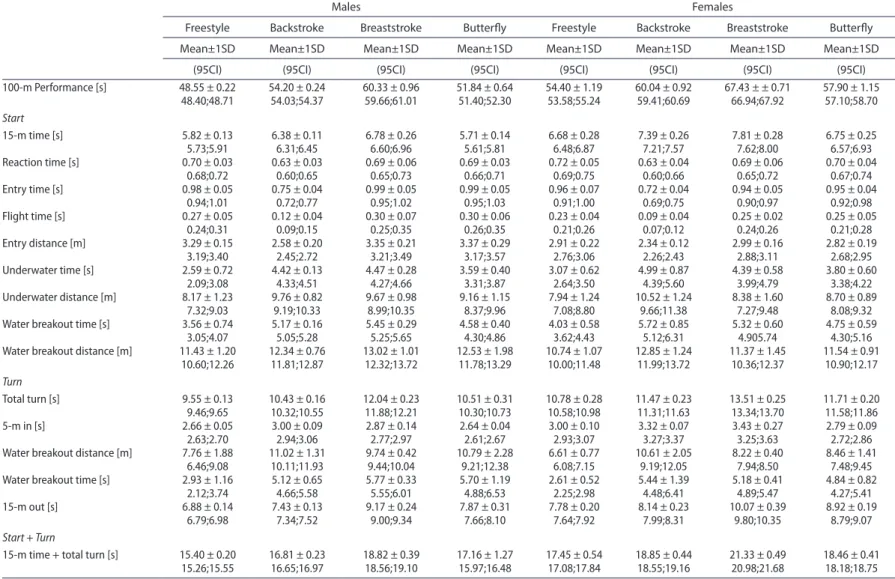
Table 1. Descriptive statistics of the final race time, start and turn parameters evaluated (mean±1SD, and 95% confidence interval).
Males Females
Freestyle Backstroke Breaststroke Butterfly Freestyle Backstroke Breaststroke Butterfly
Mean±1SD Mean±1SD Mean±1SD Mean±1SD Mean±1SD Mean±1SD Mean±1SD Mean±1SD
(95CI) (95CI) (95CI) (95CI) (95CI) (95CI) (95CI) (95CI)
100-m performance [s] 48.55 ± 0.22 54.20 ± 0.24 60.33 ± 0.96 51.84 ± 0.64 54.40 ± 1.19 60.04 ± 0.92 67.43 ± ± 0.71 57.90 ± 1.15
48.40;48.71 54.03;54.37 59.66;61.01 51.40;52.30 53.58;55.24 59.41;60.69 66.94;67.92 57.10;58.70
Start
15-m time [s] 5.82 ± 0.13 6.38 ± 0.11 6.78 ± 0.26 5.71 ± 0.14 6.68 ± 0.28 7.39 ± 0.26 7.81 ± 0.28 6.75 ± 0.25
5.73;5.91 6.31;6.45 6.60;6.96 5.61;5.81 6.48;6.87 7.21;7.57 7.62;8.00 6.57;6.93
reaction time [s] 0.70 ± 0.03 0.63 ± 0.03 0.69 ± 0.06 0.69 ± 0.03 0.72 ± 0.05 0.63 ± 0.04 0.69 ± 0.06 0.70 ± 0.04
0.68;0.72 0.60;0.65 0.65;0.73 0.66;0.71 0.69;0.75 0.60;0.66 0.65;0.72 0.67;0.74
entry time [s] 0.98 ± 0.05 0.75 ± 0.04 0.99 ± 0.05 0.99 ± 0.05 0.96 ± 0.07 0.72 ± 0.04 0.94 ± 0.05 0.95 ± 0.04
0.94;1.01 0.72;0.77 0.95;1.02 0.95;1.03 0.91;1.00 0.69;0.75 0.90;0.97 0.92;0.98
Flight time [s] 0.27 ± 0.05 0.12 ± 0.04 0.30 ± 0.07 0.30 ± 0.06 0.23 ± 0.04 0.09 ± 0.04 0.25 ± 0.02 0.25 ± 0.05
0.24;0.31 0.09;0.15 0.25;0.35 0.26;0.35 0.21;0.26 0.07;0.12 0.24;0.26 0.21;0.28
entry distance [m] 3.29 ± 0.15 2.58 ± 0.20 3.35 ± 0.21 3.37 ± 0.29 2.91 ± 0.22 2.34 ± 0.12 2.99 ± 0.16 2.82 ± 0.19
3.19;3.40 2.45;2.72 3.21;3.49 3.17;3.57 2.76;3.06 2.26;2.43 2.88;3.11 2.68;2.95
Underwater time [s] 2.59 ± 0.72 4.42 ± 0.13 4.47 ± 0.28 3.59 ± 0.40 3.07 ± 0.62 4.99 ± 0.87 4.39 ± 0.58 3.80 ± 0.60
2.09;3.08 4.33;4.51 4.27;4.66 3.31;3.87 2.64;3.50 4.39;5.60 3.99;4.79 3.38;4.22
Underwater distance [m] 8.17 ± 1.23 9.76 ± 0.82 9.67 ± 0.98 9.16 ± 1.15 7.94 ± 1.24 10.52 ± 1.24 8.38 ± 1.60 8.70 ± 0.89
7.32;9.03 9.19;10.33 8.99;10.35 8.37;9.96 7.08;8.80 9.66;11.38 7.27;9.48 8.08;9.32
Water breakout time [s] 3.56 ± 0.74 5.17 ± 0.16 5.45 ± 0.29 4.58 ± 0.40 4.03 ± 0.58 5.72 ± 0.85 5.32 ± 0.60 4.75 ± 0.59
3.05;4.07 5.05;5.28 5.25;5.65 4.30;4.86 3.62;4.43 5.12;6.31 4.905.74 4.30;5.16
Water breakout distance [m] 11.43 ± 1.20 12.34 ± 0.76 13.02 ± 1.01 12.53 ± 1.98 10.74 ± 1.07 12.85 ± 1.24 11.37 ± 1.45 11.54 ± 0.91
10.60;12.26 11.81;12.87 12.32;13.72 11.78;13.29 10.00;11.48 11.99;13.72 10.36;12.37 10.90;12.17
Turn
total turn [s] 9.55 ± 0.13 10.43 ± 0.16 12.04 ± 0.23 10.51 ± 0.31 10.78 ± 0.28 11.47 ± 0.23 13.51 ± 0.25 11.71 ± 0.20
9.46;9.65 10.32;10.55 11.88;12.21 10.30;10.73 10.58;10.98 11.31;11.63 13.34;13.70 11.58;11.86
5-m in [s] 2.66 ± 0.05 3.00 ± 0.09 2.87 ± 0.14 2.64 ± 0.04 3.00 ± 0.10 3.32 ± 0.07 3.43 ± 0.27 2.79 ± 0.09
2.63;2.70 2.94;3.06 2.77;2.97 2.61;2.67 2.93;3.07 3.27;3.37 3.25;3.63 2.72;2.86
Water breakout distance [m] 7.76 ± 1.88 11.02 ± 1.31 9.74 ± 0.42 10.79 ± 2.28 6.61 ± 0.77 10.61 ± 2.05 8.22 ± 0.40 8.46 ± 1.41
6.46;9.08 10.11;11.93 9.44;10.04 9.21;12.38 6.08;7.15 9.19;12.05 7.94;8.50 7.48;9.45
Water breakout time [s] 2.93 ± 1.16 5.12 ± 0.65 5.77 ± 0.33 5.70 ± 1.19 2.61 ± 0.52 5.44 ± 1.39 5.18 ± 0.41 4.84 ± 0.82
2.12;3.74 4.66;5.58 5.55;6.01 4.88;6.53 2.25;2.98 4.48;6.41 4.89;5.47 4.27;5.41
15-m out [s] 6.88 ± 0.14 7.43 ± 0.13 9.17 ± 0.24 7.87 ± 0.31 7.78 ± 0.20 8.14 ± 0.23 10.07 ± 0.39 8.92 ± 0.19
6.79;6.98 7.34;7.52 9.00;9.34 7.66;8.10 7.64;7.92 7.99;8.31 9.80;10.35 8.79;9.07
Start + Turn
15-m time + total turn [s] 15.40 ± 0.20 16.81 ± 0.23 18.82 ± 0.39 17.16 ± 1.27 17.45 ± 0.54 18.85 ± 0.44 21.33 ± 0.49 18.46 ± 0.41
Starting performance
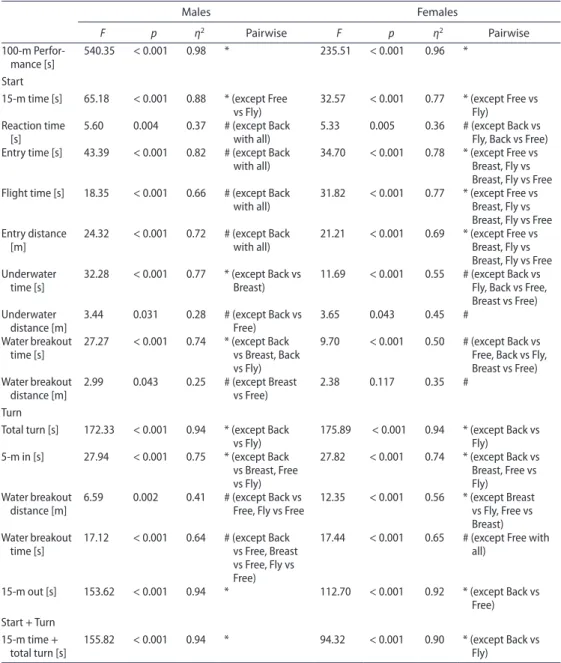
The 15-m time (the main outcome) showed a significant and strong stroke effect in male and female swimmers (males: F = 65.18, p < 0.001, η2 = 0.88; females: F = 32.57, p < 0.001,
η2 = 0.77) (Table 3). A non-significant difference was observed only between Freestyle and Butterfly in both sexes (p = 1.000) (Table 3). Male swimmers spent less time covering the 15-m in Butterfly, and females spent less time covering the 15-m in Freestyle (Table 1). The 15-m time showed a significant and moderate contribution effect in males (F = 15.57,
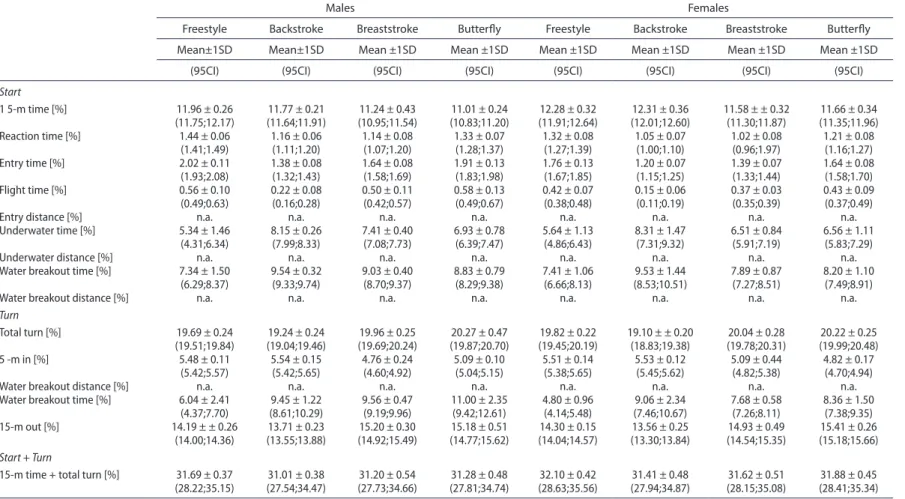
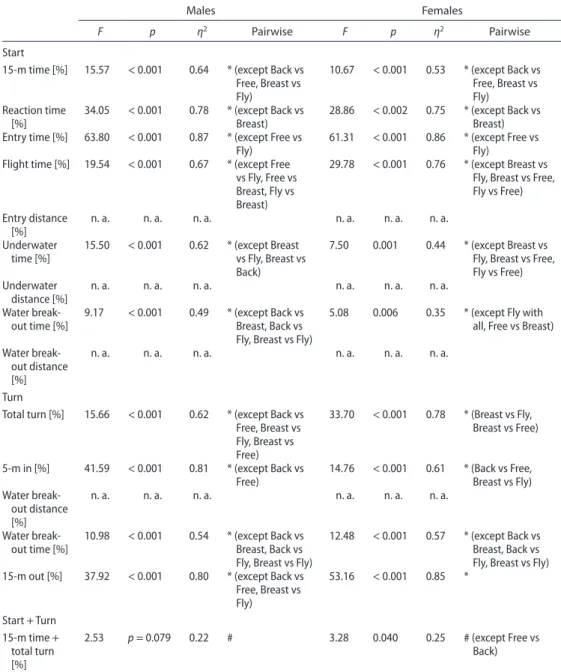
p < 0.001, η2 = 0.64), and females (F = 10.67, p < 0.001, η2 = 0.53) (Table 4). The partial contribution for the final race time, was higher in the Freestyle event for male finalists (11.96 ± 0.26%, 95CI: 11.75;12.17), and in Backstroke for female counterparts (12.31%, 95CI: 12.01;12.60) (Table 2).
For males, the remaining starting variables presented significant and moderate-strong stroke effects (Table 3: 2.99 ≤ F ≤ 43.39; 0.04 ≤ p < 0.001; 0.25 ≤ η2 ≤ 0.82). The block time, entry time, flight time and entry distance differ significantly (p < 0.05) between Backstroke and all of the remaining ones. Non-significant differences were observed between the remaining swimming strokes, in these parameters (Table 3). The underwater distance, and the water breakout distance also did not present significant differences (Table 3). On the other hand, the underwater time, and the water breakout time presented significant differ-ences between them (underwater time: 2.72 ≤ d ≤ 3.44, 0.005 ≤ p < 0.001; water breakout time: 2.44 ≤ d ≤ 3.36, 0.004 ≤ p < 0.001).
Regarding the stroke effect, females also showed variations in all parameters except in the water breakout distance (Table 3: F = 2.38; p = 0.117; η2 = 0.35). Pairwise compari-sons returned non-significant differences (p > 0.05) in the block time, underwater time, water breakout time (except Backstroke vs. Butterfly and Freestyle, and Breaststroke vs. Freestyle), and water breakout distance. Significant differences were found for entry time (4.20 ≤ d ≤ 4.85, p < 0.001), flight time (3.50 ≤ d ≤ 3.53, p < 0.001), and entry distance (2.91 ≤ d ≤ 4.59, p < 0.001).
Turning performance
The total turn (the main outcome) showed a significant and strong stroke effect in males (F = 172.33, p < 0.001, η2 = 0.94) and females (F = 175.89, p < 0.001, η2 = 0.94) (Table
3). Pairwise comparison showed that the only exception (no differences) was between Backstroke and Butterfly, in both sexes (Table 3). Both male and female swimmers were faster performing the total turn in Freestyle (males: 9.55 ± 0.13s; 95CI: 9.65; 9.46; females: 10.78 ± 0.28s; 95CI: 10.98;10.58) (Table 1). The contribution effect was significant and moderate in males (F = 15.66, p < 0.001, η2 = 0.62), and significant and strong in females (F = 33.70, p < 0.001, η2 = 0.78) (Table 4). The total turn showed a higher partial contribu-tion in the Butterfly event in both sexes (males: 20.27 ± 0.47%, 95CI: 19.87; 20.70; females: 20.22 ± 0.25%, 95CI: 19.99;20.48).
SPOR
T
S
BIOMECHANICS
7
Table 2. partial contribution (mean ±1SD and 95% confidence interval) by the start, turn and the start plus turn (i.e., the overall start time—‘15-m time’, and the overall turn time—‘total turn’) to the 100-m performance. n.a.—it does not apply.
Males Females
Freestyle Backstroke Breaststroke Butterfly Freestyle Backstroke Breaststroke Butterfly
Mean±1SD Mean±1SD Mean ±1SD Mean ±1SD Mean ±1SD Mean ±1SD Mean ±1SD Mean ±1SD
(95CI) (95CI) (95CI) (95CI) (95CI) (95CI) (95CI) (95CI)
Start
1 5-m time [%] 11.96 ± 0.26 11.77 ± 0.21 11.24 ± 0.43 11.01 ± 0.24 12.28 ± 0.32 12.31 ± 0.36 11.58 ± ± 0.32 11.66 ± 0.34
(11.75;12.17) (11.64;11.91) (10.95;11.54) (10.83;11.20) (11.91;12.64) (12.01;12.60) (11.30;11.87) (11.35;11.96)
reaction time [%] 1.44 ± 0.06 1.16 ± 0.06 1.14 ± 0.08 1.33 ± 0.07 1.32 ± 0.08 1.05 ± 0.07 1.02 ± 0.08 1.21 ± 0.08
(1.41;1.49) (1.11;1.20) (1.07;1.20) (1.28;1.37) (1.27;1.39) (1.00;1.10) (0.96;1.97) (1.16;1.27)
entry time [%] 2.02 ± 0.11 1.38 ± 0.08 1.64 ± 0.08 1.91 ± 0.13 1.76 ± 0.13 1.20 ± 0.07 1.39 ± 0.07 1.64 ± 0.08
(1.93;2.08) (1.32;1.43) (1.58;1.69) (1.83;1.98) (1.67;1.85) (1.15;1.25) (1.33;1.44) (1.58;1.70)
Flight time [%] 0.56 ± 0.10 0.22 ± 0.08 0.50 ± 0.11 0.58 ± 0.13 0.42 ± 0.07 0.15 ± 0.06 0.37 ± 0.03 0.43 ± 0.09
(0.49;0.63) (0.16;0.28) (0.42;0.57) (0.49;0.67) (0.38;0.48) (0.11;0.19) (0.35;0.39) (0.37;0.49)
entry distance [%] n.a. n.a. n.a. n.a. n.a. n.a. n.a. n.a.
Underwater time [%] 5.34 ± 1.46 8.15 ± 0.26 7.41 ± 0.40 6.93 ± 0.78 5.64 ± 1.13 8.31 ± 1.47 6.51 ± 0.84 6.56 ± 1.11
(4.31;6.34) (7.99;8.33) (7.08;7.73) (6.39;7.47) (4.86;6.43) (7.31;9.32) (5.91;7.19) (5.83;7.29)
Underwater distance [%] n.a. n.a. n.a. n.a. n.a. n.a. n.a. n.a.
Water breakout time [%] 7.34 ± 1.50 9.54 ± 0.32 9.03 ± 0.40 8.83 ± 0.79 7.41 ± 1.06 9.53 ± 1.44 7.89 ± 0.87 8.20 ± 1.10
(6.29;8.37) (9.33;9.74) (8.70;9.37) (8.29;9.38) (6.66;8.13) (8.53;10.51) (7.27;8.51) (7.49;8.91)
Water breakout distance [%] n.a. n.a. n.a. n.a. n.a. n.a. n.a. n.a.
Turn
total turn [%] 19.69 ± 0.24 19.24 ± 0.24 19.96 ± 0.25 20.27 ± 0.47 19.82 ± 0.22 19.10 ± ± 0.20 20.04 ± 0.28 20.22 ± 0.25
(19.51;19.84) (19.04;19.46) (19.69;20.24) (19.87;20.70) (19.45;20.19) (18.83;19.38) (19.78;20.31) (19.99;20.48)
5 -m in [%] 5.48 ± 0.11 5.54 ± 0.15 4.76 ± 0.24 5.09 ± 0.10 5.51 ± 0.14 5.53 ± 0.12 5.09 ± 0.44 4.82 ± 0.17
(5.42;5.57) (5.42;5.65) (4.60;4.92) (5.04;5.15) (5.38;5.65) (5.45;5.62) (4.82;5.38) (4.70;4.94)
Water breakout distance [%] n.a. n.a. n.a. n.a. n.a. n.a. n.a. n.a.
Water breakout time [%] 6.04 ± 2.41 9.45 ± 1.22 9.56 ± 0.47 11.00 ± 2.35 4.80 ± 0.96 9.06 ± 2.34 7.68 ± 0.58 8.36 ± 1.50
(4.37;7.70) (8.61;10.29) (9.19;9.96) (9.42;12.61) (4.14;5.48) (7.46;10.67) (7.26;8.11) (7.38;9.35)
15-m out [%] 14.19 ± ± 0.26 13.71 ± 0.23 15.20 ± 0.30 15.18 ± 0.51 14.30 ± 0.15 13.56 ± 0.25 14.93 ± 0.49 15.41 ± 0.26
(14.00;14.36) (13.55;13.88) (14.92;15.49) (14.77;15.62) (14.04;14.57) (13.30;13.84) (14.54;15.35) (15.18;15.66)
Start + Turn
distance, and in the water breakout time (with few exceptions between events; Table 3). Overall, female swimmers did show significant differences in the 15-m out between events (3.61 ≤ d ≤ 7.19, p < 0.001), except in Freestyle vs. Backstroke. Same trend was noted in remaining turning parameters, and non-significant differences were only observed in the water breakout time (Table 3).
Table 3. analysis of the stroke effect in males and females finalists.
notes: Free—Freestyle; Fly—Butterfly; Back—Backstroke; Breast—Breaststroke.
*—significant differences between all four swimming strokes (p < 0.05); #—non-significant differences between all four
swimming strokes (p≥ 0.05).
Males Females
F p η2 Pairwise F p η2 Pairwise
100-m perfor-mance [s]
540.35 < 0.001 0.98 * 235.51 < 0.001 0.96 * Start
15-m time [s] 65.18 < 0.001 0.88 * (except Free vs Fly)
32.57 < 0.001 0.77 * (except Free vs Fly)
reaction time [s]
5.60 0.004 0.37 # (except Back with all)
5.33 0.005 0.36 # (except Back vs Fly, Back vs Free) entry time [s] 43.39 < 0.001 0.82 # (except Back
with all)
34.70 < 0.001 0.78 * (except Free vs Breast, Fly vs Breast, Fly vs Free Flight time [s] 18.35 < 0.001 0.66 # (except Back
with all)
31.82 < 0.001 0.77 * (except Free vs Breast, Fly vs Breast, Fly vs Free entry distance
[m]
24.32 < 0.001 0.72 # (except Back with all)
21.21 < 0.001 0.69 * (except Free vs Breast, Fly vs Breast, Fly vs Free Underwater
time [s]
32.28 < 0.001 0.77 * (except Back vs Breast)
11.69 < 0.001 0.55 # (except Back vs Fly, Back vs Free, Breast vs Free) Underwater
distance [m]
3.44 0.031 0.28 # (except Back vs Free)
3.65 0.043 0.45 # Water breakout
time [s]
27.27 < 0.001 0.74 * (except Back vs Breast, Back vs Fly)
9.70 < 0.001 0.50 # (except Back vs Free, Back vs Fly, Breast vs Free) Water breakout
distance [m]
2.99 0.043 0.25 # (except Breast vs Free)
2.38 0.117 0.35 # turn
total turn [s] 172.33 < 0.001 0.94 * (except Back vs Fly)
175.89 < 0.001 0.94 * (except Back vs Fly)
5-m in [s] 27.94 < 0.001 0.75 * (except Back vs Breast, Free vs Fly)
27.82 < 0.001 0.74 * (except Back vs Breast, Free vs Fly)
Water breakout distance [m]
6.59 0.002 0.41 # (except Back vs Free, Fly vs Free
12.35 < 0.001 0.56 * (except Breast vs Fly, Free vs Breast) Water breakout
time [s]
17.12 < 0.001 0.64 # (except Back vs Free, Breast vs Free, Fly vs Free)
17.44 < 0.001 0.65 # (except Free with all)
15-m out [s] 153.62 < 0.001 0.94 * 112.70 < 0.001 0.92 * (except Back vs Free) Start + turn
15-m time + total turn [s]
SPORTS BIOMECHANICS 9
The partial contribution in males ranged between 4.76 ± 0.24% (95CI: 4.60;4.92) for the 5-m and 15.20 ± 0.30% (95CI: 14.92;15.49) for the 15-m out in Breaststroke. In female swimmers, it ranged between 4.80 ± 0.96% (95CI: 4.14;5.48) for the water break time in Freestyle and 15.41 ± 0.26% (95CI: 15.18;15.66) for the 15-m out in Butterfly.
Table 4. analysis of the partial contribution effect, by the start and turn to the 100-m final race time, in males and females finalists.
notes: Free—Freestyle; Fly—Butterfly; Back—Backstroke; Breast—Breaststroke.
*—significant differences between all four swimming strokes (p < 0.05); #—non-significant differences between all four
swimming strokes (p≥ 0.05).
Males Females
F p η2 Pairwise F p η2 Pairwise
Start
15-m time [%] 15.57 < 0.001 0.64 * (except Back vs Free, Breast vs Fly)
10.67 < 0.001 0.53 * (except Back vs Free, Breast vs Fly)
reaction time [%]
34.05 < 0.001 0.78 * (except Back vs Breast)
28.86 < 0.002 0.75 * (except Back vs Breast) entry time [%] 63.80 < 0.001 0.87 * (except Free vs
Fly)
61.31 < 0.001 0.86 * (except Free vs Fly)
Flight time [%] 19.54 < 0.001 0.67 * (except Free vs Fly, Free vs Breast, Fly vs Breast)
29.78 < 0.001 0.76 * (except Breast vs Fly, Breast vs Free, Fly vs Free) entry distance
[%]
n. a. n. a. n. a. n. a. n. a. n. a. Underwater
time [%]
15.50 < 0.001 0.62 * (except Breast vs Fly, Breast vs Back)
7.50 0.001 0.44 * (except Breast vs Fly, Breast vs Free, Fly vs Free) Underwater
distance [%]
n. a. n. a. n. a. n. a. n. a. n. a. Water
break-out time [%]
9.17 < 0.001 0.49 * (except Back vs Breast, Back vs Fly, Breast vs Fly)
5.08 0.006 0.35 * (except Fly with all, Free vs Breast) Water
break-out distance [%]
n. a. n. a. n. a. n. a. n. a. n. a.
turn
total turn [%] 15.66 < 0.001 0.62 * (except Back vs Free, Breast vs Fly, Breast vs Free)
33.70 < 0.001 0.78 * (Breast vs Fly, Breast vs Free)
5-m in [%] 41.59 < 0.001 0.81 * (except Back vs Free)
14.76 < 0.001 0.61 * (Back vs Free, Breast vs Fly) Water
break-out distance [%]
n. a. n. a. n. a. n. a. n. a. n. a.
Water break-out time [%]
10.98 < 0.001 0.54 * (except Back vs Breast, Back vs Fly, Breast vs Fly)
12.48 < 0.001 0.57 * (except Back vs Breast, Back vs Fly, Breast vs Fly) 15-m out [%] 37.92 < 0.001 0.80 * (except Back vs
Free, Breast vs Fly)
53.16 < 0.001 0.85 *
Start + turn 15-m time +
total turn [%]
Contribution of start plus turn to final race time
The start time plus total turn time showed a significant and strong effect in the final race time (males: F = 155.82; p < 0.001; η2 = 0.94; females: F = 94.32; p < 0.001; η2 = 0.90). For both male and female swimmers, the pairwise comparison showed significant differences between all four swimming strokes (except for the females between Backstroke vs. Butterfly) (males: 1.88 ≤ d ≤ 11.03, 0.006 ≤ p < 0.001; females: 2.06 ≤ d ≤ 7.36, p ≤ 0.001). As noted earlier, the sum of starting and turning performances effects is dependent on the event to be swam.
The contribution effect showed non-significant (with minimum variations) between the swimming strokes (Table 4). The contribution was higher in the Freestyle event for both sexes (males: 31.69 ± 0.37%, 95CI: 28.22;35.15; females: 32.10 ± 0.42%, 95CI: 28,63;35.56) (Table 2); whereas, the lower was also in Backstroke for both sexes (males: 31.01 ± 0.38%, 95CI: 27.54;34.47; females: 31.41 ± 0.48%, 95CI: 27.94;34.87) (Table 2). This points out that, despite the swim event, the contribution of the start plus the turn is still a key-factor.
Discussion and Implications
The main aim of this study was to examine the starting and turning performances of elite swimmers, racing the final of the 100-m events at a major swimming competition. There was an overall significant stroke effect in the starting and turning performances in both male and female swimmers. The start and the turn phases combined accounted for 31–32% of the final race time, and non-significant differences were observed between swimming strokes.
Starting performance
A stroke effect was noted in both sexes in the final race time, starting and turning perfor-mances. One can find a solid body of knowledge on the differences in the final race time between swimming strokes (e.g., Arellano et al., 1994; Chatard, Girold, Caudal, Cossor & Mason, 2003; Jesus et al., 2011; Wakayoshi et al., 1992). However, evidence on differences in start and turning performances in the four events are scarce (e.g., Mason & Cossor,
SPORTS BIOMECHANICS 11
the underwater technique is the same for Freestyle and Butterfly). Therefore, swimmers choose to stay underwater while their underwater speed is higher (due to the wall push-off) in comparison to the swim speed of the stroke being swam. In Freestyle, as the swim speed is higher than in Butterfly, swimmers choose to breakout sooner in this stroke (same rationality for Backstroke). In Butterfly events, they choose to optimise their underwater distance until almost the 15-m mark, because the swim speed is lower (Tor, Pease, & Ball,
2014). In Breaststroke events, rules only allow to perform one full underwater stroke added to a dolphin kick. Breaststrokers, therefore, try to optimise the streamline glide and kick-ing. In Breaststroke swimmers perform two glides. One is a streamlined glide having the upper limbs together and stretched tightly overhead and a second glide keeping the upper limbs extended at the side of the trunk. Between these glides the swimmer performs an underwater arms’ stroke. Studies reported differences in the passive drag gliding in the two different positions noted earlier (Marinho et al., 2009; Vilas-Boas et al., 2010). Because the Breaststroke start is restricted to one single underwater stroke, swimmers do try to optimise their underwater distance breakout by decreasing the passive drag (Marinho et al., 2009; Naemi, Easson, & Sanders, 2010; Vilas-Boas et al., 2010) and/or enhancing the water entry (Tor et al., 2015). Overall, in the starting parameters, a significant stroke effect was observed, mostly between Backstroke and the remaining swimming strokes. These differences can be related to the specificity of the back start, that is the only where the swimmer starts in the water, reducing mostly the flight time, entry time and entry distance (Barkwell & Dickey,
2017; de Jesus et al., 2013).
Turning performance
A significant and moderate-strong stroke effect was observed in the turning performance (Table 3). As in the total turn time (i.e., the main outcome), only the 15-m out presented a similar trend, being male and female swimmers faster in Freestyle, followed-up by Backstroke, Butterfly and Breaststroke, respectively (Table 1). Therefore, the 15-m out might be the key-parameter determining the overall turning performance. In Freestyle and Backstroke events, swimmers perform the flip turn. This turn is understood to be faster than the open turn used in Butterfly and Breaststroke events (Lyttle & Mason, 1997). As in for the start, both male and female swimmers did breakout the water sooner in Freestyle (males: 7.76 ± 1.88-m; females: 6.61 ± 0.77-m), and as such resuming the swim stroke also sooner. These results are in tandem to reports by Veiga & Roig (2016, 2017; Veiga et al.,
2016). Regarding Breaststroke, this is the swim stroke where swimmers (males and females) are slower at the 15-m out and show the shortest underwater breakout distance (except Freestyle in both sexes). Because of the rules constraints, swimmers are advised to adopt the most streamlined position as they can in this first gliding position (i.e., arms extended at the front) (Marinho, Barbosa, Rouboa, & Silva, 2011; Vilas-Boas et al., 2010).
Contribution of start plus turn to final race time
(15-m time) accounts with 11–12% of the final race time, whereas the turning 19–20%. Hence, the start and the turn combined account to a total of 31–32% of the time (i.e., nearly one third of a 100-m race time). Studies reported the parameters that swimmers should consider to enhance their on-block (Fischer & Kibele, 2016; Tor et al., 2015; Vantorre et al.,
2010) and in-water back start (de Jesus et al., 2013; Takeda, Itoi, Takagi, & Tsubakimoto,
2014). The time at the 15-m mark (main outcome) depends significantly from the take-off velocity, entry angle, underwater time and distance (Fischer & Kibele, 2016; Vantorre, Chollet, & Seifert, 2014). This is, from the block phase, flight phase and underwater phase. In the turn, the push-off time and peak force on the wall performing the flip turn (Lyttle et al., 1999), and the wall contact time (hands and feet) and a quick pull-out in the open turn (Tourny-Chollet, Chollet, Hogie, & Papparodopoulos, 2002), are the key determinants. A significant and moderate-strong contribution effect (Table 4) was noted for the start and turn parameters. However, the contribution of the start plus the turn combined presented a similar effect in all four events (non-significant differences). Females showed a signifi-cant contribution effect between strokes (p = 0.043), but this was trivial (η2 = 0.25; signifi-cant differences were only noted between Freestyle and Backstroke). Altogether, Freestyle (males: 31.69%; females: 32.10%) and Butterfly (males: 31.28%; females: 31.88%) events presented the highest dependency from the start plus turn performances combined (Table
2). Therefore, it seems that the amount of time spent training starts and turns, especially in these two events, is of extreme importance.
Coaches should be advised to design and prescribe high-quality drills and training tasks to improve the start and turn performances. For instance, proposing analytical drills or, alternatively over a regular swim training set deliver cues on what are the key-aspects of the start and/or turn that the swimmer is expect to deliver (Veiga & Roig, 2017). For example, noting that over the set the swimmer can only breakout after reaching a given distance, or performing a given number of dolphin kicks. The latter alternative allows a more holistic practice and some better understanding how different start/turn strategies may affect the swim stroke (e.g., arm stroke count, stroke cadence, etc.).
Conclusion
Altogether, in elite sprinters, start and turn performances play major roles in the final race performance, and can account up to one third of the final race time. The effect of the start and turn combined were similar in all four swimming strokes. Both male and female swimmers, adopt different start and turn strategies, depending on the event to be raced.
Acknowledgments
To LEN (Ligue Européenne de Natation) and Spiideo AB for providing the videos. We would like to thank the support of the University of Beira Interior and Santander Universities (Bolsa BIPD/ICI-FCSH-Santander Universidades-UBI/2017).
Disclosure statement
SPORTS BIOMECHANICS 13
Funding
This work was supported by National Funds through FCT – Portuguese Foundation for Science and Technology [UID/DTP/04045/2013] – and the European Fund for regional devel-opment (FEDER) allocated by European Union through the COMPETE 2020 Programme [POCI-01-0145-FEDER-006969].
References
Arellano, R., Brown, P., Cappaert, J., & Nelson, R. (1994). Analysis of 50, 100, and 200 m freestyle swimmers at the 1992 Olympic Games. Journal of Applied Biomechanics,10, 189–199. doi:10.1123/ jab.10.2.189
Arellano, R., García, F., Gavilán, A., & Pardillo, S. (1996). Temporal analysis of the starting technique in freestyle swimming. In J. M. C. S. Abrantes (Ed.), XIV international symposium on biomechanics in sports (pp. 289–292). Lisboa: Faculdade de Motricidade Humana da Universidade Técnica de Lisboa.
Barbosa, T. M., Bragada, J. A., Reis, V. M., Marinho, D. A., & Silva, A. J. (2010). Energetics and biomechanics as determining factors of swimming performance: Updating the state of the art.
Journal of Science and Medicine in Sport,13, 262–269. doi:10.1016/j.jsams.2009.01.003
Barkwell, G. E., & Dickey, J. P. (2017). Backstroke start performance: The impact of using the OmegaOBL2 backstroke ledge. Sports Biomechanics, Epub ahead of print.
Blanksby, B., Nicholson, L., & Elliott, B. (2002). Biomechanical analysis of the grab, track
and handle swimming starts: An intervention study. Sports Biomechanics, 1, 11–24.
doi:10.1080/14763140208522784
Blanksby, B. A., Simpson, J. R., Elliott, B. C., & McElroy, K. (1998). Biomechanical factors influencing breaststroke turns by age-group swimmers. Journal of Applied Biomechanics, 14, 180–189. doi:10.1123/jab.14.2.180
Chatard, J., Girold, S., Caudal, N., Cossor, J. M., & Mason, B. (2003). Analysis of the 200 m events in the Sydney Olympic Games. In J. Chatard (Ed.), Biomechanics and medicine in swimming IX (pp. 261–264). Saint-Etienne: Université de Saint-Etienne.
Cohen, J. (1988). Statistical power analysis for the behavioral sciences. Hillsdale, NJ: Lawrence Earlbaum Associates.
Cossor, J. M., & Mason, B. R. (2001). Swim start performances at the Sydney 2000 Olympic Games. In J. Blackwell & R. H. Sanders (Eds.), Proceedings of swim sessions: XIX international symposium on biomechanics in sports (pp. 70–74). San Francisco, CA: International Society of Biomechanics in Sports.
Craig, A. B., & Pendergast, D. R. (1979). Relationships of stroke rate, distance per stroke, and velocity in competitive swimming. Medicine and Science in Sports,11, 278–283.
de Jesus, K., de Jesus, K., Figueiredo, P., Gonçalves, P., Pereira, S. M., Vilas-Boas, J. P., & Fernandes, R. J. (2013). Backstroke start kinematic and kinetic changes due to different feet positioning. Journal of Sports Sciences,31, 1665–1675. doi:10.1080/02640414.2013.794298
Ferguson, C. J. (2009). An effect size primer: A guide for clinicians and researchers. Professional Psychology: Research and Practice,40, 532–538. doi:10.1037/a0015808
Fischer, S., & Kibele, A. (2016). The biomechanical structure of swim start performance. Sports Biomechanics,15, 397–408. doi:10.1080/14763141.2016.1171893
Guimarães, A. C., & Hay, J. G. (1985). A mechanical analysis of the grab starting technique in swimming. International Journal of Sport Biomechanics,1, 25–35. doi:10.1123/ijsb.1.1.25
Hellard, P., Dekerle, J., Avalos, M., Caudal, N., Knopp, M., & Hausswirth, C. (2008). Kinematic measures and stroke rate variability in elite female 200-m swimmers in the four swimming techniques: Athens 2004 Olympic finalists and French National 2004 championship semi-finalists. Journal of Sports Sciences,26, 35–46. doi:10.1080/02640410701332515
Jesus, S., Costa, M. J., Marinho, D. A., Garrido, N., Silva, A. J., & Barbosa, T. M. (2011). 13th FINA World Championship finals: Stroke kinematical and race times according to performance, gender and event. Portuguese Journal of Sport Sciences,11, 275–278.
Lyttle, A. D., Blanksby, B. A., Elliott, B. C., & Lloyd, D. G. (1999). Investigating kinetics in the freestyle flip turn push-off. Journal of Applied Biomechanics,15, 242–252. doi:10.1123/jab.15.3.242
Lyttle, A. D., Blanksby, B. A., Elliott, B. C., & Lloyd, D. G. (2000). Net forces during tethered simulation of underwater streamlined gliding and kicking techniques of the freestyle turn. Journal of Sports Sciences,18, 801–807. doi:10.1080/026404100419856
Lyttle, A. D., & Mason, B. A. (1997). Kinematic and kinetic analysis of the freestyle and butterfly turns. Journal of Swimming Research,12, 7–11.
Marinho, D. A., Barbosa, T. M., Rouboa, A. I., & Silva, A. J. (2011). The hydrodynamic study of the swimming gliding: A two-dimensional computational fluis dynamics (CFD) analysis. Journal of Human Kinetics,29, 49–57.
Marinho, D. A., Reis, V. M., Alves, F. B., Vilas-Boas, J. P., Machado, L., Silva, A. J., & Rouboa, A. (2009). Hydrodynamic drag during gliding in swimming. Journal of Applied Biomechanics,25, 253–257. doi:10.1123/jab.25.3.253
Mason, B. R., & Cossor, J. M. (2001). Swim turn performances at the Sydney 2000 Olympic Games. In J. Blackwell & R. H. Sanders (Eds.), Proceedings of swim sessions: XIX international symposium on biomechanics in sports (pp. 65–69). San Francisco, CA: International Society of Biomechanics in Sports.
Naemi, R., Easson, W. J., & Sanders, R. H. (2010). Hydrodynamic glide efficiency in swimming. Journal of Science and Medicine in Sport,13, 444–451. doi:10.1016/j.jsams.2009.04.009
Pereira, S. M., Ruschel, C., Hubert, M., Machado, L., Roesler, H., Fernandes, R. J., & Vilas-Boas, J. P. (2015). Kinematic, kinetic and EMG analysis of four front crawl flip turn techniques. Journal of Sports Sciences,33, 2006–2015. doi:10.1080/02640414.2015.1026374
Ruschel, C., Araùjo, L., Pereira, S., & Roesler, H. (2007). Kinematical analysis of the swimming start: Block, flight and underwater phases. International Society of Biomechanics in Swimming Conference Proceedings, 385–388.
Slawson, S., Conway, P., Jusham, L., Le Sage, T., & West, A. (2010). Dynamic signature for tumble turn performance in swimming. Procedia Engineering,2, 3391–3396. doi:10.1016/j.proeng.2010.04.163
Takeda, T., Itoi, O., Takagi, H., & Tsubakimoto, S. (2014). Kinematic analysis of the backstroke start: Differences between backstroke specialists and non-specialists. Journal of Sports Sciences, 32, 635–641. doi:10.1080/02640414.2013.845678
Tor, E., Pease, D. L., & Ball, K. A. (2014). Characteristics of an elite swimming start. In B. Mason (Ed.), XIIth international symposium for biomechanics and medicine in swimming (pp. 257–263). Canberra: Canberra Australian Institute of Sport.
Tourny-Chollet, C., Chollet, D., Hogie, S., & Papparodopoulos, C. (2002). Kinematic analysis of butterfly turns of international and national swimmers. Journal of Sports Sciences,20, 383–390.
10.1080/026404102317366636
Tor, E., Pease, D. L., & Ball, K. A. (2015). Key parameters of the swimming start and their relationship to start performance. Journal of Sports Sciences,33, 1313–1321. doi:10.1080/02640414.2014.990486
Vantorre, J., Seifert, L., Fernandes, R. J., Vilas-Boas, J. P., & Chollet, D. (2010). Kinematical profiling of the front crawl start. International Journal of Sports Medicine,31, 16–21. doi:10.1055/s-0029-1241208
Vantorre, J., Chollet, D., & Seifert, L. (2014). Biomechanical analysis of the swim-start: A review.
Journal of Sports and Science in Medicine,13, 223–231.
Veiga, S., & Roig, A. (2016). Underwater and surface strategies of 200 m world level swimmers. Journal of Sports Sciences,34, 766–771. doi:10.1080/02640414.2015.1069382
Veiga, S., & Roig, A. (2017). Effect of the starting and turning performances on the subsequent swimming parameters of elite swimmers. Sports Biomechanics,16, 34–44. doi:10.1080/1476314 1.2016.1179782
SPORTS BIOMECHANICS 15
Vilas-Boas, J. P., Costa, L., Fernandes, R. J., Ribeiro, J., Figueiredo, P., Marinho, D. A., … Machado, L. (2010). Determination of the drag coefficient during the first and second gliding positions of the breaststroke underwater stroke. Journal of Applied Biomechanics,26, 324–331. doi:10.1123/ jab.26.3.324