2017
UNIVERSIDADE DE LISBOA
FACULDADE DE CIÊNCIAS
DEPARTAMENTO DE BIOLOGIA ANIMAL
High unexpected genetic diversity of a narrow endemic
terrestrial mollusc
Pedro Madeira
Mestrado em Biologia Evolutiva e do Desenvolvimento
Dissertação orientada por:
Professora Doutora Rita Castilho
Professora Doutora Maria Manuela Coelho
Preliminary Note
This Dissertation is presented including a scientific manuscript (chapter 2), enclosed by a general introduction (chapter 1) and final remarks (chapter 3), that has been submitted for publication in a scientific journal of the specialty, and follows the redaction rules of a standard journal.
iii
Agradecimentos
A realização deste trabalho nunca teria sido possível sem o apoio das seguintes pessoas:
Professora Doutora Rita Castilho, que ao longo dos últimos anos se tem sempre disponibilizado para ser minha orientadora, contribuindo para o enriquecimento da minha formação pessoal e no mundo científico, incutindo sempre noções de responsabilidade e autonomia e guiando-me sempre que necessário na obtenção dos conhecimentos necessários à realização deste projeto. Um sincero agradecimento por exigir sempre o melhor possível de mim, pela compreensão e por nunca ter desistido de me empurrar para concluir o trabalho, e pelo apoio valioso que me deu para continuar a trabalhar depois de cada obstáculo. Nunca esqueceri todas as oportunidades que me proporcionou.
Professor Gonçalo Calado, que motivou este tema, recolheu e enviou as amostras que deram origem a este projeto e que me guiou pelo Vale da Couda, mostrando-me o local onde esta espécie habita e ensinando-me a fazer amostragem de caracóis terrestres.
Professor Francisco Moreira, pela cedência das coordenadas geográficas dos locais de amostragem e pelo que também me ensinou durante a saída de campo para amostragem deste caracol.
David e Geraldine Holyoak, por se disponibilizarem para auxiliar com a identificação morfológica de várias amostras utilizadas neste trabalho e por enviarem amostras de espécies que de outra forma não teria conseguido obter.
Doutora Regina Cunha, pela ajuda com o tratamento dos dados relativos à filogenia.
Doutora Rosa Chefaoui pela construção do modelo de distribuição de C. coudensis que permitiu a criação do modelo biogeográfico.
Professora Maria Manuela Coelho, por se disponibilizar para ser a minha orientadora vinculada à faculdade, pela contribuição preciosa para a conclusão e entrega desta tese e pelas palavras de conforto após alguns problemas.
Aos membros do laboratório de Biogeografia, Ecologia e Evolução do Centro de Ciências do Mar que estiveram sempre disponíveis para me ajudar durante este trabalho, partilhando conhecimento ou simplesmente guiando-me pelos recantos do laboratório.
Um último agradecimento à minha família, que acima de tudo sempre me deu a possibilidade de seguir o caminho académico que escolhi e sempre acreditaram que seria de completar fosse o que fosse com sucesso.
iv
Resumo
Os processos geográficos e demográficos deixam marcas nos padrões de variabilidade genética das espécies. Sendo a diversidade genética essencial para garantir capacidade de adaptação das populações a alterações ambientais, a baixa diversidade genética representa um risco mais elevado para os endemismos, que exibem geralmente diversidade mais empobrecidas. Candidula coudensis é uma das 12 espécies de Candidula, um género de gastrópodes terrestres, recentemente identificada em Portugal. A espécie constitui um endemismo do Vale da Couda, no distrito de Leiria, com distribuição geográfica extremamente reduzida (13,5 km2). Dada a potencial vulnerabilidade de um endemismo tão localizado,
foram usadas sequências do ADN mitocondrial (COI: citocromo oxidase subunidade I) e nuclear (ITS1: espaçador interno transcrito subunidade 1), e produzidos modelos de nicho ecológico, para avaliar a diversidade genética e a demografia histórica dos indivíduos do Vale da Couda e, ainda, mapear a sua potencial distribuição geográfica. De forma a determinar se os indivíduos de Vale da Couda constituem um grupo monofilético, foi construída, a partir das sequências de ADN mitocondrial, uma filogenia com as espécies do género presentes em Portugal. A população do Vale da Couda apresentou elevados valores de diversidade genética, existindo um elevado número de haplótipos que se dividem em quatro grupos não monofiléticos. Não parece existir nenhum padrão filogeográfico com os haplogrupos distribuídos de forma não uniforme nos diferentes locais de amostragem. A história demográfica dos indivíduos do Vale da Couda indica sinais de expansão demográfica, sendo necessária uma taxa de mutação de 15%MY para que esta date do Último Máximo Glacial (UMG). O modelo de nicho ecológico determinou que as características ecológicas mais importantes na restrição da distribuição de C. coudensis são a litologia, a isotermalidade e a precipitação anual. Durante o Último Máximo Glaciar (UMG) a distribuição desta espécie localizar-se-ia mais a sul do que a distribuição atual, numa região onde provavelmente coexistiriam outras espécies de Candidula, como C. setubalensis e C. arrabidensis, que presentemente habitam aquela região. Com o final do UMG terá havido uma re-colonização para norte até ao local actualmente ocupado, onde as condições ambientais são apropriadas à sua persistência. Os padrões de elevada variabilidade genética e divergência entre haplogrupos no Vale da Couda podem ser tentativamente explicados por um cenário biogegráfico em que as condições do UMG tenham favorecido um isolamento de populações a um nível micro-geográfico, potenciando a diferenciação entre as mesmas e aumentando a variabilidade intraespecíficica. O Vale da Couda terá então sido colonizado pelas várias linhagens que se formaram durante o UMG, o que explica a existência dos vários haplogrupos existentes actualmente nessa região. O facto de a análise demográfica demonstrar que existiu uma expansão da população corrobora esta hipótese. Actualmente, a elevada variabilidade genética desta população é mantida devido à grande dimensão da mesma.
Concluíndo, a população do Vale da Couda contraria a ideia de que populações com distribuição limitada apresentam diversidades genéticas diminuidas, acrescentando este exemplo à lista de excepções a esta regra. Uma vez que, a elevada diversidade genética está associada a uma elevada população efectiva, e com tempo de geração curto, não há sinais de que a população de Vale da Couda precise de especial protecção do ponto de vista da conservação.
Palavras-chave: ADNmt; ADNn; Candidula; COI; Divergência genética; Filogeografia; ITS1;
v
Abstract
Patterns of genetic variability are shaped by a combination of geographic, demographic and evolutionary processes. Genetic diversity is the raw material for adaptation. Populations and species with restricted geographic distributions usually display low levels of diversity, which represent an evolutionary risk. Candidula coudensis is an endemic species of land snails from Vale da Couda, Portugal, with an extremely restricted distribution (13.5 km2). Mitochondrial (cytochrome oxidase I) and nuclear (internal
transcribed spacer 1) DNA sequences of species of the genus Candidula from Vale da Couda and other locations in Portugal were used to evaluate the monophyly of C. coudensis,patterns of genetic diversity and the species demographic history. Ecological niche models (ENM) for both present and Last Glacial Maximum (LGM) distributions of C. coudensis were constructed to assess possible shifts in the distribution that might have influenced the evolutionary history of this species. The population of Vale da Couda showed unexpected levels of genetic variability given its striking restricted geographic range. We found a high number of haplotypes which are part of four non-monophyletic haplogroups, unevenly distributed among sites. The putative past and contemporary models of geographic distribution of Vale da Couda lineages are compatible with a scenario of species co-existence in more southern locations during the last glacial maximum (LGM) followed by a post-LGM northern dispersal, tracking the species to optimal thermal, humidity and soil physical conditions. LGM conditions may have favoured population isolation at a micro-geographical level, promoting intra-specific diversification. This diversity is maintained presently due to a large effective population size. Mismatch analysis indicated a population expansion during the LGM, which corroborates our biogeographic scenario. The high divergence and non-monophyly between haplogroups prompts the need for future molecular taxonomy studies of the Candidula genus in Portugal to clarify the identity of species that seem to be non-monophyletic.
Keywords: Candidula; COI; Ecological niche models; Genetic divergence; ITS1; LGM; mtDNA;
vi
INDEX……….VI RESUMO ... IV ABSTRACT ... V INDEX OF FIGURES ... VII INDEX OF TABLES ... VIII LIST OF ABBREVIATIONS ... IX 1. GENERAL INTRODUCTION ... 1
1.1. MITOCHONDRIAL AND NUCLEAR DNA ... 2
1.2. ESTIMATING GENETIC DIVERSITY IN POPULATIONS ... 3
1.3. ECOLOGICAL NICHE MODELLING ... 4
1.4. THE GENUS CANDIDULA IN PORTUGAL... 5
1.5. OBJECTIVES ... 8
1.6. RESEARCH QUESTIONS AND HYPOTHESES ... 8
1.7. REFERENCES ... 9
2. HIGH UNEXPECTED GENETIC DIVERSITY OF A NARROW ENDEMIC TERRESTRIAL MOLLUSC* ... 12
2.1. ABSTRACT ... 12
2.2. INTRODUCTION ... 13
2.3. MATERIAL AND METHODS ... 14
2.3.1 Taxon sampling ... 14
2.3.2 Laboratory procedures and sequence alignments ... 15
2.3.3 Population genetics ... 16
2.3.4 Taxonomic context... 16
2.3.5 Environmental niche modelling ... 16
2.4. RESULTS ... 17 2.4.1 Population genetics ... 17 2.4.2 Phylogenetic estimation ... 21 2.4.3 Niche modelling ... 21 2.5. DISCUSSION ... 24 2.5.1 Population genetics ... 24
2.5.2 Environmental niche modelling ... 24
2.5.3 Biogeographic scenario ... 25 2.5.4 Taxonomic implications ... 25 2.6. CONCLUSIONS ... 26 2.7. REFERENCES ... 26 3. FINAL REMARKS ... 31 3.1. REFERENCES ... 32 4. APPENDIX... 33
vii
Index of Figures
Figure 1.1 - Distribution of Candidula species in Portugal (Holyoak & Holyoak 2014). ... 7
Figure 2.1 - (A) Vale da Couda collection sites. (B) Distribution of Candidula sampling sites in
mainland Portugal ... 15
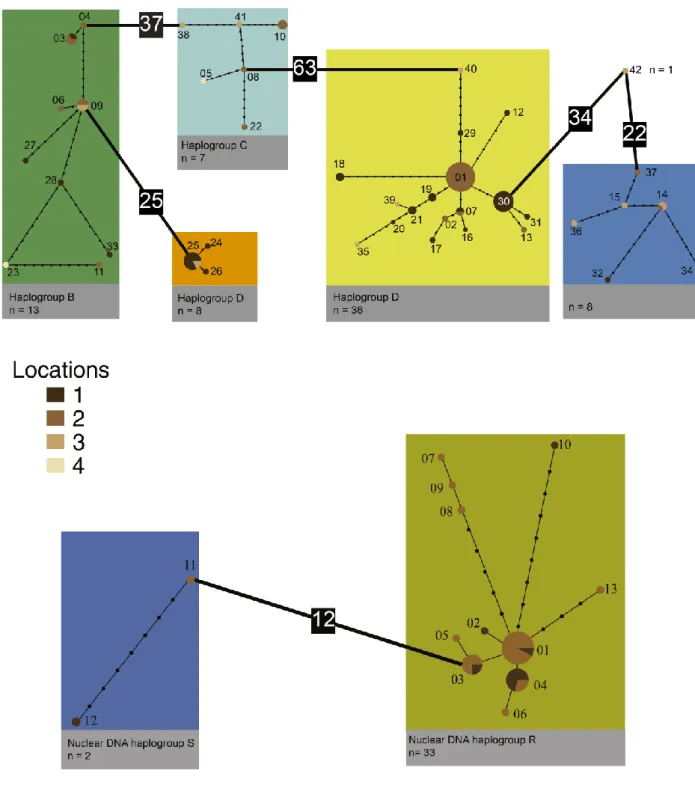
Figure 2.2 - (A) MtDNA COI statistical parsimony haplotype network for Vale da Couda individuals.
(B) Nuclear ITS1 statistical parsimony haplotype network for Vale da Couda individuals. Each branch represents one inferred mutational step; small black circles on branches represent additional infrred mutational steps; numbers in black squares denote more than twenty mutations. ... 19
Figure 2.3 - Distribution of mtDNA lineages in Vale da Couda sites. Numbers represent sites; numbers
in italic represent distance in km between sites. Size of circles is proportional to the number of individuals. Colors depicting haplogroups are the same as in Figure 2.2 ... 20
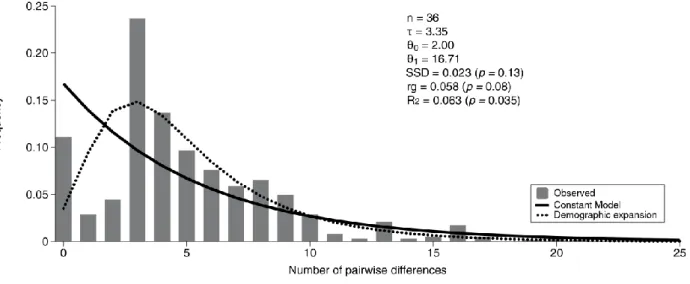
Figure 2.4 - Mismatch distribution of lineage D from Vale da Couda, indicating number of individuals
in the analysis (n), Fu’s FS test of selective neutrality and population expansion, evolutionary expansion age in mutational units (τ), effective population size before (θ0) and after (θ1) population expansion, and mean expansion time in units of thousand years (ka). Note that the range in expansion age corresponds to the 95% confidence interval of (s). SSD represents the sum of squares deviations, rg the raggedness statistics and R2. ... 21
Figure 2.5 - Predicted geographic distribution built with presences of Vale da Couda individuals and
based on (A) current climate, and (B) Last Glacial Maximum (LGM) conditions. Colour scale represents high probability of occurrence in red and low levels in blue. Black dots represent the present-day known occurrences in the Vale da Couda. Ice sheet existing during LGM in the north of the Iberian Peninsula is not depicted ... 23
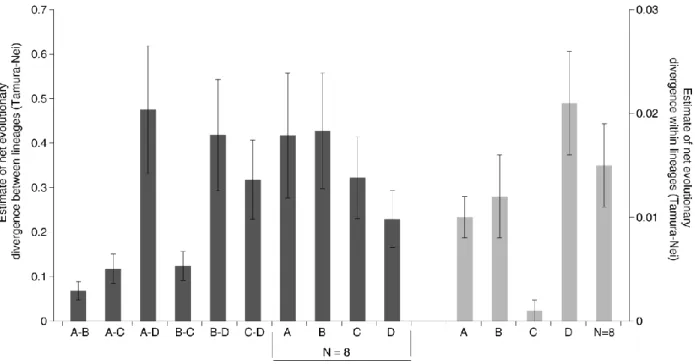
Figure 4.S1 - Estimates of net evolutionary divergence between haplogroups (axis on the left, dark grey
bars ± standard deviation) and within lineages (axis on the right, light grey bars ± standard deviation),
based on Tamura-Nei
distances………...35
Figure 4.S2 - Phylogenetic relationships between Candidula individuals from Vale da Couda (in red)
and other locations in Portugal. Black squares represent individuals identified morphologically and anatomically. Colours of locations as in Figure 1.1. Outgroups removed from figure for illustrative purposes. ... 35
viii
Index of Tables
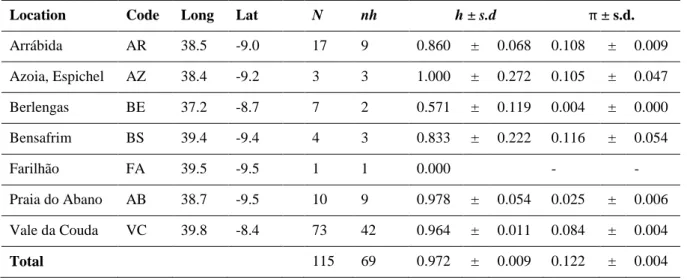
Table 2.1 - Vale da Couda lineages, sample sizes and summary statistics for COI and ITS1 sequence
fragments (A). Vale da Couda site sample sizes, lineages present and summary statistics for COI and ITS1 (B). ... 18
Table 2.2 - Environmental Niche Factor Analysis (ENFA) results showing marginality and
specialization factors scores. The three variables with higher marginality scores (in bold) were selected for subsequent analyses. ... 22
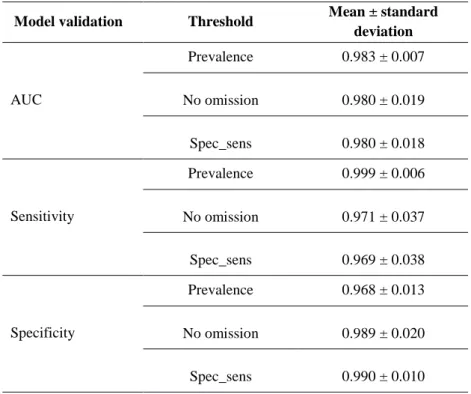
Table 2.3 - Mean AUC, sensitivity and specificity scores obtained from the 100 Maxent models
according to the three thresholds used. (Spec_sens: threshold that maximizes the sum of the sensitivity and specificity). ... 22
Table 4.S1 - Sample location and summary statistics for the genus Candidula………..33
Table 4.S2 - Bioclimatic variables for current conditions retrieved from WorldClim dataset (Hijmans
ix
List of Abbreviations
AUC – Area under curve Bioclim – Bioclimatic variables CI – Confidence interval COI – Cytochrome oxidase I DNA – Desoxyribonucleic acid
ENFA – Environmental niche factor analysis ENM – Ecological niche model
GCM – General circulation model
Hi – Mean observed heterozygosity per individual within subpopulation
HS – Mean heterozygosity in subpopulations
HT – Heterozigozity in all populations
ITS1 – Internal transcribed spacer 1 LGM – Last glacial maximum ML – Maximum Likelihood mtDNA – mitochondrial DNA nDNA – nuclear DNA
PCR – Polymerization chain reaction RNA – Ribonucleic acid
rRNA – Ribossomal RNA Rg – Raggedness index
ROC – Receiver operating curve SDM – Species distribution model SSD- Sum of squared deviations
1
1. General Introduction
Phylogeography originally combined evidence from both population genetics and geographic distribution, to understand the evolutionary processes that shape population structure (Avise 2000). Phylogeography was developed as a way to connect the microevolutionary processes shaping the differences between populations to the macroevolutionary differences between species and higher taxa (Avise et al. 1987). New analytical tools are being developed that render phylogeography into a more integrative science, combining phylogeographic estimates with data relative to species distribution, natural selection and ecological speciation (Hickerson et al. 2010).
Population genetics aim is to study the genetic composition of populations, analysing the distribution and frequency changes of both genotypes and phenotypes, driven by the basic evolutionary mechanisms. The four basic mechanisms behind evolutionary processes are: 1) genetic drift; 2) mutation; 3) migration; and 4) natural selection. Genetic drift is the change in allele frequencies resulting from the random sampling of the parental alleles, within the gene pool of a population (Masel 2011). Genetic drift effects are dependent on population size, resulting in the loss of diversity in smaller populations (Masel 2011) and the maintenance of high diversity in larger ones (Mitchell-Olds et al. 2007). Mutations are responsible for creating new alleles, and these new alleles can be either neutral, deleterious or advantageous, and their frequency on the population will change depending on that effect (Mitchell-Olds et al. 2007). Migration affects genetic diversity by creating gene flow between populations, and can result in the introduction of new alleles in the populations receiving immigrants (Mitchell-Olds et al. 2007). Finally, natural selection acts upon the genetic variation created by all these mechanisms and can be directional, balancing or disruptive, leading to a change in the allele frequencies (Mitchell-Olds et al. 2007). The evolutionary drivers translate themselves into divergence between gene pools, demographic changes in populations, migrations between metapopulations, that are generally promoted by geological and/or climate events. If genetic isolation is in place by whatever mechanism (e.g. allopatry, sexual selection), it is possible that, in time, local variants of a species turn into endemic species.
Endemic species are found by definition in relatively restricted areas (Gaston 1994). Species with limited geographic distributions that occupy few and specialized habitats, with small population sizes, are more susceptible to local extinctions . The endangerment of an endemic species can have different origins (e.g., loss of its habitat or loss of habitat quality), and it has an immediate impact on the biodiversity of the area. Even if the species does not disappear, a simple reduction of its habitat can represent a major drawback, since the decrease of an already limited geographic area of distribution will greatly influence the survivability of an endemism (Bonn et al. 2002). Endemic species constitute a model to explore population genetics in what effectively can be seen as an island setting. The geographic and demographic components interact with genetic dynamics of the species, often determining viability. Genetic diversity is essential to ensure the populations can withstand environmental fluctuations, during short timeframes, and also serves as the basis for selection and capacity to adapt to changes in the environment in the long run (e.g. Frankham 2005;Laikre et al. 2009). It is therefore useful to establish the genetic properties of those species, such as genetic diversity and connectivity, as well as historical demography, to better monitor these species and contribute to a sounder conservation management. In the next sections of this introduction, I will briefly address the most relevant components of this thesis: (1) Mitochondrial and nuclear DNA; (2) Estimating genetic diversity in populations; (3) Ecological Niche modelling; (4) The genus Candidula in Portugal.
2
1.1. Mitochondrial and nuclear DNA
The mitochondrial DNA (mtDNA) is one of the most widely used molecules in phylogeography and population genetics, due to its characteristics: (1) is relatively easy to amplify since it has multiple copies in each cell; (2) mtDNA genes are flanked by highly conserved regions, making it easier to create universal primers for each gene; (3) is inherited clonally from the mother, and in most animals is generally free of recombination (Birky 2001); (4) the genome is haploid. Despite some highly conserved mtDNA sections, regions such as the control region or D-loop display a high mutation rate, varying greatly in natural populations.
Cytochrome oxidase I is a mitochondrial gene that has been used for a long time in phylogeny and population genetics studies (Avise 1994). This gene evolves at a pace which enables the discrimination between closely related species (Hebert et al. 2004b; Hajibabaei et al. 2006; Pfenninger & Schwenk 2007) or different phylogeographic groups within the same species (Wares & Cunningham 2001; Cox & Hebert 2001). In fact, COI was used in combination with other DNA fragments to solve the systematics of gastropods, such as the Order Anaspidea (Medina & Walsh 2000), the phylogeny and relationships of the Pleurotomariidae family (Harasewych et al. 1997), as well as in the phylogenetic analysis of Biomphalaria tenagophila (Jannotti-Passos et al. 2010).
To get a more complete picture on the genetic structure of populations and their evolutionary history one should include information on nuclear genes as well. However, in nuclear markers, heterozygous variants often result in a double peak base-calling fluorescence chromatograms generated from the direct sequencing of genomic PCR product because of the diploid condition. These peaks are difficult to disentangle into genetic phases without cloning. There is also some problems while using nuclear DNA, such as the difficulty to isolate DNA haplotypes; choosing a genomic region with high mutation rates; having a greater coalescence time when compared to mitochondrial genes; and the fact that intragenic recombination might generate patterns of reticulate evolution (Presa et al. 2002). Reticulate evolution occurs when different evolutionary lineages are combined. This can be due to hybridization between different species, horizontal gene transfer or genetic recombination (Linder et al. 2004). In many instances, mito-nuclear discordances are observed, as mitochondrial genes are expected to experience lineage sorting faster than nuclear genes due to the sorting rate being inverse to effective size (Funk & Omland 2003; Zink & Barrowclough 2008) and therefore may yield signals of population discrimination when nuclear DNA does not. Additionally, single loci can be affected by random variation of mutational and coalescent events, which might create some discrepant patterns among independent loci, making it important to utilize more than one loci in phylogeography (Jennings et al. 2013)
The internal transcribed spacer 1 (ITS1) is one of the DNA segments that separates the regions responsible for coding the ribosomal RNA, situated between the genes coding for 18 S and 5.8 S (Castalanelli et al. 2013). While the ribosomal genes are highly constrained, due to their importance in protein production, the internal transcribed spacers are non-coding, being free from functional or selective constraints, making them evolve at a faster rate (Weider et al. 2005). Being part of the rRNA multigene family, there can be multiple copies of ITS1 within one individual, existing as a part of tandem repeats (Elderkin 2009). Even though multiple copies may exist, intragenomic variation tends to not be significant, as these tandem repeats are homogenized by processes of concerted evolution. Nonetheless, some cases of intragenomic variation have been found, so caution is advised when using this gene for phylogenetic inference. Cloning can be used to assess if there is intragenomic variability and if it overlaps with intra and inter-specific variability (Harris 2000). ITS1 is commonly used for phylogeographic studies, with its high mutation rate being useful for inferring population structure and gene flow (Castalanelli et al. 2013), as well as being able to infer phylogenetic relationships from populations to families and even higher taxonomic levels (Cheng et al. 2006).
3
1.2. Estimating genetic diversity in populations
A primary goal of empirical population genetic studies is the identification, measurement, and evaluation of genetic diversity and differentiation among and within populations. There is an array of parameters to quantify genetic diversity and differentiation, but their choice is somewhat dependent on the type of genetic marker used. Here, we outline the two most common measures of genetic variation used in population-level genetic studies on DNA sequences, i.e., nucleotide and haplotype diversity. Because these metrics are dependable on population size and age, connectivity between populations, mutation rates and the impact of selection (e.g. Bazin et al. 2006; Wares, 2010), they are relevant measures in population genetics. Nucleotide diversity is a summary statistic used to represent molecular diversity within a sample of sequences, a measure of polymorphism of gene sequences within a population or group of individuals. This statistic is defined as being the average number of nucleotide differences per site between any two randomly chosen sequences from a sample population (Nei & Li 1979, Nei 1987). The mitochondrial genome is haploid and within this context, a haplotype is defined as a sequence or group of identical sequences. Haplotype diversity is the probability that two randomly chosen haplotypes are different (haplotype diversity, h; Nei, 1987).
Species will most naturally become subdivided in more than one population often due to habitat discontinuities and fragmentation. This will promote the existence of smaller groups that will be more inbreed relatively to the whole species. Wright (1943) understood the link between the extent of population differentiation and the inbreeding coefficient due to population subdivision, and proposed the most commonly used metric of genetic differentiation Wright’s (1943, 1951, 1965) fixation index, FST, which was developed as part of a set of hierarchical parameters (FST, FIS, and FIT) to assess the way
in which genetic variation is hierarchically partitioned in natural populations. Three measures of heterozygosity compose the F-statistics indexes of Wright (1943, 1951, 1965): HT the heterozygosity in
all populations; HS the mean heterozygosity in the subpopulations and Hi the mean observed
heterozygosity per individual within subpopulation, whereby FST, the fixation index is defined as (HT −
HS)/HT; FIS, the inbreeding coefficient index is defined as (HS - HI) / HS; and FIT, the overall fixation
index is defined as (HT - HI)/HT.
In endemic species, typically with small population sizes, the FST index is particularly important. The
populations of endemic species are often smaller in size, and one may expect them to display more subdivision than more numerous species. In general, the differentiation between pairs of populations within a larger sample is calculated as pairwise FST. In this case, HT is calculated for the combined
sample of the two populations compared. The F-statistics of Wright (1943, 1951, 1965) were devised for a bi-allelic loci scenario, and the FST-values ranges from 0.0 to 1.0, where 0.0 indicates identical
allele frequencies in a pair of populations (no differentiation) and 1.0 indicates alternate fixation for a single unique allele in each population. This index has a major the drawback, as it decreases with increasing allelic diversity (Wright 1978; Charlesworth 1998; Hedrick 1999, 2005; Jost 2008; Meirmans & Hedrick 2011). If there is more than one allele and in the extreme case where samples do not share alleles, the maximum value of 1.0 is never reached for fixation indices (Wright 1978; Hedrick 1999; Jost 2008). Thus, fixation indices will systematically underestimate genetic differentiation, especially when using highly polymorphic markers (Hedrick 1999). In the last few decades, the number of loci used in population genetic studies have increased dramatically, and a number of modern analogues to FST including GST (Nei 1973, 1987), θST (Cockerham 1969, 1973; Weir & Cockerham 1984), and ΦST
(Excoffier et al. 1992) are in use along with their standardized versions. The standardized versions are estimated by scaling the observed index-value relative to its maximum achievable value.
More recently, Jost (2008) proposed an alternative measure of differentiation called D: ((𝐻𝑇− 𝐻𝑆) (1 − 𝐻⁄ 𝑆)) × (𝑛 (𝑛 − 1⁄ )), where HT and HS are the same as above, and n is the number of
4 populations. Contrary to FST measures, D is not affected by within-population allelic variation, and when
two population samples do not share any alleles, D = 1.
1.3. Ecological niche modelling
Considering the biogeography of a species, its distribution in space and time, we can infer which processes might have given rise to the patterns of variation found in nature (Avise et al. 1987). Phylogeography uses information on the distribution of organisms and combines patterns of genetic diversity to understand the evolutionary history of taxa in light of geographical and environmental past and present-day conditions, tying the distribution of a species or populations with the genetic data (Avise et al. 1987). Incorporating ecological factors into the analysis give us the possibility to check for correlations between a species distribution, or of certain populations, and their genetic similarities or differences. Ecological niche models serve as one of the best tools to link biogeographical and population genetics and phylogenetic data (Alvarado-Serrano & Knowles 2014).
Ecological niche models (ENMs), also known as Species Distribution Models (SDMs) (Elith & Leathwick 2009) are mathematical tools used to predict a species geographical distribution past, present or future, based on their known ecological niche. ENMs are very popular tools and have been used to understand dynamic changes in species distribution and/or extinctions due to climate changes, to study patterns of speciation, migration and to test phylogeographic hypothesis (Lima-Ribeiro & Diniz-Filho 2013). When applied in a phylogeographic framework, ENMs give us a biological insight into the observed patterns of genetic variation, providing a background that can be used to test hypothesis or even generate new ones. ENMs can serve multiple purposes in phylogeographic studies, being able to identify possible locations of past populations, characterizing the preferences and tolerances of a certain species, evaluate the degree of adaptation to abiotic factors between different populations, check if a niche divergence between populations is connected to speciation and evaluating how distribution shifts can lead to species-specific genetic variation patterns. In the last few years there has been an increased use of ENMs in phylogeographic studies, mostly in a post hoc fashion, to try and corroborate previous hypothesis. ENMs can be used as: 1) a visual assessment, to compare patterns of genetic variation with distribution data; 2) to evaluate the possible effects of landscape in the genetic structure of populations or in the gene flow between them; 3) to compare niche differentiation with possible patterns of speciation; 4) to evaluate the environmental stability of a given area; and 5) to generate predictions about the future distribution a species, given the possibility of environmental changes (Alvarado-Serrano & Knowles 2014). With the usage of ENMs we can study more hypothesis than before, as it enables us to uncover the processes shaping genetic diversity by giving a biological value to otherwise generic genetic statistics.
There are various types of ENMs that can be used, but all of them require us to accept three general assumptions, the assumption that the species we are studying maintains the same niche through time, that there is an equilibrium between species and climate and the need of a taxonomic and taphonomic control, when using fossil records (Lima-Ribeiro & Diniz-Filho 2013). There are two main types of algorithms, the mechanistic and the correlative. The mechanist algorithms are very data intensive, using specific data about the species in study, such as values relative to physiological and physical characteristics, connecting them to their capacity to inhabit different habitats and determine its distribution. On the other hand, correlative algorithms use a statistical approach based on the presence and, in some cases, absence of the species on certain areas to determine its environmental needs. The correlative methods are further divided between the ones that use only data relative to the presence of the species in a certain area and the ones that use both presence and absence (or pseudo-absence in some cases) data. Since mechanistic approaches need a much greater amount of data, correlative methods are usually preferred, being easier to apply while not losing that much precision. Correlative algorithms are
5 dependent on two types of data, the distribution of the species and the environmental layers. Distribution data should be carefully and thoroughly obtained through multiple surveys, to ensure that the species range is well represented. After this data is organized it is then plotted into a geographical map containing the environmental data. The environmental data is usually available in public databases and needs to be transformed so it can be included in the geographic map. With the data collected, one of the algorithms is chosen and the data should be treated accordingly, as to include absence data or not if the algorithm requires it (Alvarado-Serrano & Knowles 2014). We can then generate the model to be used and evaluate the performance, so we can fine-tune it to ensure the best results possible. To do so, there’s a specific test that evaluates the prediction capabilities of ENMs, the Receiver operating characteristic (ROC), from which the value of Area under curve (AUC) is retrieved. The AUC varies between 0.5 and 1 and is a measure of the predictive capacities of the model. An AUC with a 0.75 or higher value is needed for the model to be considered useful, and it indicates that 75% of the times the model predicts the presence of the species correctly (Lima-Ribeiro & Diniz-Filho 2013). With the model validated, we can then project it for different regions, climates and even time periods (Alvarado-Serrano & Knowles 2014).
1.4. The genus Candidula in Portugal
The genus Candidula is represented by 24 putative species distributed in Europe, from eastern Canary Islands to the Balkans and northwards to Scotland and southernmost Sweden. In Portugal, 12 of those species can be found, with eight being endemic (Figure 1.1). Of the 12 species, 10 have round shells and two, C. coudensis and C. setubalensis, have a sharply kneeled shell. Most species are hard to distinguish using conchological characters, with C. intersecta and C. olisippensis being even considered as “cryptic species complexes”, since both present a great variation of morphological characters, depending on the type of habitat they are found and other lineages may exist. Morphological classification is usually dependent on the size analysis of the penial flagellum, as this differs greatly between species. For example, C. coudensis and C. setubalensis are very hard to distinguish with a conchological analysis, because both have a sharply kneeled shell, in contrast with all the other species that have rounded shells, but internal morphology allows a clear distinction, since they have very different penial flagellum sizes (Holyoak & Holyoak 2014).
Most of Candidula species prefer open and dry habitats, usually with calcareous substrate. In Portugal, Candidula species are found in a variety of habitats, ranging from rocky limestone grasslands to sand dunes. There are very few records of Candidula species coexisting in the same habitat in Portugal, the exceptions being C. coudensis with C. olisippensis in Vale da Couda, and C. setubalensis with C. arrabidensis, in Serra da Arrábida, where the kneeled shell species coexist with a round shelled neighbour, and still C. belemensis with C. olisippensis, in some locations in Beira Litoral, such as Serra do Sicó, and C. gigaxi with C. ponsulensis, in eastern Baixo Alentejo (Holyoak & Holyoak 2014). Candidula coudensis (Holyoak & Holyoak 2010) is a recently found endemism, in the region of Leiria, Portugal, with a highly restricted geographic distribution, in an area of 13.5 km2 of Vale da Couda
(Moreira et al. 2015). There are few instances where an endemic species has such a small geographic distribution. The species can be found in open rocky limestone substrata, in disturbed areas with low shrubs, grasses and herbs, such as areas occupied by agriculture with areas of natural vegetation and olive tree grounds, in roadside areas or even in stone walls in nearby villages (Moreira et al. 2015). Although land snails are known to be able to survive and even take advantage of some habitat disturbance, there are some factors that can endanger C. coudensis in this region: (1) wildfires can spread quickly and widely in this type of habitat and may lead to its destruction or fragmentation, while also killing the snails by immolation or dehydration; (2) herbicides and pesticides used to treat the olive grounds lead to a decrease in herbaceous vegetation, which means less food and refuge for these animals;
6 (3) quarrying of stones and gravel lead to habitat degradation, while releasing great amounts of dust that have negative impacts on wildlife; (4) roads that lead to a decrease of connectivity between populations that have low mobility by nature; (5) and climate change, leading to bigger drought periods that an affect land snails directly or augment the potential for wildfires (Moreira et al. 2015). If the genetic make-up of C. coudensis reveals low diversities, which can affect the survival of individuals, then this is another relevant factor affecting the species that needs to be taken into consideration.
7
L
a
ti
tu
d
e
Candidula setubalensis
Candidula coudensis
Candidula codia
Candidula scabiosula
Candidula arrabidensis
Candidula belemensis
Candidula strucki
Candidula carrapateirensis
Candidula ponsulensis
Candidula olisippensis
Candidula intersecta
Candidula gigaxii
Longitude
8
1.5. Objectives
Land snails are ideal model organisms to study phylogeographic patterns because their reduced dispersal abilities tend to preserve genetic signatures. The main goal of the present study was to describe small-scale spatial patterns of genetic structure in Candidula coudensis shedding light on the evolutionary history of a species exhibiting extremely reduced geographic range. We also aimed at producing potential distribution maps based on ecological-niche modeling. To that end, we used molecular sequences from both mitochondrial and nuclear genes from C. coudensis and other Candidula species in Portugal, and presence/absence records.
1.6. Research questions and hypotheses
Is Candidula coudensis a monophyletic clade within the Candidula genus in Portugal? How much diversity is there in the Candidula populations of Vale da Couda?
What is the demographic history of Vale da Couda individuals?
Is there a range shift in the putative distribution of Candidula during the LGM in comparison to present-day distributions?
We have posited the following hypotheses for C. coudensis based on a priori theoretical premises that are likely to shape the phylogeographic structure of terrestrial species with low dispersal abilities and restricted geographical distributions and on a priori knowledge about the morphology and distribution of Candidula species in Portugal:
(1) Vale da Couda individuals may form a monophyletic clade, indicative of a single population on a restricted area in the absence of major phylogeographic breaks (rivers, large mountains, etc.). (2) The population from Vale da Couda may show reduced levels of haplotype and nucleotide
diversities, consistent with isolated population on a limited geographical area.
(3) The population from Vale da Couda may have undergone demographic expansion after the LGM, similarly to many other terrestrial species.
9
1.7. References
Alvarado-Serrano DF, and Knowles LL. 2014. Ecological niche models in phylogeographic studies: applications, advances and precautions. Molecular ecology resources 14:233-248. 10.1111/1755-0998.12184
Avise JC. 1994. Molecular markers, natural history and evolution. New York: Chapman and Hall. Avise JC. 2000. Phylogeography: the history and formation of species. Cambridge, Massachussets:
Harvard University Press.
Avise JC, Arnold J, Ball RM, Bermingham E, Lamb T, Neigel JE, Reeb CA, and Saunders NC. 1987. Intraspecific phylogeography: the mitochondrial DNA bridge between population genetics and systematics. Annual Review of Ecology and Systematics:489-522.
Bazin E, Glémin S, and Galtier N. 2006. Population size does not influence mitochondrial genetic diversity in animals. Science 312:570-572.
Birky CW. 2001. The inheritance of genes in mitochondria and chloroplasts: laws, mechanisms, and models. Annual Review of Genetics 35:125-148. 10.1146/annurev.genet.35.102401.090231 Bonn A, Rodrigues ASL, and Gaston KJ. 2002. Threatened and endemic species: are they good
indicators of patterns of biodiversity on a national scale? Ecology Letters 5:733-741. 10.1046/j.1461-0248.2002.00376.x
Castalanelli MA, Cunningham RJ, Davis MB, Groth DM, and Grimm M. 2013. When genes go wild: highly variable internal transcibed spacer1 and conserved mitochondrial DNA haplotypes used to examine the genetic diversity and dispersal pathways of invasive Hylotrupes bajulus in Western Australia. Agricultural and Forest Entomology 15:236-244. 10.1111/afe.12010 Charlesworth B. 1998. Measures of divergence between populations and the effect of forces that reduce
variability. Mol Biol Evol 15:538-543.
Cheng H-L, Xia D-Q, Wu T-T, Meng X-P, Ji H-J, and Dong Z-G. 2006. Study on sequences of ribosomal DNA internal transcribed spacers of clams belonging to the Veneridae family (Mollusca: Bivalvia). Acta Genetica Sinica 33:702-710. 10.1016/S0379-4172(06)60102-9 Cockerham CC. 1969. Variance of gene frequencies. Evolution:72-84.
Cockerham CC. 1973. Analyses of gene frequencies. Genetics 74:679-700.
Cox AJ, and Hebert PDN. 2001. Colonization, extinction, and phylogeographic patterning in a freshwater crustacean. Molecular ecology 10:371-386. 10.1046/j.1365-294X.2001.01188.x Elderkin CL. 2009. Intragenomic variation in the rDNA internal transcribed spacer (ITS1) in the
freshwater mussel Cumberlandia monodonta (Say, 1828). Journal of Molluscan Studies 75:419-421. 10.1093/mollus/eyp043
Elith J, and Leathwick JR. 2009. Species distribution models: ecological explanation and prediction across space and time. Annual Review of Ecology, Evolution, and Systematics 40:677-697. 10.1146/annurev.ecolsys.110308.120159
Excoffier L, Smouse PE, and Quattro JM. 1992. Analysis of molecular variance inferred from metric distances among DNA haplotypes: application to human mitochondrial DNA restriction data.
Genetics 131:479-491.
Frankham R. 2005. Genetics and extinction. Biological Conservation 126:131-140.
10.1016/j.biocon.2005.05.002
Funk DJ, and Omland KE. 2003. Species-level paraphyly and polyphyly: frequency, causes, and consequences, with insights from animal mitochondrial DNA. Annual Review of Ecology,
Evolution, and Systematics 34:397-423. 10.1146/annurev.ecolsys.34.011802.132421
10
Hajibabaei M, Janzen D, Burns J, Hallwachs W, and Hebert P. 2006. DNA barcodes distinguish species of tropical Lepidoptera. Proceedings of the National Academy of Sciences of the United States
of America 103:968-1039. 10.1073/pnas.0510466103
Harasewych M, Adamkewicz SL, Blake JA, Saudek D, Spriggs T, and Bult CJ. 1997. Phylogeny and relationships of pleurotomariid gastropods (Mollusca: Gastropoda): an assessment based on partial 18S rDNA and cytochrome c oxidase I sequences. Molecular marine biology and
biotechnology 6:1-20.
Harris DJ, and Crandall KA. 2000. Intragenomic variation within ITS1 and ITS2 of freshwater crayfishes (Decapoda: Cambaridae): implications for phylogenetic and microsatellite studies.
Mol Biol Evol 17:284-291.
Hebert PDN, Penton EH, Burns JM, Janzen DH, and Hallwachs W. 2004. Ten species in one: DNA barcoding reveals cryptic species in the neotropical skipper butterfly Astraptes fulgerator.
Proceedings of the National Academy of Sciences of the United States of America
101:14812-14817. 10.1073/pnas.0406166101
Hedrick PW. 1999. Perspective: highly variable loci and their interpretation in evolution and conservation. Evolution 53:313-318.
Hedrick PW. 2005. A standardized genetic differentiation measure. Evolution 59:1633-1638.
Hickerson MJ, Carstens BC, Cavender-Bares J, Crandall KA, Graham CH, Johnson JB, Rissler L, Victoriano PF, and Yoder AD. 2010. Phylogeography’s past, present, and future: 10 years after
Avise, 2000. Molecular Phylogenetics and Evolution 54:291-301.
10.1016/j.ympev.2009.09.016
Holyoak DT, and Holyoak GA. 2010. A new species of Candidula (Gastropoda, Hygromiidae) from central Portugal. Iberus 28:67-72.
Holyoak DT, and Holyoak GA. 2014. A review of the genus Candidula in Portugal with notes on other populations in Western Europe (Gastropoda, Pulmonata, Hygromiidae) Journal of Conchology 41:629-672.
Jannotti-Passos LK, Ruiz JC, Caldeira RL, Murta SM, Coelho PMZ, and Carvalho OS. 2010. Phylogenetic analysis of Biomphalaria tenagophila (Orbigny, 1835) (Mollusca: Gastropoda).
Memórias do Instituto Oswaldo Cruz 105:504-511.
Jennings RM, Etter RJ, and Ficarra L. 2013. Population differentiation and species formation in the deep Sea: the potential role of environmental gradients and depth. PLoS ONE 8:e77594. 10.1371/journal.pone.0077594
Jost L. 2008. GST and its relatives do not measure differentiation. Molecular ecology 17:4015-4026. 10.1111/j.1365-294X.2008.03887.x
Laikre L, Nilsson T, Primmer CR, Ryman N, and Allendorf FW. 2009. Importance of genetics in the interpretation of favourable conservation status. Conservation Biology 23:1378-1381. 10.1111/j.1523-1739.2009.01360.x
Lima-Ribeiro M, and Diniz-Filho J. 2013. Modelos ecológicos e a extinção da megafauna: clima e homem na América do Sul. CUBO, São Carlos.
Linder CR, Moret BM, Nakhleh L, and Warnow T. 2004. Network (reticulate) evolution: biology, models, and algorithms. The Pacific Symposium on Biocomputing.
Masel J. 2011. Genetic drift. Current Biology 21:R837-R838. 10.1016/j.cub.2011.08.007
Medina M, and Walsh PJ. 2000. Molecular systematics of the Order Anaspidea based on mitochondrial DNA sequence (12S, 16S, and COI). Molecular Phylogenetics and Evolution 15:41-58. 10.1006/mpev.1999.0736
Meirmans PG, and Hedrick PW. 2011. Assessing population structure: F(ST) and related measures.
11
Mitchell-Olds T, Willis JH, and Goldstein DB. 2007. Which evolutionary processes influence natural genetic variation for phenotypic traits? Nature Reviews Genetics 8:845-856. 10.1038/nrg2207 Moreira F, Calado G, and Dias S. 2015. Conservation status of a recently described endemic land snail,
Candidula coudensis, from the Iberian Peninsula. PLoS ONE 10:e0138464. 10.1371/journal.pone.0138464
Nei M. 1973. Analysis of gene diversity in subdivided populations. Proceedings of the National
Academy of Sciences 70:3321-3323.
Nei M. 1987. Genetic distance and molecular phylogeny. In: Ryman N, and Utter FW, eds. Population
Genetics & Fishery Management. Seattle: Washington Sea Grant Program, University of
Washington, 193–223.
Nei M, and Li W-H. 1979. Mathematical model for studying genetic variation in terms of restriction endonucleases. Proceedings of the National Academy of Sciences 76:5269-5273.
Pfenninger M, and Schwenk K. 2007. Cryptic animal species are homogeneously distributed among taxa and biogeographical regions. BMC evolutionary biology 7:121. 10.1186/1471-2148-7-121 Presa P, Pardo BG, Martínez P, and Bernatchez L. 2002. Phylogeographic congruence between mtDNA
and rDNA ITS markers in brown trout. Mol Biol Evol 19:2161-2175.
Primack RB. 2006. Essentials of conservation biology. Sunderland, Massachusetts: Sinauer Associates. Wares JP. 2010. Natural distributions of mitochondrial sequence diversity support new null hypotheses.
Evolution 64:1136-1142.
Wares JP, and Cunningham CW. 2001. Phylogeography and historical ecology of the North Atlantic intertidal. Evolution 55:2455-2469.
Weider LJ, Elser JJ, Crease TJ, Mateos M, Cotner JB, and Markow TA. 2005. The functional significance of ribosomal (r)DNA Variation: Impacts on the evolutionary ecology of organisms.
Annual Review of Ecology, Evolution, and Systematics 36:219-242. 10.2307/30033803
Weir BS, and Cockerham CC. 1984. Estimating F-statistics for the analysis of population structure.
Evolution 38:1358–1370. 10.2307/2408641
Wright S. 1943. Isolation by distance. Genetics 28:114.
Wright S. 1951. The genetical structure of populations. Annals of eugenics 15:323-354.
Wright S. 1965. The interpretation of population structure by F-statistics with special regard to systems of mating. Evolution:395-420.
Wright S. 1978. Evolution and the genetics of populations. Variability within and among natural
populations. .
Zink RM, and Barrowclough GF. 2008. Mitochondrial DNA under siege in avian phylogeography.
*Article submitted to PeerJ 12
2. High unexpected genetic diversity of a narrow endemic
terrestrial mollusc
*Madeira, Pedro M.1, Chefaoui, Rosa M.1, Cunha, Regina L. 1, Moreira, Francisco 2,3,4, Dias, Susana 2,4,
Calado, Gonçalo 2 and Castilho, Rita1†,
1Centre for Marine Sciences, CCMAR-CIMAR Laboratório Associado, Campus de Gambelas,
8005-139 Faro, Portugal
2Departamento de Ciências da Vida, Escola de Psicologia e Ciências da Vida, Universidade Lusófona,
Campo Grande, 376, 1749-024 Lisboa – Portugal
3REN Biodiversity Chair, CIBIO/InBIO Associate Laboratory, Universidade do Porto, Campus Agrário
de Vairão, Vairão, Portugal
4Centro de Ecologia Aplicada Prof. Baeta Neves/InBIO Associate Laboratory, Instituto Superior de
Agronomia, Universidade de Lisboa, Tapada da Ajuda, Lisbon, Portugal †Corresponding author:
Centro de Ciências do Mar (CCMAR), Campus de Gambelas, 8005-139 Faro, Portugal. Tel: +351 918397282, Fax: +351 289 800 069.
Keywords: endemic species; terrestrial gastropods
2.1. Abstract
A large array of species and species complexes from the Iberian Peninsula display strong genetic subdivisions indicative of past population isolation in separate glacial refugia as a result of survival throughout the Pleistocene ice ages. We used mitochondrial and nuclear sequence data to analyze phylogeographic patterns in endemic land snails from a valley of central Portugal (Vale da Couda), putatively attributed to C. coudensis, and showing an exceptionally narrow distributional range. Considering the restricted geographic distribution, we found an unusually high number of haplotypes that are not
13 monophyletic and are unevenly distributed among the sampling sites. Our results show a departure from the expectation that species with restricted distributions have low genetic variability. The putative past and contemporary models of geographic distribution of Vale da Couda lineages are compatible with a scenario of species co-existence in more southern locations during the last glacial maximum (LGM) followed by a post-LGM northern dispersal tracking the species optimal thermal, humidity and soil physical conditions. Mismatch analysis indicated a population expansion during the LGM, which corroborates our biogeographic scenario.
2.2. Introduction
Phylogeography combines evidence from both population genetics and phylogenetics, to understand the evolutionary processes that shape geographic population structure (Avise 2000). These evolutionary processes include divergence among gene pools, demographic changes in populations, and migrations between metapopulations, generally promoted or constrained by geological and/or climate events. If genetic isolation is in place by whatever mechanism (e.g. allopatry or sexual selection), it is possible that, in time, local variants of a species turn into endemic species. Endemic species are usually found in relatively small areas (Gaston 1994), occupying specialized habitats with small population sizes that are more susceptible to local extinctions (Primack 2006). Endemic species constitute therefore a model to explore population genetics in what effectively can be seen as an island setting. The geographic and demographic components interact with the genetic dynamics of the species, often determining species viability. Genetic diversity is essential to ensure that populations can withstand environmental fluctuations during short timeframes and also serves as the basis for selection and capacity to adapt to changes in the environment in the long run (Frankham 2005; Laikre et al. 2009). It is therefore important to assess the genetic properties of the populations of those species, such as genetic diversity and connectivity, as well as historical demography.
Identifying the drivers of geographic distribution patterns is also essential to understand the population dynamics in space and time. Species distribution modeling (SDM) allows one to examine the relationship between the identified presence records of a species, lineage or related species, with the environmental characteristics of these locations. From the inferred relationship it is possible to estimate the response, function and contribution of environmental variables (Austin et al. 2006), and predict the potential geographical range (Elith & Leathwick 2009). Recently, there has been a growing trend towards the integration of SDM hindcasts with phylogeography as a useful approach to obtain consistent eco-evolutionary hypotheses. This combination allows insights into how the distribution of climatic refuges and postglacial colonization pathways may have influenced genetic diversity of current populations (see e.g. Hewitt 2004).
Land snails are good models for evolutionary studies, since phylogeographic patterns are often preserved due to their limited dispersal capabilities and specific habitat requirements (Pfenninger et al. 2007). Also, snails display an unusually high intraspecific genetic variation, ca. 10-30% in mtDNA sequences (Hayashi & Chiba 2000; Pinceel et al. 2005; Shimizu & Ueshima 2000), which renders the taxa appropriate to understand processes shaping the partitioning of genetic variation in space. Additionally, many land snail examples in the literature show the existence of cryptic species in sympatry (Köhler & Burghardt 2015).
The land snails of the genus Candidula present in Europe, from eastern Canary Islands to the Balkans and northwards to Scotland and southernmost Sweden are represented by 24 putative species. Portugal has 8 endemic species (C. coudensis, C. setubalensis, C. scabiosula, C. arrabidensis, C. belemensis, C. carrapateirensis, C. codia and C. strucki) from a total of 12 (C. gigaxii, C. intersecta, C. ponsulensis, C. olisippensis) (Holyoak & Holyoak 2014). Most species are hard to distinguish using conchological characters only and it takes a combination of morphological characters, such as the size of the penial
14 flagellum or shell shape, to classify the specimens (Holyoak & Holyoak 2014). Nevertheless, a clear, comprehensive, taxonomic assessment based on both morphological and molecular data has not been previously done. Most Candidula species prefer open and dry habitats, usually with calcareous substrate. In Portugal, species can be found in a variety of habitats, ranging from rocky limestone grasslands to sand dunes. There are records of coexisting Candidula species in Portugal: C. coudensis and C. olisippensis in Vale da Couda, and C. setubalensis and C. arrabidensis in Serra da Arrábida, C. belemensis and C. olisippensis in various locations of Beira Litoral, such as Serra do Sicó, and C. gigaxii and C. ponsulensis in eastern Baixo Alentejo (Holyoak & Holyoak 2014).
Candidula coudensis (Holyoak & Holyoak, 2010) is a recently described endemic species with a highly restricted geographic distribution in Vale da Couda, Leiria, Portugal. Moreira et al. (2015) found live
C. coudensis individuals only in a small area of ca. 13.5 km2. A broader survey of 100 km2 in the region,
revealed the presence of C. coudensis shell remains in only 25.2 km2 and to the best of our knowledge,
not a single specimen attributed to this species was to this date found outside these limits.
The species can be found in open rocky limestone substrata, olive tree grounds, areas of natural vegetation, in roadside areas or even in stone-walls in nearby houses (Moreira et al. 2015). The extremely constrained geographic distribution is somewhat rare and there are several possible non-exclusive reasons that would justify such circumscribed distribution: (i) active dispersal may be very small with individuals hardly moving; (ii) very strict environmental and ecological requirements; (iii) present-day individuals of the species are remnants of an older wide-spread haplogroup that range-contracted due to reduction of humidity levels after the Last Glacial Maximum (LGM, c. 20 ka), and/ or (iv) present-day habitat disturbance processes. Specifically, we tested the following hypotheses based on premises that are likely to shape the phylogeographic structure of the land snails from Vale da Couda, putatively attributed to C. coudensis: (1) Vale da Couda individuals may form a monophyletic clade, indicative of a single population on a restricted area in the absence of major phylogeographic breaks (e.g. rivers or large mountains); (2) Vale da Couda individuals may show reduced levels of haplotype and nucleotide diversities, consistent with an isolated population on a limited geographical area, and (3) Vale da Couda individuals may have undergone demographic expansion after the LGM, similarly to many other terrestrial species.
Using a combination of DNA sequences (fragment of the cytochrome oxidase subunit I (COI) mitochondrial gene and of the first nuclear intron - ITS1) and geo-referenced field records of the species we sought to address the above hypotheses by (1) revealing the genetic diversity and geographic structure of contemporary Vale da Couda individuals, and (2) reconstructing the local demographic history. Using Iberian environmental data relative to past and current conditions retrieved from public repositories, we inferred locations of the putative refugia during the LGM and provided estimates of relative environmental suitability of Vale da Couda individuals that can assist future fieldwork.
2.3. Material and Methods
2.3.1 Taxon samplingSampling in Vale da Couda resulted in 73 individuals collected from 4 different sites (Figure 2.1). We received field permit from the Nature and Forests Conservation Institute (ICNF), Portugal (identifier: 81S0/201S/DCNF-LVT/DPAP) for sampling in Arrábida Natural Parque. Immediately after collection, whole shells containing the individual were stored in ethanol 70%.
15
2.3.2 Laboratory procedures and sequence alignments
DNA was extracted from the samples using a CTAB protocol (Doyle & Doyle 1987). Universal primers (Folmer et al. 1994) were used in PCRs to amplify 600 bp of the COI gene. PCR amplifications were performed in 25 μl total volume, using 5 μl 5X PCR Colorless Buffer (pH 8.5), 2 mM (of a 1.5 μl 25 mM MgCl2 solution), 0.2 mM (0.5 μl of a 20 mM dNTP stock), 0.2 μl 5u/μl 1U GoTaq DNA polymerase Promega (Madison, USA) and 0.2 μM (0.5 μl of a 10 μM stock) of each primer. The COI PCR profile consisted of 2 minutes at 95ºC, 35 cycles of 30 seconds at 94ºC, 30 seconds at 53ºC followed by an extension for 1 minute at 72ºC and a final one with 5 minutes. ITS1 gene was amplified by PCR with forward primer ITS1 - 5'-TCCGTAGGTGAACCTGCGGAAGGAT-3' (White et al. 1990) and reverse primer 5.8c - 5'-TGCGTTCAAGATATCGATGTTCAA-3' modified from (Hillis & Dixon 1991). PCR amplifications were performed in 25 μl total volume, using 5 μl 5X PCR Colorless Buffer (pH 8.5), 2 mM (of a 1.5 μl 25 mM MgCl2 solution), 0.2 mM (0.5 μl of a 20 mM dNTP stock), 0.2 μl 5u/μl 1U GoTaq DNA polymerase Promega (Madison, USA) and 0.2 μM (0.5 μl of a 10 μM stock) of each primer. The ITS1 PCR profile consisted of 3 minutes at 97ºC, 35 cycles of 1 minute at 95ºC, 1 minute at 55ºC and 2 minutes at 72º, followed by a final extension of 5 minutes at 72ºC. The PCR results were purified by ethanol precipitation (Sambrook & Russell 2001). Sequencing was performed on an ABI 3130xl (Applied BIOsystems) automated sequencer at CCMAR facilities.
COI sequences were aligned using MUSCLE (Edgar 2004), implemented in Geneious version 7.0.4 (Kearse et al. 2012), and contained no gaps. Heterozygous ITS1 sequences were fed into Mixed Sequence Reader (MSR) (http://msr.cs.nthu.edu.tw), which separates the information from the chromatogram into a major and minor sequence, corresponding to each allele, while comparing the sequence information with a given reference sequence (Chang et al. 2012). Major and minor sequences for each sample were recovered and posteriorly aligned using MAFFT default options (Katoh & Standley 2013).
16
2.3.3 Population genetics
Molecular diversity indices, including nucleotide (π) (Nei 1987) and haplotype (H) (Nei & Tajima 1981) diversities, were estimated using DnaSP v5.10 (Librado & Rozas 2009). To evaluate the level of population differentiation among four Vale da Couda sites, we used FST genetic fixation (Weir &
Cockerham 1984) and Dest genetic differentiation (Jost 2008) statistics were estimated with the
modelling package diveRsity 1.9.5 (Keenan et al. 2013). The variance of each statistic was assessed through the calculation of 10 000 pairwise bootstrapped 95% confidence limits using a bias corrected method that basically re-centers the confidence interval (CI) around the initial parameter estimate. We employed both genetic estimators as they present advantages and drawbacks in quantifying population structure (for a discussion see Bird et al. 2011; Jost 2008; Meirmans & Hedrick 2011; Ryman & Leimar 2009; Whitlock 2011).
Phylogeographic relationships among haplotypes of COI and ITS1 alleles were represented using the Median Joining Network method (Bandelt et al. 1999) implemented in Network (version 4.6.1.0; fluxus-engineering.com) that infers the most parsimonious branch connections between sequences. Net divergences between and within mtDNA and nuclear DNA haplogroups were calculated using MEGA6 (Tamura et al. 2013) using the Tamura-Nei model (Tamura & Nei 1993) for both data sets.
Mismatch analysis was used to explore the demographic history of Vale da Couda haplogroups with sample size above 15, with the raggedness index (rg, Harpending 1994), the sum of squared deviations (SSD, Schneider & Excoffier 1999) and R2 (Ramos-Onsins & Rozas 2002) a statistic based on the difference between the number of singleton sites and the average number of nucleotide differences. Demographic mismatch analysis was based on the null hypothesis of expansion; thus, non-significant values mean non-rejection of population expansion. DnaSP (Librado & Rozas 2009) was used to obtain observed and expected distributions under the constant population model and the growth population model.
Initial and final θ estimates (before and after population growth or decline) and τ values were calculated with Arlequin v. 3.5.1.3 (Excoffier & Lischer 2010). Time of inferred population expansion were determined by Texp = τ /(2 μ n), where μ = COI substitution rate per base and per generation, and n = number of bases of the COI fragment (Rogers & Harpending 1992), assuming a generation time of one year (Pfenninger et al. 2003).
2.3.4 Taxonomic context
In order to place the Vale da Couda samples in a broader phylogenetic context and to ascertain the
non-monophyly of the individuals from Vale da Couda (given the very distant haplogroups found – see Results section below), putative Candidula spp. individuals were collected in different locations (Supplementary information Table S1). It was not, however, our intention to produce a complete and thorough phylogeny for the genus Candidula. We followed Holyoak and Holyoak (2014) taxonomy to identify some specimens based on morphology. The partial sequences of the mitochondrial (mtDNA) COI gene including 73 Candidula from Vale da Couda, produced a data set of 464 nucleotide positions. The Akaike Information Criterion (Akaike 1974) implemented in MODELTEST selected the K81uf+I+G as the evolutionary model that best fits the data set. Since this model is not available in PHYML v.3.0 (Guindon et al. 2003), we selected the second best-fit model, the HKY+G. The selected model and model parameters were used in the ML analysis performed with PhyML. The robustness of the inferred trees was tested by nonparametric bootstrapping (BP) using 1000 pseudoreplicates. ML analysis was carried out at the Mobyle platform (http://mobyle.pasteur.fr/cgi-bin/portal.py).
2.3.5 Environmental niche modelling
The study area considered was the Iberian Peninsula. Bioclimatic variables for current conditions were retrieved from WorldClim dataset (Hijmans et al. 2005) in 30 arc seconds (~1 km), resolution used for