Mart (ARECACEAE): IMPLICATIONS FOR CONSERVATION
Mirian de Sousa Silva1, Fábio de Almeida Vieira2, Dulcinéia de Carvalho3 (received: February 10, 2010; accepted: February 25, 2011)
ABSTRACT: Geonoma schottiana is an underbrush palm which is found in high densities in tropical forests. This species is known for having an asynchronous fruit producing pattern, over all seasons of the year, thus being an important food source for frugivores. This work aims to determine the diversity and spatial genetic structure of two natural populations, referred to as MC I and MC II, of which 60 individuals were sampled, in Poço Bonito Biological Reserve, Lavras, Minas Gerais state. Results of 10 polymorphic isozyme loci indicated a high genetic diversity for the species (Ĥe = 0.428 and Ĥo = 0.570), with an mean number of alleles per locus of 2.0. Estimates of Cockerham’s coancestry coeffi cients indicated an absence of intrapopulation (fˆ = -0.343) and interpopulation
inbreeding (Fˆ = -0.161), suggesting that on average populations are not endogamous. A high genetic divergence was found between
populations (θˆp = 13.5%), in comparison to most tropical species (<5%). Consequently, the estimated historical gene fl ow was low (Nˆm = 0.40). The analysis of spatial distribution of G. schottiana genotypes in MCI revealed a random distribution of genotypes. The high genetic diversity indices found suggest that the populations in question favor in situ genetic conservation, consequently favoring the conservation of riparian environments.
Key words: Allozymes, spatial genetic structure, genetic conservation.
DIVERSIDADE E ESTRUTURA GENÉTICA EM POPULAÇÕES NATURAIS DE Geonoma schottiana Mart (ARECACEAE): IMPLICAÇÕES PARA A CONSERVAÇÃO
RESUMO: Geonoma schottiana é uma palmeira de sub-bosque com alta densidade em fl orestas tropicais. A espécie se destaca pela assincronia na produção de frutos durante todas as estações, sendo uma importante fonte de alimento para animais frugívoros. Objetivou-se, com este trabalho, determinar a diversidade e a estrutura genética espacial de duas populações naturais, MC I e MC II, em que foram amostrados 60 indivíduos, na Reserva Biológica do Poço Bonito, em Lavras, Minas Gerais. Os resultados dos 10 locos isoenzimáticos polimórfi cos indicaram alta diversidade genética para a espécie (Ĥe = 0,428 e Ĥo = 0,570), com número médio de alelos por loco igual a 2,0. As estimativas dos coefi cientes de coancestralidade de Cockerham indicaram ausência de endogamia dentro (fˆ = -0,343) e também para o conjunto das populações (Fˆ = -0,161), sugerindo que, em média, as populações não são endogâmicas. Foi encontrada uma alta divergência genética entre populações (θˆp = 13,5%), quando comparada com a maioria das espécies tropicais (<5%). Consequentemente, o fl uxo gênico histórico estimado foi baixo (Nˆm = 0,40). A análise da distribuição espacial dos genótipos de G. schottiana na MCI revelou que a distribuição dos genótipos é aleatória. Os altos índices de diversidade genética detectados sugerem que as populações estudadas são favoráveis à conservação genética in situ e, consequentemente, dos ambientes ciliares.
Palavras-chave: Aloenzimas, estrutura genética espacial, conservação genética.
1Forest Engineer, M.Sc. in Forest Science – Departamento de Ciências Florestais – Universidade Federal de Viçosa – 36570-000 – Viçosa, MG, Brasil –
mirianfl [email protected]
2Bachelor of Biological Sciences, Professor Ph.D. in. Forest Engineering – Departamento de Agropecuária – Universidade Federal do Rio Grande
do Norte – 59072-970 – Natal, RN, Brasil – [email protected]
3Forest Engineer, Professor Ph.D. in. Forest Microbiology – Departamento de Ciências Florestais – Universidade Federal de Lavras – Cx. P. 3037 –
37200-000 – Lavras, MG, Brasil – [email protected]fl a.br 1 INTRODUCTION
Tropical biomes are highly fragmented, which leads to a reduction in the size of several ecosystems and thus to local species extinction. The main consequence is evolutionary implications on account of the loss of genetic variability, which reduces the ability of natural populations to adapt to environmental changes (YOUNG; BOYLE, 2000).
Inserted in this context, in the Alto Rio Grande region, south Minas Gerais state, is the original vegetation cover which once consisted of miscellaneus patches of forest, savannah, high altitude grassland and rocky grassland but today is reduced to fragments of primitive vegetation (Seasonal Semideciduous Forest), most of which subjected to serious disturbances from fi re, extensive cattle raising or selective timber removal (OLIVEIRA-FILHO; MACHADO, 1993).
Geonoma schottiana Mart. (Arecaceae) is an underbrush palm species found in high densities in tropical forests. It has a well defi ned supporting stalk, although it may shoot out to form a thicket structure, having a frequently twisted stipe, between 1.6 m and 6 m in length (HENDERSON et al., 1995). This species is known for its extended fruiting periods throughout virtually every month of the year, revealing its potential importance for the conservation of fruit eating birds (SAMPAIO; SCARIOT, 2008). Characteristics relating to the biometry of G. schottiana fruits are reported by Silva et al. (2007), who reinforce the importance of this species as a food source for the fauna.
However, research studies are required with several arboreal species and ecological conditions in order to provide information to fully implement management and genetic conservation strategies. A very peculiar ecological condition is provided by riparian areas, as they fulfi ll important functions that include not only maintaining water quality and quantity but also contributing to biodiversity conservation by acting as ecological corridors for many species.
Therefore, investigating the levels of genetic variability and their distribution among and within natural populations, and also gene fl ow, is critical to fully implement any genetic conservation program. Bearing in mind ecology concepts and population genetics, allozyme markers have been used as a tool to obtain information and evaluate genetic variability in natural plant populations (PINTO et al., 2004; VIEIRA; CARVALHO, 2008; VIEIRA et al., 2010).
This work aims to evaluate and understand the patterns of inter- and intrapopulation genetic diversity, in order to determine the gene fl ow and study the spatial distribution of genotypes in two populations of Geonoma schottiana. The reason for selecting this species for the genetic studies of this work is because it is considered to be a key species in plant communities and because it is abundant in riparian environments.
2 MATERIAL AND METHODS 2.1 Study site and sampling
Individuals were sampled in Quedas do Rio Bonito forest park (PFQRB), which is located south of the municipality of Lavras - MG (21°19’ South and 44°59’ West), at an altitude that ranges between 950 and 1,200 m. The region is a transition zone between the savannahs of Central Brazil and semidecidous forests of Southeast and South Brazil (OLIVEIRA-FILHO; FLUMINHAN FILHO, 1999). The local climate, according to Köppen classifi cation, is transitional between Cwb and Cwa, in other words, temperate with dry winters, with average annual precipitation of 1,529.7 mm and average annual temperature of 19.4°C. The PFQRB park constitutes a valuable sample of existing primitive vegetation in the Alto Rio Grande region, as its fi ve main vegetation types – forest, savannah, high altitude grassland, rocky grassland and candeal – are well represented and reasonably preserved (OLIVEIRA-FILHO; FLUMINHAM FILHO, 1999).
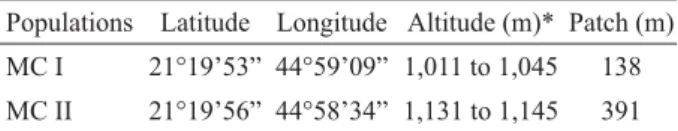
Two populations of G. schottiana were analyzed adjacent to a body of water, which is abundant due to the convergence of the drainage basin. The sampled G. schottiana individuals are thus situated in the riparian zone of Córrego dos Vilas Boas which, according to IBGE’s Brazilian vegetation classifi cation, is referred to as Alluvial Semideciduous Seasonal Forest with an emerging canopy (VELOSO et al., 1991). The populations are referred to as MC I and MC II. Unlike MC I, which boasts beaten paths along the body of water, MC II is in better conservation conditions. The relevant populations are approximately 660.0 m apart, at varying altitudes (Table 1).
Table 1 – Coordinates, altitude and total patch sampled of
Geonoma schottiana populations.
Tabela 1 – Localização, altitudes e trecho total amostrado das populações de Geonoma schottiana.
Populations Latitude Longitude Altitude (m)* Patch (m)
MC I 21°19’53” 44°59’09” 1,011 to 1,045 138
MC II 21°19’56” 44°58’34” 1,131 to 1,145 391
*Altitude at actual sampling location.
randomly collected along the body of water but in an area of compact canopy and difficult access, which prevented plant mapping. Individuals sampled in MC I were georeferenced using a GPS, for a subsequent spatial autocorrelation analysis. The leaf samples were taken to the Laboratory of Genetic Conservation of Arboreal Species of the Department of Forest Sciences/UFLA, where they were deep frozen at -80°C, so as to prevent enzyme degradation.
2.2 Allozyme extraction and electrophoresis
For enzyme extraction, 200 mg of leaf tissue were used per 1 mL of buffer solution (buffer no.1) (ALFENAS et al., 1998). The extracts were then centrifuged at 12,000 rpm at 4°C for 10 minutes. After centrifugation, 35 μL of the supernatant were applied to the gels in a vertical electrophoresis system, as conducted in a polyacrylamide gel supporting medium, using a 4% concentration gel and a 12.5% separation gel. For the electrophoresis run, an amperage of 10 mA per gel was used, and 300 Volts, set to run for about three and a half hours, at 4°C. Ten enzyme systems were selected as a function of the good resolution of the band patterns: alcohol dehydrogenase (ADH), α–esterase (α–EST), ß-esterase (ß-EST), acid phosphatase (ACP), glucose dehydrogenase (GDH), glutamate dehydrogenase (GTDH), glutamate oxaloacetate transaminase (GOT), malate dehydrogenase (MDH), sorbitol dehydrogenase (SDH), and shikimate dehydrogenase (SKDH). The zymograms were interpreted regarding pattern detection of different allozyme systems. The identifi cation of coding regions of loci and alleles was done from the more cathodic to the more anodic region. The interpretation of each allozyme system was done according to the enzyme pattern defi nition available in literature (ALFENAS et al., 1998).
2.3 Statistical analyses
The interpretation of zymograms enabled determination of the genotypes of each individual and estimation of several genetic parameters. Allele frequencies were estimated by a direct count of the number of alleles per locus, divided by the total number of alleles in the locus: Pˆi= ni / n, where Pˆi is the frequency of allele i, ni is the number of occurrence of allele i and n is the total number of alleles sampled. Based on the allele frequencies, genetic diversity indices were estimated: percentage of polymorphic loci (PˆL; criterion 0.95), mean number of alleles per locus (A), mean observed heterozygosity(Ĥo),
mean expected heterozygosity (Ĥe) and Wright’s fi xation indices (fˆ), using program BIOSYS-2 (SWOFFORD; SELANDER, 1997).
The genetic structure was assessed based on Cockerham’s coancestry coeffi cients (COCKERHAM, 1969). Parameters being estimated included:fˆ, mean fixation index within populations; Fˆ, fixation index between populations; and θˆp genetic divergence between populations. These parameters correspond to the estimates of Wright’s FIS, FIT and FST respectively. The analysis of variance was run using program GDA (LEWIS; ZAYKIN, 2000). Estimates of historical gene fl ow between populations were obtained using the equation proposed by Crow and Aoki (1984): Nˆm = [(1/ FˆST) - 1] / 4α, where: α = [n /(n - 1)]², Nˆmbeing the number of migrants and n, the number of populations. The neighborhood size was estimated by Nˆb = 2π.Nˆm (SLATKIN; BARTON, 1989). For analysis of the spatial genetic structure (EGE) of G. schottiana, in MC I, distance class intervals among individuals were determined by testing the rules for each interval, as suggested by Hardy and Vekemans (2002). As for MC II, the spatial genetic structure was not estimated on account of the diffi culty in mapping the individuals of this population. The multilocus coancestry coeffi cient (Fij) according to Loiselle et al. (1995) was estimated among plants for each of the distance classes using program SPAGeDi version 1.2g (HARDY; VEKEMANS, 2002). This coefficient estimates the probability of identity of alleles of two homologous genes as sampled in two individuals. The EGE intensity was calculated by Sp = -blog/ (1 - F(m)), where blog is the slope of the regression curve of coeffi cient Fij on the logarithm of distance and F(m) is the mean coancestry coeffi cient between individuals in the fi rst distance class. When blog= 0 the null hypothesis of random EGE is accepted. The standard error of estimated mean was obtained using jackknife resampling among loci, then confi dence intervals at the 95% probability level were constructed of the estimated mean coancestry coeffi cient for each distance class. Absence of spatial genetic structure was tested within each distance class using 1,000 permutations.
3 RESULTS AND DISCUSSION 3.1 Allele frequencies
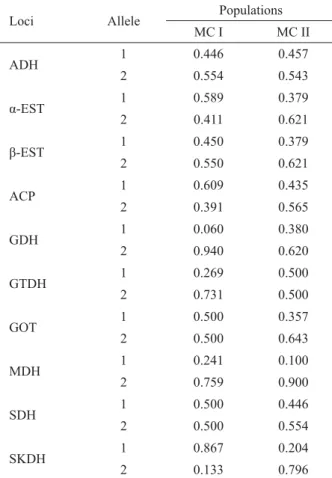
allele frequency, while in MC II only the GTDH allozyme system showed the same allele frequencies. Considering that loci showing genic similarity (low variation range) will present allele frequencies between 0.350 and 0.650 (FRANKEL et al., 1995), it was noted that for MC I and MC II this proportion was 60% and 80% respectively. According to Frankel et al. (1995), higher similarity in allele frequencies for a population is an indicator of higher genetic diversity and less susceptibility to the effects of genetic drift, in comparison to dissimilar allele frequencies. Obtained results point to the hypothesis that almost all individuals of locus ADH are heterozygotes, as only a selection favoring heterozygotes can explain the occurrence of two alleles in one locus, with a frequency close to 0.5. These results could be related to a sampling artifact on account of the sample size.
3.2 Intrapopulation genetic variability
The number of alleles per locus (Â) was equal to 2.0 (Table 3), similar to results found for several palm species (EGUIARTE et al., 1992; VIEIRA et al., 2010). The percentage of polymorphic loci (P) was 100% for both populations. The observed heterozygosity values were higher than the expected, revealing a tendency toward excess heterozygotes in relation to the Hardy-Weinberg equilibrium. The high genetic diversity detected can be explained by an absence of rare alleles and allele frequencies in similarity. These high values of heterozygosity suggest the existence of selective mechanisms acting in favor of heterozygotes. Similar results were found in other works, including the work of Hamrick et al. (1993) and Reis (1996). 3.3 Genetic structure
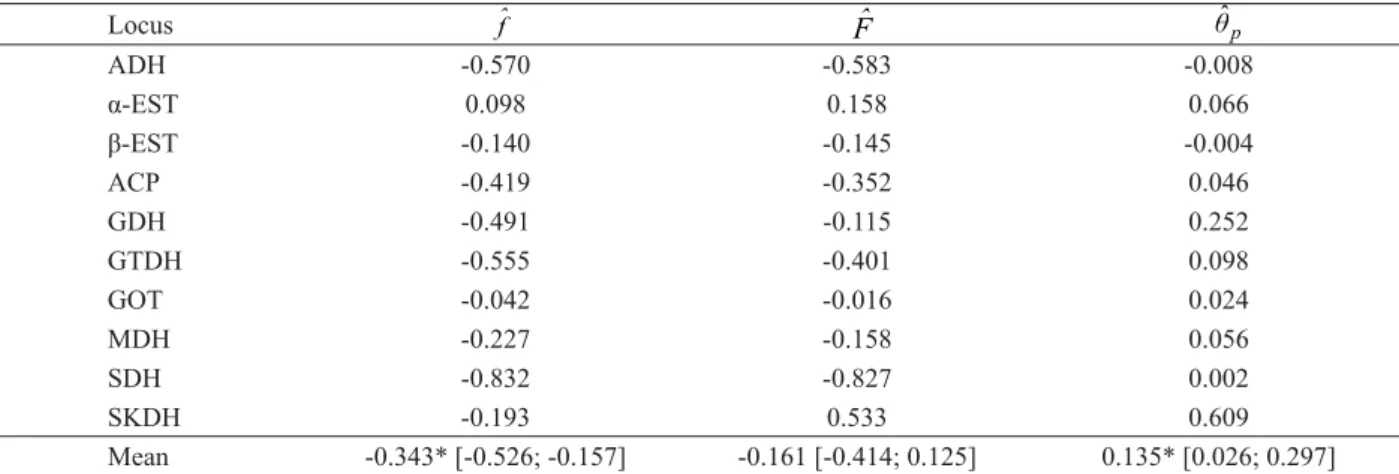
Estimates of Cockerham’s coancestry coeffi cients indicated absence of intrapopulation (fˆ = -0,343) and interpopulation inbreeding (Fˆ = -0,161), suggesting that on average the populations are not endogamous (Table 4). The estimate of genetic differentiation (θˆp) between populations indicated that 13.5% of the genetic variability is among populations. This estimate is high if compared to most tropical species (< 5%). This is probably due to the reproductive isolation of the populations in question. Considering the neutral nature of the allozyme marker, the divergence between the populations could be the result of a structured spatial distribution of the genotypes; the effect, for instance, of a short or locally restricted seed dispersion or even of formation of thickets and possibility of self-fertilization. This would possibly explain the high genetic divergence found, considering that the measure being used (θˆp) calculates the difference among populations as a function of the mean coancestry within populations. Thus, a mean coancestry of 0.135 indicates that within groups (subpopulations) the coancestry was within the expected range in half sibs (0.125) and full sibs (0.25).
The number of migrants per generation (Nˆm) was estimated at 0.40, indicating low historical gene fl ow. The neighborhood size (Nˆb) was of 2.51 individuals, indicating that the number of parent individuals randomly exchanging alleles may be in the range of 2 to 3. These values can be considered relatively low if compared to results obtained by Reis (1996) for Euterpe edulis: Nˆm = 10.7 and Nˆb = 67. Several factors may affect gene fl ow in natural populations, including the reproductive system of the relevant species and ecological relations between plants and their pollinators and dispersers (DICK et al., 2003). Table 2 – Allele frequencies in 10 isozyme loci in two populations
of G. schottiana.
Tabela 2 – Frequências alélicas em 10 locos isoenzimáticos em duas populações de G. schottiana.
Loci Allele Populations
MC I MC II
ADH 1 0.446 0.457
2 0.554 0.543
α-EST 1 0.589 0.379
2 0.411 0.621
β-EST 1 0.450 0.379
2 0.550 0.621
ACP 1 0.609 0.435
2 0.391 0.565
GDH 1 0.060 0.380
2 0.940 0.620
GTDH 1 0.269 0.500
2 0.731 0.500
GOT 1 0.500 0.357
2 0.500 0.643
MDH 1 0.241 0.100
2 0.759 0.900
SDH 1 0.500 0.446
2 0.500 0.554
SKDH 1 0.867 0.204
According to Wright (1951), when the estimated gene fl ow is less than one (Nˆm < 1), the effects of migration are insuffi cient to counteract the effects of drift, thus favoring divergence between populations. It should be noted that the calculated gene fl ow value based on genetic divergence refl ects fl ow over a long time span, in the past. The estimate, rather than indicating occurrence of gene fl ow in a given reproductive event, it calculates the levels that may have occurred to produce the observed patterns of genetic structure (SMOUSE; SORK, 2004). Therefore, the current gene fl ow between the two populations could be even lower. In addition, it could be implicated by anthropic intervention via trail opening, as is the case with MC I. This could be repelling local fauna species, which constitute the main dispersers of this plant species. An analysis of open pollinated progenies may help understand the gene fl ow pattern as a function of the local anthropization process.
3.4 Spatial genetic structure
The analysis of spatial distribution of genotypes revealed absence of a genetic structure in MC I, in other words, a random distribution of G. schottiana genotypes in all distance classes (Figure 1). The values of coancestry coeffi cients (Fij) for the relevant population were close to zero or negative and nonsignifi cant. This suggests that spatially close individuals of G. schottiana are not any more related than more distanced individuals. The null hypothesis of a random distribution of the genetic structure (blog = 0) was rejected in the relevant population, with the slope value of the regression curve being approximately -0.006 (P < 0.001), nonsignifi cant. The Sp value of 0.006 revealed a weak and nonsignifi cant spatial genetic structure for the population, as was expected, since the values of coancestry coeffi cients were close to zero.
Table 3 – Genetic diversity indices of two natural populations of Geonoma schottiana, based on ten loci and ten enzyme systems.
Tabela 3 – Índices de diversidade genética de duas populações naturais de Geonoma schottiana, baseados em 10 locos e 10 sistemas enzimáticos.
Genetic diversity indices Populations
MC I MC II
Mean number of alleles per locus (Â) 2.0 2.0
Percentage of polymorphic loci (P) 100.0 100.0
Mean observed heterozygosity (Ĥo) 0.588 (0.084) 0.552(0.079)
Mean expected heterozygosity (Ĥe) 0.413 (0.043) 0.444 (0.033)
Fixation index (f) -0.423* [-0.530; -0.375] -0.243* [-0.382; -0.126]
Actual sample size per locus (n) 27.6 27.0
( ) = standard deviation; [ ] confi dence interval; * = signifi cant at the 5% probability level
Table 4 – Coancestry coeffi cients between two natural populations of Geonoma schottiana.
Tabela 4 – Coefi cientes de coancestralidade entre as duas populações naturais de Geonoma schottiana.
Locus
ADH -0.570 -0.583 -0.008
α-EST 0.098 0.158 0.066
β-EST -0.140 -0.145 -0.004
ACP -0.419 -0.352 0.046
GDH -0.491 -0.115 0.252
GTDH -0.555 -0.401 0.098
GOT -0.042 -0.016 0.024
MDH -0.227 -0.158 0.056
SDH -0.832 -0.827 0.002
SKDH -0.193 0.533 0.609
Mean -0.343* [-0.526; -0.157] -0.161 [-0.414; 0.125] 0.135* [0.026; 0.297]
[ ] = confi dence interval; * = signifi cant at the 5% probability level
The absence of spatial structure observed indicates that local selection and, or, local genetic drift are weak enough not to produce a signifi cant structure in the presence of gene fl ow (DOLIGEZ; JOLY, 1997). However, it should be noted that the lack of spatial genetic structure may well be a sampling artifact. The sample was small (30 plants per population) and randomly collected, therefore closely related individuals were not always sampled and that reduced the chance of detecting spatial genetic structure. As suggested by Cavers et al. (2005), ideally one should use samples of at least 150 genotypes, from within a well defi ned area, such as a square plot.
4 CONCLUSIONS
The diversity detected was high in relation to the Hardy-Weinberg equilibrium, indicating absence of inbreeding. These populations were found to be potential tolls for in situ genetic conservation and forest management.
Most of the genetic variability of the species being studied occurs within natural populations.
The gene fl ow found between the populations was low, characterizing a high genetic divergence between them.
The analysis of spatial distribution of genotypes revealed absence of genetic structure in MC I.
Studies concerning the biology of the relevant species and correlations with biotic and abiotic factors are important, because only by accumulating information will Figu re 1 – Correlogram of the coancestry coeffi cient (Fij) per distance class for G. schottiana individuals in MC I; Confi dence intervals (---).
Figura 1 – Correlograma do coefi ciente de coancestralidade (Fij) por classes de distância para os indivíduos de G. Schottiana na MC I; Intervalos de confi ança (---).
more sustainable strategies be suggested for management, understanding of the dynamics and also development of conservation policies.
5 ACKNOWLEDGMENTS
The authors wish to thank CNPq for granting the scholarship and fi nancing the research project, and Parque Florestal Quedas do Rio Bonito for making access available to plant populations and for supporting fi eld work.
6 REFERENCES
ALFENAS, A. C. Eletroforese de isoenzimas e proteínas afi ns: fundamentos e aplicações em plantas e microrganismos. Viçosa, MG: UFV, 1998. 574 p.
CAVERS, S.; DEGEN, B.; CARON, H.; LEMES, MR.; MARGIS, R., SALGUEIRO, F.; LOWE, A. J. Optimal sampling strategy for estimation of spatial genetic structure in tree populations. Heredity, Amsterdam, v. 95, n.4, p. 281-289, 2005.
COCKERHAM, C. C. Variance of gene frequencies. Evolution, Madison, v. 23, n. 1, p. 72-84, 1969.
CROW, J. F.; AOKI, K. Group selection for polygenic behavioral trait: estimating the degree of population subdivision. Proceedings of the Natural Academy of Sciences of the United States of America, Washington, v. 81, n. 19, p. 6073-6077, 1984.
DICK, C. W.; ETCHELECU, G.; AUSTERLITZ, F. Pollen dispersal of tropical trees (Dinizia excelsa: Fabaceae) by native insects and African honeybees in pristine and fragmented Amazonian rainforest. Molecular Ecology, New York, v. 12, n. 3, p. 753-764, Mar. 2003.
DOLIGEZ, A.; JOLY, H. I. Genetic diversity and spatial structure within a natural stand of a tropical forest tree species, Carapa procera (Meliaceae), in French Guiana. Heredity, v. 79, n. 2, p. 72-82, 1997.
EGUIARTE, L. E.; PEREZ-NASSER, N.; PINERO, D. Genetic structure, outcrossing rate and heterosis in Astrocaryum mexicanum (tropical palm): implications for evolution and conservation. Heredity, Amsterdam, v. 69, p. 217-228, 1992.
HAMRICK, J. L.; MURAWSKI, D. A.; NASON, J. D. The infl uence of seed dispersal mechanisms on the genetic structure of tropical tree populations. Vegetatio, The Hague, v. 108, n. 6, p. 281-297, 1993.
HARDY, O.; VEKEMANS, X. SPAGeDi 1.2: a versatile computer program to analyse spatial genetic structure at the individual or population levels. Molecular EcologyNotes, Davis, v. 2, p. 618-620, 2002.
HENDERSON, A.; GALEANO, G.; BERNAL, R. Field guide to the palms of the Americas. New Jersey: Princeton University, 1995. 352 p.
LEWIS, P. O.; ZAYKIN, D. Genetic data analysis: computer program for the analysis of allelic data. Version 1. 0 (d15). Disponível em: <http://alleyn.eeb.uconn.edu/gda/2000>. Acesso em: 10 ago. 2006.
LOISELLE, B. A.; SORK, V. L.; NASON, J.; GRAHAM, C. Spatial genetic structure of a tropical understory shrub,
Psychotria offi cinalis (Rubiaceae). American Journal of Botany, Madison, v. 82, p. 1420–1425, 1995.
OLIVEIRA-FILHO, A. T.; FLUMINHAN FILHO, M. Ecologia da vegetação do Parque Florestal Quedas do Rio Bonito. Cerne, Lavras, v. 5, n. 2, p. 51-64, 1999.
OLIVEIRA-FILHO, A. T.; MACHADO, J. N. M. Composição
fl orística de uma fl oresta semidecídua montana, na Serra de São José, Tiradentes, Minas Gerais. Acta Botanica Brasílica, Porto Alegre, v. 7, n. 2, p. 71-88, 1993.
PINTO, S. I. C.; SOUZA, A. M.; CARVALHO, D. Variabilidade genética por isoenzimas em populações de
Copaifera langsdorffi i Desf. em dois fragmentos de mata ciliar. Scientia Forestalis, Piracicaba, n. 65, p. 40-48, jun. 2004.
REIS, M. S. Dinâmica da movimentação dos alelos: subsídios para conservação e manejo de populações naturais em plantas. Brazilian Journal of Genetics, Ribeirão Preto, v. 19, n. 4, p. 37-47, 1996.
SAMPAIO, B. M.; SCARIOT, A. Growth and reproduction of the understory palm Geonoma schottina Mart. in the gallery forest in Central Brazil. Revista Brasileira de Botânica, São Paulo, v. 31, n. 3, p. 433-442, 2008.
SILVA, M. S.; VIEIRA, F. A.; CARVALHO, D. Biometria dos frutos e divergência genética em uma população de Geonoma schottiana Mart. Revista Brasileira de Biociências, São Paulo, v. 5, n. 1, p. 582-584, jul. 2007. Suplemento.
SLATKIN, M.; BARTON, N. H. A comparison of three indirect methods for estimating average levels of gene fl ow. Evolution, Amsterdam, v. 43, n. 7, p. 1349-1368, 1989.
SMOUSE, P. E.; SORK, V. L. Measuring pollen fl ow in forest trees: an exposition of alternative approaches. Forest Ecology and Management, Amsterdam, v. 197, n. 1/3, p. 21-38, 2004.
SWOFFORD, D. L.; SELANDER, R. B. Biosys-2, a computer program for the analysis of allelic variation in population genetics and biochemical systematics. Urbana: University of Illinois, 1997.
TEWKSBURY, J. J.; LEVEY, D. J.; HADDAD, N. M.; SARGENT, S.; ORRROCK, J. L.; WELDON, A.; DANIELSON, B. J.; BRINKERHOFF, J.; DAMSCHEN, E. I.; TOWNSEND, P. Corridors affect plants, animals, and their interactions in fragmented landscapes. Proceedings of the National Academy of Sciences of the United States of America, Orlando, v. 99, n. 20, p. 12923-12926, 2002.
VELOSO, H. P.; RANGEL FILHO, A. L. R.; LIMA, J. C. A. Classifi cação da vegetação brasileira adaptada a um sistema universal. Rio de Janeiro: Fundação Instituto Brasileiro de Geografi a e Estatística, 1991. 123 p.
VIEIRA, F. A.; CARVALHO, D. Genetic structure of an insect-pollinated and bird-dispersed tropical tree in vegetation fragments and corridors: implications for conservation. Biodiversity and Conservation, Essex, v. 17, p. 2305-2321, 2008.
VIEIRA, F. A.; CARVALHO, D.; HIGUCHI, P.; MACHADO, E. L. M.; SANTOS, R. M. Spatial pattern and fi ne-scale genetic structure indicating recent colonization of the palm
Euterpe edulis in a Brazilian Atlantic forest fragment. Biochemical Genetics,New York, v. 48, p. 96-103, 2010.
WRIGHT, S. The genetical structure of populations. Annals of Eugenic, New York, v. 15, p. 395-420, 1951.