Inês Mendonça Lourenço Martins
Licenciada em Bioquímica
Effects of CORM-3 formulations in in vitro
and in vivo models of inflammation
Dissertação para obtenção do Grau de Mestre em Química Bioorgânica
Março, 2020
Orientador: Professora Doutora Teresa Sacadura Santos Silva
Co-orientador: Professora Doutora Maria Alexandra Núncio de Carvalho Ramos Fernandes
Júri
Presidente: Professora Doutora Paula Cristina de Sério Branco
Arguente: Professora Doutora Ana Isabel Tomaz Vogal: Professora Doutora Teresa Sacadura
Effects of CORM-3 formulations in in vitro and in vivo models of inflammation
Copyright © Inês Mendonça Lourenço Martins, Faculdade de Ciências e Tecnologia, Universidade Nova de Lisboa.
A Faculdade de Ciências e Tecnologia e a Universidade Nova de Lisboa têm o direito, perpétuo e sem limites geográficos, de arquivar e publicar esta dissertação através de exemplares impressos reproduzidos em papel ou de forma digital, ou por qualquer outro meio conhecido ou que venha a ser inventado, e de a divulgar através de repositórios científicos e de admitir a sua cópia e distribuição com objetivos educacionais ou de investigação, não comerciais, desde que seja dado crédito ao autor e editor.
ACKNOWLEDGMENTS
My first acknowledgment couldn’t go to anyone but professor Teresa Santos Silva, my supervisor, for always being a helping hand. I will be forever grateful for all the trust and kindness you showed me since the very beginning and throughout this project. I also owe a special thank you to professor Alexandra Fernandes, my co-supervisor. Thank you for pushing me when I needed, for making me grow as a student and as a person. Additionally, I am thankful to professor Pedro Baptista for his advices and lab resources. I often forgot I wasn’t officially under your supervision.
This journey wouldn’t also be possible if it weren’t for Bruno Vidal and his availability to teach. Thank you for your good mood, it made working in the weekend fun. There are many institutions, professors and colleagues who should be mentioned because in one way or another had an impact on my work. Given the risk of forgetting someone or significantly extending these words, I will only name Catarina Rodrigues and Muthu, and thank the others in this way, hoping they’ll forgive me the anonymity.
It always takes some effort to adjust to a new place, so I was very lucky to have Beatriz Oliveira, Daniela Ferreira and Bruno Veigas who made it easy. Thank you, Bruno, for making me feel part of the “family”, I hope you know what that meant to me. Thank you, Daniela, for all the food, parties and kind hostility, you made me smile every single day. Thank you, Beatriz, for all the conversations that got me through the lower times, I feel like we could cross the entire Lisbon on foot without realizing it.
Finally, I could never finish without thanking my parents for all the love, support and payment of my student debts. Thank you, mãe, for your ever-endless patience and, pai, for all the books.
RESUMO
As moléculas libertadoras de CO (CORMs) são uma nova classe de fármacos capazes de distribuir monóxido de carbono (CO) às células e tecidos de maneira controlada. Desta forma, mostram-se capazes de mimetizar os efeitos homeostáticos do CO gasoso em processos inflamatórios e sem os efeitos tóxicos que lhe são associados. A Molécula Libertadora de CO 3 (CORM-3) é um complexo carbonílico metálico de ruténio (Ru) capaz de libertar um dos seus ligandos sob a forma de CO quando em contacto com proteínas. Por estas razões, tem vindo a ser usada como molécula modelo para explorar o papel e as propriedades dos CORMs metálicos, tanto in vitro como in vivo.
A albumina é uma proteína central no transporte de drogas no sangue e, como tal, responsável pelo perfil farmacocinético e eficácia de muitos fármacos. Neste trabalho, análises espectroscópicas de UV-Vis e supressão (quenching) de fluorescência da albumina do soro bovina (BSA) na presença de CORM-3, mostram pequenas diferenças de conformação proteica após interação com o ligando e um efeito de quenching descrito pela relação de Stern-Volmer. A decomposição do CORM-3 no tampão fosfato usado caracteriza-se por uma constante de degradação de 0.0026 s-1 e um tempo de semivida
abaixo dos 5 minutos. Esta cinética complica os estudos de interação dado que se torna difícil de distinguir a ação do complexo da dos seus produtos de decomposição.
As nanopartículas de ouro (AuNPs) apresentam vantagens como sistemas de drug delivery dada a biocompatibilidade e facilidade de combinação com biomoléculas. Por esse motivo, um nanoconjugado deste tipo (AuNP@PEG@BSA@CORM-3), com polietilenoglicol (PEG), BSA e CORM-3, foi desenvolvido no laboratório onde o presente trabalho se inclui, apresentando maior eficiência anti-inflamatória em monócitos humanos quando comparado com o complexo metálico livre. A diferente internalização celular do CORM-3 quando livre e combinado surge como possível explicação para a diferença de eficácias anti-inflamatórias. Neste trabalho, tal hipótese é estudada por Espectrometria de Emissão Atómica por Plasma Acoplado Indutivamente de modo a quantificar o Ru e o Au nas células. Embora os resultados apontem para possíveis problemas na preparação das amostras celulares, indicam uma internalização de nanoconjugado baixa e incompatível com a sugestão levantada.
Finalmente, a possibilidade deste sistema ser usado no tratamento da Artrite Reumatoide, uma doença inflamatória, foi explorada usando BSA para transporte de CORM-3 como ensaio preliminar aos nanoconjugados, em ratos com Artrite Induzida por Adjuvante (AIA). A falta de efeitos descritos para a dose de CORM-3 possível de vetorizar (0.0037 mg Kg-1), sugere que este sistema não é viável no tratamento de inflamações sistémicas.
Termos-chave: monóxido de carbono, CORM-3, albumina, nanopartículas de ouro,
ABSTRACT
CO-Releasing Molecules (CORMs) are a novel class of pharmaceutical agents able to release carbon monoxide (CO) to cells and tissues in a controlled manner, thus mimic the previously seen homeostatic properties of gaseous CO, namely in inflammatory processes, with neglectable toxicity. CO-Releasing Molecule 3 (CORM-3) is a ruthenium (Ru) carbonyl metal complex known to release one of its CO ligands when in contact with proteins, which have been used to describe metal-CORMs different roles and properties both in vitro as in vivo.
Albumin is a key protein transporter of drugs in the bloodstream, therefore responsible for their pharmacokinetic profiles and ultimately efficiency. In the present work, UV-Vis analysis and fluorescent methods are used to study Bovine Serum Albumin (BSA) and CORM-3 interaction, showing little conformational changes upon CORM-3 incubation and an effective quenching described by the Stern-Volmer relationship. CORM-3 decomposition in the working phosphate buffer is also followed by UV-Vis spectroscopy showing a degradation rate constant of 0.0026 s-1 and a half-life of less than 5 minutes.
This instability in water complicates interaction studies, since it becomes difficult to distinguish between the metal complex true action from its decomposition products’. Gold nanoparticles (AuNPs) are suitable drug delivery systems due to their good biocompatibility and ability to be conjugated with biomolecules. Therefore, a nanoconjugate of this kind (AuNP@PEG@BSA@CORM-3), featuring polyethylene glycol (PEG), BSA and CORM-3, was developed by the same group were the present work is included, showing better anti-inflammatory efficiency in human monocytes than CORM-3 by itself. Given the fact that one nanoconjugate can load hundreds of metal complexes, cellular uptake could be the reason behind their different efficiencies. Herein, such hypothesis is studied using Inductively Coupled Plasma-Atomic Emission Spectroscopy (ICP-AES) as a way to quantify Ru and Au within cells. Although the collected data show possible sample preparation problems in the cell matrixes, the overall results point towards a much lower nanoconjugate uptake when compared to the free form of CORM-3, which seems incompatible with the suggestion previously made.
Finally, the possibility of such nanoconjugate to be used therapeutically against Rheumatoid Arthritis, a chronic inflammatory disease, is explored using BSA as a carrier, as a preliminary assay for the nanoformulation, in Adjuvant-Induced Arthritic (AIA) rats. The lack of effect at a 0.0037 mg Kg-1 of CORM-3’s dose, rejects beforehand the
possibility of this kind of system to be used against systemic inflammations.
Keywords: carbon monoxide, CORM-3, albumin, gold nanoparticles, nanoconjugate,
SYMBOLS AND NOTATION
-/- Zero Copies of the Gene
A Pre-exponential Factor (in Arrhenius eq.)
Abs Absorbance
AIA Adjuvant-Induced Arthritis
AP Activator Protein
AuNPs Gold Nanoparticles
BSA Bovine Serum Albumin
BVR Biliverdin Reductase
CCR Complete Culture medium Recipe
cGMP Cyclic Guanosine 3’,5’-Monophosphate CIA Collagen-Induced Arthritis
COHb Carboxyhemoglobin
COP-1 CO fluorescent Probe 1 CORM-2 CO-Releasing Molecule 2 CORM-3 CO-Releasing Molecule 3
CORMs CO Releasing Molecules
COX Cyclooxygenase
CTs Charge Transfers
Cys Amino Acid Cysteine
DLS Dynamic Light Scattering
DMARD Disease Modifying Anti Rheumatic Drug
DTNB 5,5’-Dithiobis(2-nitrobenzoic acid) or Ellman’s reagent Ea Activation Energy (in Arrhenius eq.)
EDC N-(3-Dimethylaminopropyl)-N’-ethylcarbodiimide
F Fluorescence Intensity
F0 Fluorescence Intensity in Absence of Quencher
FBS Fetal Bovine Serum
FSL Fibroblast-Like Synoviocytes
HEWL Hen Egg-White Lysozyme
HIF𝛼 Hypoxia Inducible Factor alpha
HO Heme Oxygenase
HOMO Highest Occupied Molecular Orbital
HSA Human Serum Albumin
HSP32 Heat Shock Protein 32
XII
ℎ𝜈 Photon’s energy
ICAM Intercellular Adhesion Molecule iCORM-3 Inactive CO Releasing Molecule 3
ICP-AES Inductively Couples Plasma – Atomic Emission Spectroscopy
IL Interleukin
IFN-𝛾 Interferon gamma
iNOS Inducible Nitric Oxide Synthase
JNK c-Jun N-terminal Kinase
k Degradation Rate Constant
K General Rate Constant (in Arrhenius eq.) kq Rate Constant of Fluorophore Accessibility
K General Stern-Volmer Constant
KD Stern-Volmer Constant in a Dynamic Quenching
KST Stern-Volmer Constant in a Static Quenching
LOD Limit of Detection
LPS Lipopolysaccharides
LSP Localized Surface Plasmon
LSPR Localized Surface Plasmon Resonance LUMO Lowest Unoccupied Molecular Orbital MAPK Mitogen-Activated Protein Kinase
Mb-CO Carboxy-Myoglobin
MES 2-(N-morpholino)ethanesulfonic Acid
MW Molar Weight
NADPH Nicotinamide Adenine Dinucleotide
NF-𝜅B Nuclear Factor 𝜅B
NO Nitric Oxide
NOS Nitric Oxide Synthase
NPAS Neuronal PAS Domain
NSAID Nonsteroidal Anti-Inflammatory Drug
P p-value
PAMPs Pathogen-Associated Molecular Patterns
PBS Phosphate Buffer Solution
PEG Polyethylene Glycol
PI Polydispersity Index
PMN Polymorphonuclear Neutrophil
PPAR𝛾 Peroxisome Proliferator Activator Receptor gamma
R Ideal Gas Constant
RA Rheumatoid Arthritis
RPMI Roswell Park Memorial Institute
RT Room Temperature
SD Standard Deviation
SDS Sodium Dodecyl Sulphate
SEM Standard Error of the Mean
sGC Soluble Guanylate Cyclase
STAT Signal Transducer and Activator of Transcription Sulfo-NHS N-hydroxysulfosuccinimide
𝑡'/) Half-life Time
THP-1 Human Acute Monocytic Leukaemia Cell Line
TLR Toll-like Receptors
TNF𝛼 Tumor Necrosis Factor alpha
UV Ultraviolet
VCAM Vascular Cell Adhesion Molecule
Vis Visible
v/v Volume per Volume
WGSR Water-Gas Shift Reaction
w/v Weight per Volume
𝜀 Molar Extinction Coefficient
𝜆,-.. Excitation Wavelength
𝜏1 Lifetime of the Fluorophore
∆𝐺1 Change in Free Energy (Gibbs energy) (in Van’t Hoff eq.)
∆𝐻1 Change in Enthalpy (in Van’t Hoff eq.)
TABLE OF CONTENTS
ACKNOWLEDGMENTS V
RESUMO VII
ABSTRACT IX
SYMBOLS AND NOTATION XI
FIGURE INDEX XVII
TABLE INDEX XIX
I.INTRODUCTION 2
1. Carbon Monoxide (CO) 2
1.1. Heme Degradation Pathway 2
1.1.1. Heme Oxygenase 1 (HO-1) 3
1.2. CO as an Endogenous Regulator 4
2. Metal Based CORMs 7
2.1. CO-Releasing Molecule 3 (CORM-3) 7
2.1.1. Physicochemical Properties 7
2.1.2. Biological Activity 9
3. Rheumatoid Arthritis 11
4. Gold Nanoparticles in Medicine 13
II.OBJECTIVES 15
III.MATERIALS AND METHODS 16
1. UV-Vis Spectroscopy 16 2. Fluorescence Quenching 16 3. AuNP@PEG@BSA@CORM-3 Preparation 16 3.1. AuNP Synthesis 16 3.2. AuNP@PEG Functionalization 17 3.3. AuNP@PEG@BSA Functionalization 17 3.4. AuNP@PEG@BSA@CORM-3 Functionalization 18 3.5. DLS Analysis 18 4. THP-1 Cell Culture 18 4.1. Cell Count 18
XVI
5. Evaluation of the Inflammatory Response in vitro 19
6. ICP-AES Experimental Assays 19
7. Animals and Experimental Procedure 20
7.1. Histology 21
7.2. Statistical Analysis 21
IV. RESULTS AND DISCUSSION 22
1. BSA and CORM-3 Interaction Studies 22
1.1. UV-Vis Spectroscopy 22
1.1.1. CORM-3 Decomposition 22
1.1.2. BSA Conformational Study 24
1.2. BSA Fluorescence Quenching by CORM-3 26
2. Evaluation of the Inflammatory Response in vitro 30
3. Cellular Uptake 32
4. BSA@CORM-3 Adducts Against an In Vivo Model of RA 36
V. CONCLUSIONS AND FUTURE PERSPECTIVES 42
VI.REFERENCES 45
APPENDICES A1
Appendix 1 A1
HSA and BSA Homology A1
Data Normalization A1
UV-Vis Interaction Analysis A1
Fluorescence Intensity vs. Wavelength A2
ln K vs. 1/T A3
Appendix 2 A4
Nanoconjugates Characterization A4
Considering Pellet Values A5
Appendix 3 A6
Dose Rationale A6
FIGURE INDEX
Figure I.1. Heme degradation pathway. 3
Figure I.2. Very simplified representation of the MAPK (JNK and p38 only) and NF-𝜅B
signaling pathways. 5
Figure I.3. Chemical structure of CORM-3. 7
Figure I.4. Qualitative molecular diagram of CO according to MO theory. Components
of the Ru-CO bonding. 8
Figure I.5. Molecular models of protein-CORM interactions. 9
Figure I.6. VCAM-1-mediated leukocyte adhesion and migration across endothelial
cells. 10
Figure I.7. Localized surface plasmon resonance peaks. AuNP SPR shift before (naked
AuNP) and after functionalization with a biomolecule (AuNP@PEG). 13
Figure IV.1. BSA monomer domains and subdomains in different colors and shades,
using PyMol software. 22
Figure IV.2. Decomposition of CORM-3 in the working buffer. 23
Figure IV.3. UV-Vis absorption spectra of free BSA and BSA with CORM-3. 24 Figure IV.4. Comparison between spectra after 10 min incubation and the sum of free
BSA and CORM-3 resulting spectra, overlapped at different protein-to-ligand ratios. 25
Figure IV.5. Trp134 and Trp212, His and Asp residues in BSA monomer. 26
Figure IV.6. Stern-Volmer plots for BSA and CORM-3 at different incubation times and
temperatures. 27
Figure IV.7. Comparison between dynamic and static quenching. 28
Figure IV.8. Two-step EDC/sulfo-NHS reaction mechanism. 30
Figure IV.9. Effects of free and functionalized CORM-3 onto AuNPs in THP-1 cells
after incubation with LPS. 31
Figure IV.10. Visible state of the inflammation per group. 38
Figure IV.11. Illustrative histology of Winstar rats left hind paw, both healthy and with
AIA. 39
Figure IV.12. Semi-quantitative evaluation of histological sections. 40
Figure A.1. UV-Vis spectra for different incubation times overlapped by BSA:CORM-3
XVIII
Figure A.2. Emission spectra of a constant concentration of BSA, with and without
CORM-3, at different temperatures for different incubation times. A2
Figure A.3. Van’t Hoff plot using Stern-Volmer experimental constants. A3
TABLE INDEX
Table I.1. Overall CO targets. 6
Table I.2. Some mediators implied in RA. 12
Table III.1. ICP-AES sample preparation. 20
Table IV.1. Stern-Volmer constants. 28
Table IV.2. Quantification of Ru and Au by ICP-AES. 32
Table IV.3. Ru determination based on the supernatant values. 34
Table IV.4. Ru and Au determination based on supernatant values. 35
Table A.1. Thermodynamic parameters assuming a static quenching, KSV. A3
Table A.2. Dynamic Light Scattering analysis of the nanoconjugates. A4
I. INTRODUCTION
1. Carbon Monoxide (CO)
Carbon monoxide is a colorless, tasteless and odorless gas formed upon combustion of carbon compounds when in a restrictive supply of molecular oxygen (O2) (Housecroft &
Sharpe 2005, p. 366). It is generally recognized by its toxicity when inhaled or in contact with organs, often with lethal consequences (Thom et al. 2006, Rose et al. 2016). These effects arise from the molecule’s ability to bind to metals present in metalloproteins (Boczkowski et al. 2006). The most well-known example is the binding to FeII of
hemoglobin (Hb), for which CO has an even higher affinity than O2 itself. This CO
complexation and the subsequent formation of carboxyhemoglobin (COHb) severely impairs the protein ability to release O2 to the tissues due to allosteric changes in the
tetramer (Rose et al. 2016). Although many assume that high blood levels of COHb alone are the cause of CO lethal and non-lethal toxicity, Goldbaum et al. dismissed this belief in an in vivo study with dogs (Orellano et al. 1976). Other studies indicate that its combined effects by inhibition of cytochrome c oxidase on mitochondria, free-radical generation and activation of the immune response are what contributes to the effects (Chance et al. 1970, Cooper et al. 2008, Rose et al. 2016).
Despite its bad reputation, in 1949 Sjöstrand established CO as an endogenous molecule by measuring its levels in the air exhaled by human subjects.Only in the late 60s, and in agreement with Sjöstrand observations of increased CO levels in conditions of abnormal blood cells degradation, it was found it to be a product of the Heme Oxygenase (HO) catalytic activity, which is the rate-limiting enzyme in the heme degradation pathway (Sjöstrand 1949, Tenhunen et al. 1968, Tenhunen et al. 1970).
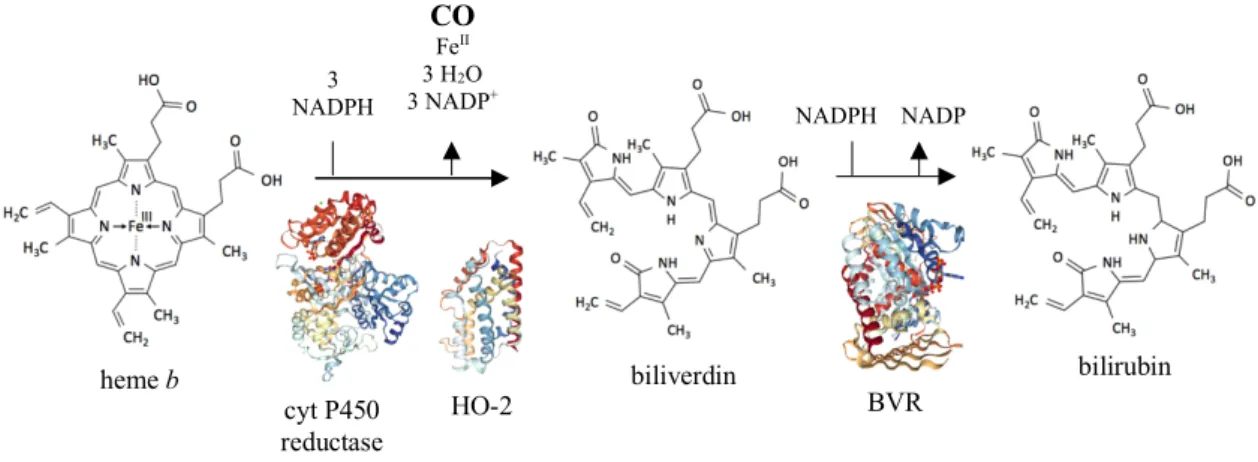
1.1. Heme Degradation Pathway
Heme is a coordination complex comprising an Fe ion coordinated to a tetrapyrrole ring (e.g. heme b, figure I.1). The ability to change its oxidation state according to the protein environment makes it an adaptable biological catalyst, present as a prosthetic group in several essential proteins in aerobic organisms (Bowman et al. 2008, Dutra et al. 2014). Regardless of its vital roles, free heme increases oxidative stress leading to cytotoxicity issues presumably via free radicals’ formation, thus highlighting the importance of this pathway (Larsen et al. 2012).
This enzymatic mechanism was first elucidated in 1969 by Tenhunen and his team. They observed the requirement for Nicotinamide Adenine Dinucleotide Phosphate (NADPH) and O2 in the process, implying the action of cytochrome P450 reductase as the electron
3 (Tenhunen et al. 1969). Later on, the heme degradation pathway was established as represented in figure I.1. (Tenhunen et al. 1970, Larsen et al. 2012, Otterbein et al. 2016).
There are two major isoforms of HO in mammals with catalytic activity, but different regulatory mechanisms: HO-1 is inducible and ubiquitously expressed, also called stress protein HSP32; whereas HO-2 is constitutive, mostly found in the brain and testes (Maines et al. 1986, Yachie et al. 1999).
1.1.1. Heme Oxygenase 1 (HO-1)
The upregulation of HO-1 occurs as a response to various stimuli such as hypoxia, inflammation, radiation, metal and pathogenic exposures, thus explaining why HO-1 is considered to be one of the most trustworthy indicators of oxidative stress in cells. (Vile et al. 1994, Poss et al. 1997, Maines 1997, Mann et al. 2007, Wegiel et al. 2013).
Additionally, HO-1-/- mice (Poss et al. 1997, Kapturczak et al. 2004), and one human case
(Yachie et al. 1999), displayed high and non-specific inflammatory changes, such as leukocytosis, hepatomegaly and lymph node swelling, as well as iron deposition.
Altogether, these data imply an important role for HO-1 in mammalian iron homeostasis, regulation of immune response and protection against oxidative damage (Kapturczak et al. 2004, Lin et al. 2007). The precise mechanism by which HO-1 exerts its protective effects it’s not fully understood. Even so, there are evidences suggesting its products play a fundamental role, namely CO. (Poss et al. 1997, Poss et al. 1997b, Zhang et al. 2014, Otterbein et al. 2016) heme b cyt P450 reductase HO-2 biliverdin bilirubin BVR 3 NADPH 3 O2 CO FeII 3 H2O 3 NADP+ NADPH NADP +
Figure I.1. Heme degradation pathway adapted from Spencer et al. (2014). HO cleaves the free heme at
the 𝛼-methene bridge, with the carbon atom then released as CO. Cytochrome P450 reductase is necessary to the HO activity as it provides the electrons from NADPH. In mammals, biliverdin is later converted to bilirubin by the cytosolic enzyme Biliverdin Reductase (BVR). (PDB IDs: 3QE2, cyt P450 reductase; 5UC8, HO-2; 2H63, BVR)
1.2. CO as an Endogenous Regulator
The first sign that CO was a neurotransmitter (Verma et al. 1993) led to an increase in research about possible endogenous regulatory functions alike nitric oxide (NO), another gasotransmitter with therapeutic potential formerly recognized.
In fact, and similar to NO, CO is considered to be an endogenous vasorelaxant with cardioprotective properties, partly by upregulating the production of cyclic guanosine 3’, 5’ – monophosphate (cGMP), a key regulator of vessel tone and neural transmission in the brain (Morita et al. 1995, Wang et al. 1997, Ling et al. 2017).
Beyond that, exogenous and endogenous CO were shown to prevent apoptosis, both the extrinsic and intrinsic pathways. HO-1/CO has a protector effect against the cytokine Tumor Necrosis Factor 𝛼 (TNF𝛼)-mediated apoptosis, dependent on the activation of the transcription factor Nuclear Factor 𝜅B (NF-𝜅B), together with activation of p38 Mitogen-Activated Protein Kinase (MAPK) (Brouard et al. 2002), and inhibition of caspase 8 pathway (Kim et al. 2006). Once again, both in rat primary pulmonary artery endothelial cells exposed to anoxia-reoxygenation (Zhang et al. 2003) as in human hepatocytes exposed to TNF𝛼 (Tsui et al. 2005), CO showed similar effects through activation of p38 MAPK.
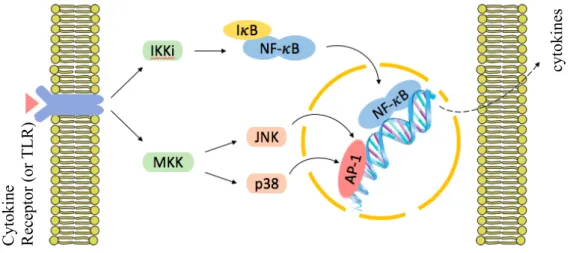
MAPKs are enzymes that connect receptors at the surface of the cell to vital regulatory targets inside, being p38 proteins and c-Jun N-terminal Kinase (JNK) signaling pathways part of this group (Johnson et al. 2007). The net of receptors responsible for their activation are numerous and complex, including pro-inflammatory cytokine receptors and Toll-like receptors (TLR). The later is responsible for recognizing Pathogen-Associated Molecular Patterns (PAMPs), as lipopolysaccharides (LPS) in bacterial cell wall (Jeffrey et al. 2007).
5 These enzymatic systems control several cellular mechanisms such as apoptosis, cell differentiation and production of inflammatory mediators by targeting transcription factors, just as NF-𝜅B and Activator Protein-1 (AP-1). In this way, these MAPK pathways can regulate gene expression, namely the production of more cytokines, as illustrated in figure I.2 (Chang et al. 2001, Jeffrey et al. 2007).
Cytokines are responsible for regulating and amplifying immune responses through several processes, namely by recruiting and activating leukocytes, promoting endothelial cell adhesion molecules expression, and increasing vascular permeability, among others, which ultimately leads to inflammation (Holdsworth et al. 2015).
Tuning into the scope of this work, of great interest are also the anti-inflammatory effects showed by CO, partly by acting on cytokine expression.
In a LPS-induced inflammation in macrophage, exogenous CO selectively inhibited the production of the pro-inflammatory cytokines Macrophage Inflammatory Protein-1𝛽 (MIP-1𝛽), 1 (IL-1𝛽) and TNF𝛼, while simultaneously increasing Interleukin-10 (IL-Interleukin-10), an anti-inflammatory one, through the p38 pathway and independently of cGMP, as confirmed by in vivo assays (Otterbein et al. 2000). In a mice model of sepsis, exogenous CO also decreased serum IL-1𝛽 and IL-6 levels. Further in vitro and in vivo studies suggested this effect to be linked to the JNK/AP-1 signaling pathway (Morse et al. 2003). cyt oki ne s C yt oki ne R ec ept or ( or T L R )
Figure I.2. Very simplified representation of the MAPK (JNK and p38 only) and NF-𝜅B signaling pathways.
MAPK are amplification cascades consisting of a three-kinase module: MAPK (not shown), MAPK Kinase (e.g. MKK) and MAPK Kinase Kinase (not shown). The complex I𝜅B Kinase (IKK) mediates NF-𝜅B translocation to the nucleus, via I𝜅B degradation. JNK and p38 pathways can also modulate NF-𝜅B activation dependent upon the stimuli (not shown) (Johnson et al. 2007, Jeffrey et al. 2007, Tornatore et
Other reports show similar results on suppressing pro-inflammatory cytokines (Hegazi et al. 2005, Chiang et al. 2013), including positive immunomodulatory effects after organ transplantation (Nakao et al. 2003, Nakao et al. 2005).
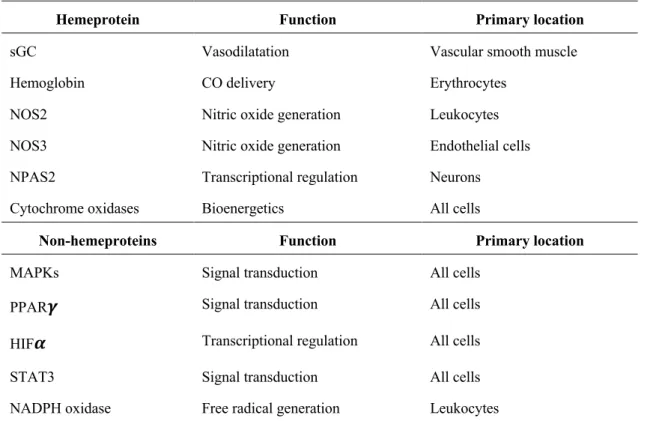
As already implied, CO does not act upon one single target (table I.1), but by interconnecting different signaling pathways (Wegiel et al. 2013).
Table I.1. Overall CO targets adapted from Wegiel et al (2013).
Hemeprotein Function Primary location
sGC Vasodilatation Vascular smooth muscle
Hemoglobin CO delivery Erythrocytes
NOS2 Nitric oxide generation Leukocytes
NOS3 Nitric oxide generation Endothelial cells NPAS2 Transcriptional regulation Neurons Cytochrome oxidases Bioenergetics All cells
Non-hemeproteins Function Primary location
MAPKs Signal transduction All cells
PPAR𝜸 Signal transduction All cells
HIF𝜶 Transcriptional regulation All cells
STAT3 Signal transduction All cells
NADPH oxidase Free radical generation Leukocytes
1 sGC, soluble Guanylate Cyclase; NOS, Nitric Oxide Synthase; NPAS, Neuronal PAS Domain; PPAR𝛾,
Peroxisome Proliferator Activator Receptor 𝛾; HIF𝛼, Hypoxia Inducible Factor 𝛼; STAT3, Signal Transducer and Activator of Transcription.
Research on CO properties and mechanisms of action subsist today, making it the most comprehensively studied product of HO catalysis and the only one being translated into clinical use (Mann et al. 2007, Ling et al. 2017).
CO’s inherent chemical stability and its restricted reactivity towards transient metals might make it a likely candidate for clinical applications (Romão et al. 2012). Even so, its low solubility in water and the potential harmful outcomes of a therapeutic centered on its gaseous form, both stand as key hindrances regarding its benefits (Ismailova et al. 2018).
CO-Releasing molecules (CORMs) arose as an answer on how to deliver therapeutic amounts of the molecule in a safe manner, by releasing CO upon certain triggers (Romão
7 et al. 2012). This discharge can be accomplished in different ways, as by a solvent-induced ligand exchange, a light stimulus (photo-CORMs), an enzyme (ET-CORMs) and less commonly, a change in pH, temperature or through an oxidation process (Ling et al. 2017). Additionally, contrary to inhaled CO, these molecules seem to be able to distribute CO to tissues with less formation of COHb (Bergstraesser et al. 2012).
2. Metal Based CORMs
Metal based CORMs are one of the most promising approaches due to the strong interactions between transition metals and CO. Moreover, the flexibility of molecular design by changing the CO neighboring ligands offers the possibility to tune its release, or even to target the complex (Schatzschneider 2015).
2.1. CO-Releasing Molecule 3 (CORM-3)
Tricarbonylchloro(glycinato)ruthenium (II) (CORM-3) (figure I.3), with the chemical formula of [fac-Ru(k2
-H2NCH2CO2)(CO)3], is an example of a metal CORM,
reported by Motterlini et al. to have therapeutic properties due to CO release when in a buffer solution, by a solvent-triggering process (Motterlini et al. 2003, Clark et al. 2003, Chaves-Ferreira et al. 2015). It is by far one of the most well studied and extensively characterized molecule of its kind, being continuously used to bring novel insides on CO effects both in vitro as in vivo. The physicochemical properties of this complex rules its CO discharge and how it interacts with proteins, ultimately dictating its pharmacokinetic profile. Therefore, a brief description on these subjects is given below.
2.1.1. Physicochemical Properties
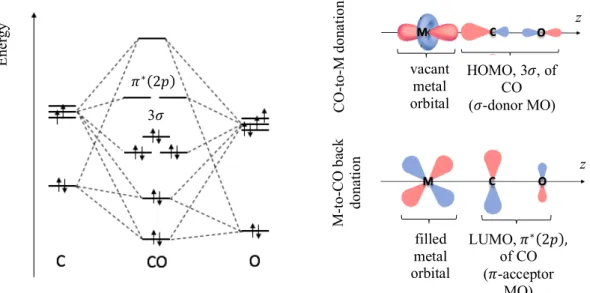
CORM-3 is a metal carbonyl complex soluble in water, in which the metal center is ruthenium (Ru) with an oxidation state of + 2, meaning an electronic configuration of [Kr]4d6. According to the Molecular Orbital (MO) theory, the Highest Occupied
Molecular Orbital (HOMO) of CO overlaps with the symmetrically adapted one of the metal, forming a 𝜎-donor interaction. Even though usually this bond alone is not enough to hold the ligand to the metal, there is also a back-donation between the filled d orbitals of the metal and the vacant Lowest Unoccupied Molecular Orbital (LUMO) of CO (figure I.4). This synergic effect strengthens the interaction and is the reason behind the particular stability of carbonyl complexes of metals in the 6th and 10th group of the periodic table,
like Ru itself. (Housecroft & Sharpe 2005, p. 44, Motterlini et al. 2003, Schatzschneider 2015)
Figure I.3. Chemical structure
of CORM-3, adapted from Motterlini et al. (2003).
As previously stated, Motterlini et al. assessed the ability of CORM-3 to release CO in a 1:1 ratio, by measuring the formation of carboxy-myoglobin (Mb-CO) in the presence of deoxy-myoglobin, by the so-called myoglobin assay (Clark et al. 2003). Still, in a study using an amperometric CO sensor to directly measure CO release in phosphate buffer, pH 7.4, no CO was detected neither from CORM-3 nor CORM-2, which is another Ru-based CORM (Desmard et al. 2012). Later on, it was found that the sodium dithionite used to reduce all myoglobin prior to the myoglobin assay influences the CO release in a concentration-depended manner. At that point, evidences suggested the need of a complex environment, such as the intracellular milieu, for the release of CO by Ru-based CORMs (McLean et al. 2012).
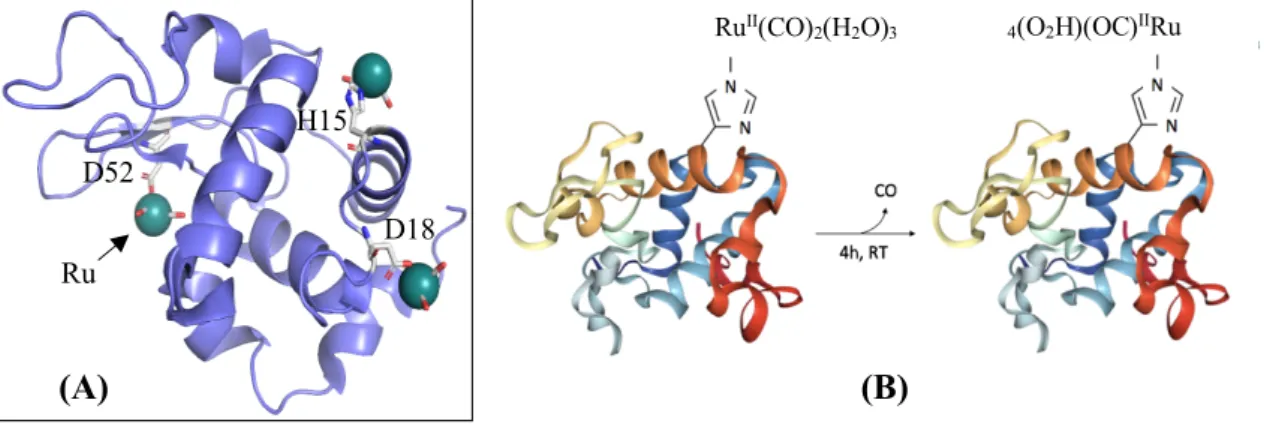
Another study using Gas Chromatography-Thermal Conductivity Detection (GC-TCD) gave similar results with no CO detected when CORM-3 was dissolved in various aqueous solutions. Most importantly, it showed that CORM-3 binds covalently to proteins by histidine and aspartate residues, forming protein-RuII(CO)2 adducts (figure I.5, A).
This crystallographic evidence suggests that during the formation of such adducts, the non-CO ligands of CORM-3 are discarded, as well as one CO molecule. Nevertheless, no CO was directly detected, only Carbon Dioxide (CO2) (Santos-Silva et al. 2011).
This CO2 can be understood considering a Water-Gas Shift Reaction (WGSR) mechanism
(Seixas et al. 2014, Chaves-Ferreira et al. 2015), where H2 and CO2 are produced from
CO and H2O. The precise mechanism by which ruthenium carbonyls catalyze this
E ne rgy HOMO, 3𝜎, of CO (𝜎-donor MO) vacant metal orbital CO -to -M don at ion M -to -C O ba ck dona tion filled metal orbital LUMO, 𝜋∗(2𝑝), of CO (𝜋-acceptor MO) z z 3𝜎 𝜋∗(2𝑝)
Figure I. 4. Qualitative molecular diagram of CO according to MO theory (left). Components of the
Ru-CO bonding, assuming the z-axis as an example (right). Both representations are adapted from Housecroft & Sharpe (2005).
9 reaction in not completely understood. Yet, there is consensus in the first step being an attack of a hydroxide (OH-) to a CO ligand yielding a metallocarboxylic acid (M-COOH),
followed by a second step of decarboxylation. In this way, the release of the CO ligand would be in the form of CO2 (Chen et al. 2012, Schulz et al. 2013, Stepic et al. 2019).
This was further confirmed by crystallographic evidences of a COOH ligand still bound to Ru in a Hen Egg-White Lysozyme (HEWL) adduct (Seixas et al. 2014).
In a study using a CO-selective fluorescent probe (COP-1), Chaves-Ferreira et al. observed an increase in fluorescence in phosphate buffer, pH 7.4, and in cells, both incubated with BSA-RuII(CO)2 and HEWL-RuII(CO)2 adducts. As previously proposed
by Santos-Silva et al., this further hinted that the process of interaction with proteins is responsible for the CO release as in figure I.5 (B), and not CORM-3 by itself, a WGSR catalyst. Additional mass spectrometry measurements predicted an average of 7 modified His residues in Bovine Serum Albumin (BSA) upon binding.
Although there is still some controversy around CO release from Ru-based CORMs, these adducts results, along with all the evidences of CORM-3 mimicking CO properties, point that CO is released from this metal complex and able to exert biological activity within cells (Seixas et al. 2014, Chaves-Ferreira et al. 2015). Hence, a brief description on the anti-inflammatory effects showed by CORM-3 so far is given below.
2.1.2. Biological Activity
Sawle et al. showed that CORM-3 at 10 to 100 µM can attenuate LPS-induced inflammation. Using mice macrophages, it reduced TNF𝛼 production and nitrite levels in a concentration-depended manner, with no apparent effect on iNOS expression. Cell
(B)
Figure I.5. Molecular models of protein-CORM interactions. (A) HEWL (in blue) residues (His15, Asp18 and
Asp52, coloured by element) bound to three moieties of CORM-3 (coloured by element), prepared using
PyMOL software, (PDB IDs: 6XJW, Santos-Silva et al. 2011). (B) CO release from HEWL-RuII(CO)
2 adducts,
adapted from Chaves-Ferreira et al. (2015). The His15 residue accurate position in the tertiary structure
was not considered in this illustration, (PDB IDs: 6HY4, HEWL).
RuII(CO) 2(H2O)3 4(O2H)(OC)IIRu CO 4h, RT D52 D18 H15 (A) Ru
viability was not affected, dismissing possible cytotoxic effects. However, by following changes in glutathione levels they found that cellular exposure to more than 50 µM of CORM-3 promotes some stress. (Sawle et al. 2005) Bani-Hani et al. got similar results using a model of thrombin and/or Interferon gamma (IFN-𝛾)-induced neuroinflammation in mice BV-2 microglia. Neither p38 nor JNK pathways seemed to be mediating this salutary effect. (Bani-Hani et al. 2006) In Collagen-Induced Arthritis (CIA) mice model of Rheumatoid Arthritis, Ferrándiz et al. showed that 5 and 10 mg Kg-1 of CORM-3
reduces the production of the proinflammatory cytokines IL-1𝛽, TNF𝛼, IL-6, IL-2 and IFN-𝛾 while enhancing IL-4, an anti-inflammatory mediator. Another in vivo study using the 2,4,6-Trinitrobenzene Sulfonic Acid (TNBS)-induced colitis mice model, established the ability of 10 mg Kg-1 of CORM-3 to significantly reduce the inflammatory response
by decreasing the mRNA levels of the pro-inflammatory cytokines IFN-𝛾, TNF𝛼 and IL-17A, in CD4+ T cells (Ferrándiz et al. 2008, Fukuda et al. 2014).
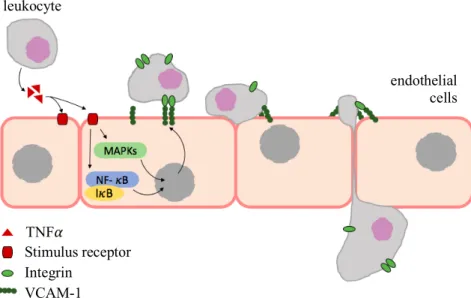
During inflammation endothelial cells are stimulated by cytokines to express new cell-surface proteins, such as Intercellular Adhesion Molecule-1 (ICAM-1) and Vascular Cell Adhesion Molecule-1 (VCAM-1), capable to interact and arrest leukocytes, as represented in figure I.6 (Pober 2002, Ley et al. 2007).
In two mice models of acute inflammation, CORM-3 successfully reduced the high numbers of peritoneal Polymorphonuclear Neutrophil (PMN) leukocytes by reducing their levels of adhesion molecules CD11b (an integrin) and L-selectin. Further in vitro studies using human cells, stablished PMN activation and migration upon the
TNF𝛼 Stimulus receptor Integrin VCAM-1 leukocyte endothelial cells
Figure I.6. VCAM-1-mediated leukocyte adhesion and migration across
endothelial cells, adapted from Kong et al. (2018). Leukocytes secrete TNF𝛼 which up-regulates VCAM-1 in endothelial cells. This event promoted the accumulation of leukocytes at inflammation sites.
11 endothelium as a likely target of CORM-3 anti-inflammatory effect in vivo (Urquhart et al. 2007).
Serizawa et al. assessed the ability of this metal complex to suppress the adhesion molecule VCAM-1 expression in human brain endothelial cells exposed to LPS, therefore inhibiting PMN adhesion through the JNK/AP-1 signaling pathway. In 2012, Bergstraesser et al. confirmed a loss of proadhesive phenotype in Human Umbilical Vein Endothelial Cells (HUVECs) exposed to TNF𝛼, but due to p38 inhibition and/or damages in the mitochondrial respiratory chain (Bergstraesser et al. 2012, Serizawa et al. 2015). All the above data suggest that CORM-3 further moderates the inflammatory response in vivo by reducing the interaction between leukocytes and endothelial cells (Ferrándiz et al. 2008).
Additionally, it is important to mention that the inactive form of CORM-3 (iCORM-3, i.e. CORM-3 left in solution for 24 h in order to lose its CO ligands) failed to reproduce the same results (Sawle et al. 2005, Ferrándiz et al. 2008, Serizawa et al. 2015). iCORM-3 arose in early studies in order to distinguish the biological effects of the metal structure itself (as well as degradation products) from CO’s. However, such specie is not fully characterized and, in fact, iCORM-3 should be a mixture of water and CORM-3 products, still retaining a part of inert CO ligands (Seixas et al. 2013).
Finally, given the broad biological properties of CORMs, there are various diseases in which these molecules could play a therapeutic role (Ling et al. 2018), one of those being Rheumatoid Arthritis.
3. Rheumatoid Arthritis
Rheumatoid Arthritis (RA) is an autoimmune disease with unknown cause but with genetic susceptibility, affecting 1-2% of the worldwide population, with prevalence in woman (McInnes et al. 2011, Kumar et al. 2016).
This medical condition pathophysiology is uncertain and characterized by synovial inflammation and swelling on the joints, bone and cartilage degradation, as well as some systemic features such as pulmonary and cardiovascular complications (McInnes et al. 2011).
The synovial membrane (or synovium) is comprised of connective tissue covering joints cavities. The unrestrained infiltration of leukocytes in these tissues promotes the activation of osteoclasts cells and Fibroblast-Like Synoviocytes (FSL) in the joint. This phenomenon leads to swelling and bone destruction caused by the production of proteases by these cells, as well as extra tissue formation (pannus) by abnormal cell proliferation. (Townsend 2014)
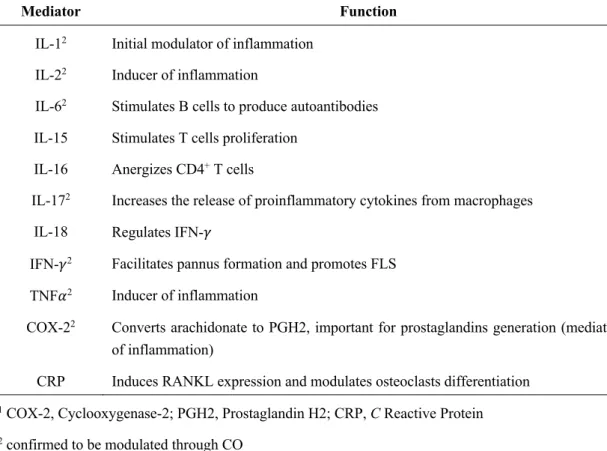
The uncontrolled action of diverse inflammatory mediators contributes to RA pathogenesis as listed in table I.2.
Table I.2. Some mediators implicated in RA adapted from Kumar et al. (2016).
Mediator Function
IL-12 Initial modulator of inflammation
IL-22 Inducer of inflammation
IL-62 Stimulates B cells to produce autoantibodies
IL-15 Stimulates T cells proliferation IL-16 Anergizes CD4+ T cells
IL-172 Increases the release of proinflammatory cytokines from macrophages
IL-18 Regulates IFN-𝛾
IFN-𝛾2 Facilitates pannus formation and promotes FLS
TNF𝛼2 Inducer of inflammation
COX-22 Converts arachidonate to PGH2, important for prostaglandins generation (mediators
of inflammation)
CRP Induces RANKL expression and modulates osteoclasts differentiation
1 COX-2, Cyclooxygenase-2; PGH2, Prostaglandin H2; CRP, C Reactive Protein 2 confirmed to be modulated through CO
The most common treatments for RA are synthetic drugs, only able to ameliorate pain and slow down symptom’s progression. These include Nonsteroidal Anti-inflammatory drugs (NSAIDs) that inhibit cyclooxygenases (COXs) (e.g. Aspirin and Celecoxib), Disease Modifying Anti Rheumatic Drugs (DMARDs) that regulate cytokine action (e.g. Methotrexate), and Corticosteroids, also with immunoregulatory effects (e.g. Dexamethasone). However, frequent side-effects and lack of some patient’s response urges the development of new strategies. (Kumar et al. 2016)
RA inflammatory signature makes this disease one of the most likely candidates for a CO-based therapy, as already assessed in different reports (Takagi et al. 2009, Maicas et al. 2010, Ibáñez et al. 2012).
In the past century some Au compounds were used to treat RA, e.g. Auranofin. However, and as mentioned before, their use was replaced by novel agents. Nonetheless, some believe there is still room for gold-based products in RA therapy, only this time in the form of nanoparticles (Faa et al. 2018).
13
4. Gold Nanoparticles in Medicine
Materials having between 1 to 100 nm are called nanomaterials. This nanoscale size is responsible for the distinctive physicochemical characteristics not seen in bulkier forms. (Lopez-Chaves et al. 2017)
AuNPs are probably the best example of these nanomaterials practical value in medicine, as for imaging, photothermal therapy, bio-sensing and drug-delivery purposes (Kong et al. 2017). This is partly due to their unique light-matter interaction properties, responsible for the red color seen in colloidal AuNPs (10 – 30 nm) (Chow et al. 1994). Their surface electrons (plasmon) oscillate collectively and confined in a narrow space, contrary to the bulk form (yellow), hence the so-called Localized Surface Plasmon (LSP). When a resonance condition is met, and the frequency of irradiated light matches the frequency of this plasmon, the absorption of light is maximum. This LSP is very sensitive and changes its resonance frequency upon changes in its environment, making interactions between AuNPs and biomolecules relatively easy to follow by spectrophotometric methods, as displayed in figure I.7. (Sperling et al. 2008, Panahi et al. 2017, Kong et al. 2017)
Due to a high surface-to-volume ratio and affinity towards thiol (-SH) and amine (-NR3)
groups, AuNPs can be functionalized with a large range of molecules, such as oligonucleotides, polyethylene glycol (PEG) and proteins (Raposo et al. 2007, Fernandes et al. 2017, Veigas et al. 2019) Moreover, AuNPs biocompatibility and ability to conjugate such elements in water phase reactions are major advantages regarding in vivo administration as well as targeting, making AuNPs suitable systems for drug delivery. (Porcaro et al. 2016, Fernandes et al. 2017, Lopez-Chaves et al. 2017). Therefore, a
naked AuNP
AuNP functionalized with PEG (AuNP@PEG)
AuNP aggregation A bs or ba nc e (A Wavelength (nm)
Figure I.7. Localized surface plasmon resonance peaks. AuNP SPR shift before (naked AuNP) and after
functionalization with a biomolecule (AuNP@PEG). When AuNPs aggregate the shift is evident even at naked eye, as highlighted by the curve’s different colour.
vectorization of CORM-3 using gold nanoparticles could be a valuable strategy towards better efficiency.
15 II. OBJECTIVES
One way to improve the effect of pharmacological agents within tissues is to deliver them to the action sites. Considering all the anti-inflammatory effects of CORM-3 described in the introductory section, the development of novel nanoconjugates@CORM-3 using gold nanoparticles might enhance the effects of CORM-3. With this in mind, one of the most important aims of this work was to:
i) study CORM-3 interaction with albumin, BSA, in order to develop a nanoconjugate that includes both species - AuNP@PEG@BSA@CORM-3. UV-Vis spectroscopy and fluorescence quenching studies were used to assess conformational changes in the protein and to examine the magnitude and stability of the interaction BSA-CORM-3, after which the synthesis and characterization of AuNP@PEG@BSA@CORM-3 began.
During this work, such nanoconjugate showed improved anti-inflammatory effects in vitro when compared to free CORM-3 (Fernandes et al. 2020). To further understand the biological effects and therapeutic potential of AuNPs@PEG@BSA@CORM-3 compared to free CORM-3, additional in vitro and in vivo studies were needed. Consequently, two complementary goals were set:
ii) Inductively Coupled Plasma-Atomic Emission Spectroscopy (ICP-AES) analysis to compare the cellular uptake of CORM-3 when in the nanoconjugate and in the free form; iii) In vivo assays in an Adjuvant-Induced Arthritis (AIA) rat model that mimics human Rheumatoid Arthritis.
III. MATERIALS AND METHODS
1. UV-Vis Spectroscopy
CORM-3 (Sigma-Aldrich) and BSA (Sigma-Aldrich) were dissolved in a 10 mM, pH 7, phosphate buffer solution containing 0.15 M NaCl. Seven samples of BSA at 8 µM and CORM-3 at 600, 400, 300, 200, 100, 50 and 25 µM, were prepared following a serial dilution, plus one left with BSA alone. BSA samples were prepared prior to CORM-3’s preparation and addition, also dissolved in the same buffer. Absorbance measurements were performed at different incubation times (10 min, 1 h and 24 h), at room temperature. A sample of CORM-3 at 400 µM was prepared in the same buffer and its absorbance was recorded several times during a period of three days.
All spectra were recorded in a range of 200 – 400 nm, on a UVmini-1240 UV-VIS Spectrophotometer (Shimadzu). Replicates were made for each sample.
2. Fluorescence Quenching
CORM-3 and BSA were dissolved in a 10 mM, pH 7, phosphate buffer solution containing 0.15 M NaCl. Seven samples of BSA at 2 µM and CORM-3 at 100, 50, 25, 12.5, 6.25, 3.125 and 1.5625 µM were prepared following a serial dilution, plus one left with BSA alone. Considering the decomposition of the metal complex, BSA samples were prepared prior to CORM-3’s preparation and addition, also dissolved in the same buffer. Fluorescence measurements were performed at different incubation times (1 and 24 h) and different temperatures (298, 302, 306 and 310 K).
Emission spectra were recorded in a range of 300 – 425 nm upon excitation at 295 nm, on a Cary Eclipse Fluorescence Spectroscopy (Agilent). Replicates were made for each sample.
3. AuNP@PEG@BSA@CORM-3 Preparation
3.1. AuNP Synthesis
Standard AuNPs (15 nm) already synthetized in the laboratory (Nanomedicine lab., Departamento de Ciências da Vida – DCV, in FCT-UNL) were used to carry out functionalization. This colloidal solution was prepared using the citrate reduction method, described by Lee and Meisel (Lee et al. 1982), and characterized by UV-Vis spectroscopy, on a UVmini-1240 UV-VIS Spectrophotometer (Shimadzu), and by Dynamic Light Scattering (DLS), on a SZ-100 instrument (Horiba).
17
3.2. AuNP@PEG Functionalization
AuNPs were incubated overnight at 10 nM, with 0.028% (w/v) Sodium Dodecyl Sulphate (SDS) (Sigma) and a heterobifunctional PEG, HS-PEG(8)-COOH, (Iris Biotech) at 0.01 mg mL-1 in milli-Q H2O, under agitation at room temperature.
After a 16 hours incubation period, the solution was centrifuged (Sigma 3-16K) at 14 000 g for 30 min at 4 °C and the supernatant stored in new eppendorfs in order to quantify the excess of PEG by the Ellman’s assay. The pellet was then washed with milli-Q H2O and
centrifuged in the same conditions as before, thrice.
A solution of 5,5’-Dithiobis(2-nitrobenzoic acid) (DTNB) (Sigma) was prepared at 1.5 mg mL-1 and used as the Ellman’s reagent. Ten solutions of the same PEG, at between
0.001 and 0.1 mg mL-1, were prepared in order to do the calibration curve. The Ellman’s
assay was performed right after the washes using a 96-well plate, by adding the same amount of Ellman’s reagent and sample per well. After 15 min the plate was read at 412 nm using a plate reader Infinite M200 (Tecan).
The AuNPs@PEG hydrodynamic diameter was characterized by DLS and the concentration accessed by UV-Vis spectroscopy, through by their SPR peak, with 𝜀 = 2.33 × 10FG M-1 cm-1.
3.3. AuNP@PEG@BSA Functionalization
The previously prepared AuNPs@PEG solution was incubated at 21 nM with 1.25 mg mL-1 of sulfo-NHS (Sigma-Aldrich) and 0.312 mg mL-1 of EDC
(Sigma-Aldrich), in 10 mM 2-(N-morpholino)ethanesulfonic acid (MES) (Sigma), pH 6.0, for 30 minutes under agitation at room temperature. Later, the solution was centrifuged at 14 000 g for 30 min at 4 °C and the supernatant replaced to the original volume by 2.5 mM MES, pH 6.1. BSA (Sigma-Aldrich) was immediately added at 10 µg mL-1 and the
resulting solution was left overnight under agitation at room temperature.
After a 16 hours incubation period, the solution was centrifuged at 14 000 g for 30 min at 4 °C and the supernatant stored in new eppendorfs in order to quantify the excess of BSA by the Coomassie Plus (Bradford) assay. The pellet was then washed with milli-Q H2O and centrifuged in the same conditions as before, twice.
Ten solutions of BSA at between 20 and 4 µg mL-1, were prepared in order to do the
calibration curve. The Coomassie Plus (Bradford) assay (Sigma Aldrich) was performed right after the washes using a 96-well plate, by adding the same amount of Coomassie reagent and sample per well. After a 10 minutes period the plate was read at 595 nm.
The AuNPs@PEG@BSA hydrodynamic diameter was characterized by DLS and the concentration accessed by UV-Vis spectroscopy, through by their SPR peak, with 𝜀 = 2.33 × 10FG M-1 cm-1.
3.4. AuNP@PEG@BSA@CORM-3 Functionalization
The previously prepared AuNPs@PEG@BSA solution was incubated at 6 nM with 6 µM of CORM-3, for 10 minutes under agitation at room temperature. The solution was centrifuged at 12 000 g for 30 min at 4 °C and the pellet resuspended in autoclaved PBS. The AuNPs@PEG@BSA@CORM-3 hydrodynamic diameter was characterized by DLS and the concentration accessed by UV-Vis spectroscopy, through by their SPR peak, with 𝜀 = 2.33 × 10FG M-1 cm-1.
3.5. DLS Analysis
The Dynamic Light Scattering analysis was performed at 25 °C with a scattering angle of
90°. Samples of AuNPs, AuNPs@PEG, AuNPs@PEG@BSA and
AuNPs@PEG@BSA@CORM-3 were prepared in milli-Q H2O with 1 nM concentration
each. The hydrodynamic diameters were determined using the average results of 3 measures for each specie.
4. THP-1 Cell Culture
THP-1 human acute monocytic leukaemia cells were grown in Roswell Park Memorial Institute medium (RPMI) (Invitrogen) supplemented with 1 % (v/v) antibiotic/antimycotic solution (Pen-Strep+antimycotic: 10 000 units mL-1 of penicillin,
10 000 µg mL-1 of streptomycin and 25 µg mL-1 of Funizone® Antimycotic; Invitrogen)
and 10 % (v/v) Fetal Bovine Serum (FBS) (Invitrogen), together called Complete Culture medium Recipe (CCR). Cells were kept at 37 °C in a 99 % humidified atmosphere of 5 % (v/v) CO2 (CO2 Incubator Leec, UK), in 75 cm2 culture flasks.
4.1. Cell Count
A solution containing 50 µL of cellular suspension, 350 µL of CCR and 100 µL of 0.4 % (w/v) trypan blue (Sigma) was prepared and placed on a hemocytometer (Hirschmann). The viable cells were measured using an inverted microscope. Only non-colored cells are considered viable. After cell counting, cell density was determined as in Equation III.1:
(III.1) 𝑁IJKLM, .,MMO⁄𝑚𝐿= STUVWXY ZYXX[ × \JM]^J_` aK.^_b × '1c
` ,
with 𝑛 being the number of squares in the hemocytometer used to quantify the viable cells (𝑁IJKLM, .,MMO), and 104 the chambers volume in mm3.
19
5. Evaluation of the Inflammatory Response in vitro
THP-1 cells were seeded at a concentration of 106 cells well-1 in 6-well plates and exposed
to 700 ng mL-1 of lipopolysaccharide (LPS, Sigma) for 2 h. After that period, 0.25 µM of
free CORM-3 (and inactive form – iCORM-3) or 1 nM of
AuNPs@PEG@BSA@CORM-3(loaded with 0.25 µM of both active and inactive forms of CORM-3) were added for 3 h. Afterwards, the cells were harvested, centrifuged for 5 min at 200 g, at room temperature, and the total RNA extracted from cells pellets using TRIsure (Bioline) according to the manufacturer’s instructions.
The total RNA (100 ng) was reverse transcribed using the NZY M-MuLV First-Strand cDNA Synthesis kit (Nzytech). The expression of the inflammation-related genes TNF-α and IL-6, as well as the housekeeping gene RNA18S, was determined by RT-qPCR, performed on a Corbett Rotor-Gene 6000 thermal cycler (Qiagen), using HOT FIREPol EvaGreen qPCR Mix according to the manufacturer’s instructions (Solis BioDyne). RT-qPCR conditions were: an initial denaturation at 95 ºC for 15 min followed by 10 cycles of denaturation at 95 ºC (20 seconds), annealing at 50 ºC (20 seconds) and extension at 72 ºC (20 seconds), and an additional 20 cycles of denaturation at 95 ºC (20 seconds), annealing at 53 ºC (20 seconds) and extension at 72 ºC (20 seconds). The following primer sequences were used:
RNA18S: Fwd, 5’-GTAACCCGTTGAACCCCATT-3’ Rev, 5’-CCATCCAATCGGTAGTAGCG-3’ TNF-α: Fwd, 5’-CCAGGCAGTCAGATCATCTTCTC-3’ Rev, 5’-TATCTCTCAGCTCCACGCCA-3’ IL-6: Fwd, 5’-GGTACATCCTCGACGGCATCT-3’ Rev, 5’-TCTTTGCTGCTTTCACACAT-3’
This experimental procedure was performed by Rita Mendes (Fernandes et al. 2020).
6. ICP-AES Experimental Assays
THP-1 cells were placed in 25 cm2 culture flasks in CCR, at a cell density of
5x10⁵ cells mL-1. Cells were then incubated with CORM-3 at both 2 µM and 5 µM for 1,
Table III.1. ICP-AES sample preparation.
AuNP@PEG@BSA@CORM-3 CORM-3
Concentration 8 nM 2 µM 5 µM
Incubation time
(hours) 1 3 6 1 3 6 1 3 6
Note. 5 flasks with THP-1 cells alone were also left in the incubator for 6h in order to do the calibration
curve
Past the incubation times, cells were centrifuged for 5 min at 300 g, 15 °C. The pellet was then washed with 1 mL of PBS and centrifuged in the same conditions as before. Both supernatants were placed together and 1 mL of aqua regia was added separately to both supernatant and pellet samples.
The quantification of Ru was determined for both fractions of all the assays. Au was simultaneously determined for the AuNP@PEG@BSA@CORM-3 assays.
The ICP-AES quantification of Ru and Au was performed as a contracted service at Laboratório de Análises – Serviço de Espectroscopia de Emissão Atómica, FCT-UNL, Departamento de Química (DQ).
7. Animals and Experimental Procedure
Twenty 8-weeks old female Winstar AIA rats (± 200 g) were purchased from Charles River Laboratories International and kept under Specific Pathogen Free (SPF) conditions at Instituto de Medicina Molecular (iMM, Lisbon University). The inoculation with Mycobacterium tuberculosis was done by a subcutaneous injection in the animals’ right paw, promoting a systemic inflammation. CORM-3 formulations prepared in PBS were injected intraperitoneally at a dose of 0.037 mg Kg-1 after 4 days of RA induction, using
BSA as a carrier in a 1:5 ratio, respectively – named BSA@CORM-3 (treatment group, N = 5). Healthy (N = 5), non-treated arthritic (RA) (N = 5) and BSA@iCORM-3-injected (N = 5) rats were used as controls.
A larger BSA@CORM-3 formulation was freshly prepared each day in order to use the remaining as BSA@iCORM-3 in the following.
The body weight and inflammatory scores were measured throughout the time of treatment. The inflammatory scores were covered using a scale of 0 to 3 (0 – absence, 1 – erythema, 2 – erythema and swelling, 3 – deformities and functional damage), for each paw. The sum of each paw score defines the total inflammatory score per animal. Rats were sacrificed by CO2 narcosis after 15 days of treatment. Blood, paws and bone samples
21
7.1. Histology
Left hind paw samples collected after sacrifice were immediately fixed in 10 % neutral buffered formalin solution and then decalcified in 10 % formic acid. Samples were later dehydrated, embedded in paraffin, serially sectioned and stained with hematoxylin and eosin for examination of structural changes as well as cellular infiltration. Histopathological evaluation was done in a blinded fashion as a contracted service at iMM, using the semi-quantitative scores: Sublining Layer infiltration score (0 – none to diffuse infiltration, 1 – lymphoid cell aggregate, 2 – lymphoid follicles and 3 – lymphoid follicles with germinal center formation); Lining Layer cell number score (0 – fewer than three layers, 1 – three to four layers, 2 – five to six layers and 3 – more than six layers), Bone Erosion score (0 – no erosions, 1 – minimal, 2 – mild, 3 – moderate and 4 – severe erosions), Cartilage Surface (0 – normal, 1 – irregular, 2 – clefts and 3 – clefts to bone), and Global Severity score (0 – no signs of inflammation, 1 – mild, 2 – moderate and 3 – severe inflammation).
7.2. Statistical Analysis
Statistical differences between two groups were estimated by the Mann-Whitney test and between more than two by the Kruskal-Wallis test, using GraphPad Prism. Differences were considered statistically significant for P < .05.
IV. RESULTS AND DISCUSSION
1. BSA and CORM-3 Interaction Studies
Albumin (MW of ± 67 KDa monomer) is the most abundant plasma protein in humans and the main carrier of metabolites, hormones and drugs in the bloodstream (Ghuman et al. 2005). The pharmacokinetics, and ultimately the effectiveness of a drug, depends on how it interacts with this protein, explaining the importance of binding studies between both in the process of drug development. (Hu et al. 2004, Koly et al. 2015, Suryawanshi et al. 2016)
While being one of the most evolutionary variable proteins, it has three structurally homologous domains, I, II and III, each further divided in subdomains A and B, as in figure IV.1, with distinctive binding properties and an uncommon pattern of 17 disulfide bridges, explaining its very high stability (Bujacz 2012, Sekula et al. 2013).
Human Serum Albumin (HSA) and BSA share more than a 75 % homology, both structural and sequential (see Appendix 1, HSA and BSA Homology). Because of such similarities, together with a high stability and easy accessibility, BSA is often used in affinity and kinetic studies instead of HSA (Bujacz 2012). These studies often include UV-Vis spectroscopy and fluorescence type of analysis (Xu et al. 2013), used in the present work in order to better characterize CORM-3’s interactions with albumin.
1.1. UV-Vis Spectroscopy
1.1.1. CORM-3 Decomposition
The decomposition of CORM-3 in the working buffer was also followed by UV-Vis spectroscopy during three days (figure IV.2).
180 o I A I B IIA IIB III A III B IIB IIA I A I B III A III B
Figure IV.1. BSA domains and subdomains in different colors and
shades, using PyMOL software (PDB ID: 3V03). The labelling was based on uniprot.org (entry P02769) and Majorek et al. (2012).
23 The interpretation of metal complexes absorption spectra is not always straightfoward and can become very complex. Even so, some considerations can be made. The first and more intense band is here atributted to glycinate intra-ligand transitions (𝜋 → 𝜋∗
character) (Bento et al. 1988, Pretsch et al. 2009, p. 47 and 48), not changing significantly over time. A pronounced decrease in absorbance between wavelengths of ± 250 – 295 nm becames apparent and stabilizes over time, with two bands clearly distinguishable – one more intense at ± 250 nm and a sholder at ± 290 nm. Other reports state a less intense and energetic band at such wavelenghts due to a charge transfer between Ru and the glycinate ligand (Yeh et al. 1980, Chagas et al. 2017), and between d6 metals and
carbonyl ligands (Gray et al. 1963). Therefore, the decrease in absorbance observed would be explained by the loss of those ligands.
In order to study this decomposition in more detail, the values recorded at 285 nm were normalized (see Appendix 1, Data Normalization) and plotted against time. The general equation IV.1 was used to describe the resulting exponential decay in figure IV.2, panel B.
(IV.1) f(x) = f(0) × eFij,
where f(0) is the initial absorbance at 285 nm, k the degradation rate constant and t the time, in seconds (Schultz 1997, Groch 1998, Leike 2002). A non-linear fitting of this equation to the experimental data was done using the least square method with Solver in Excel, which provided equation IV.2, with ∑Χ) = 0.013.
(IV.2) Abs)Gp qr(t) = 0.8385 × eF1.11)v j 0 0,2 0,4 0,6 0,8 1 0 300 600 900 1200 No rm al iz ed A bs (2 85 n m ) Time (s) Experimental Teoretical 0 0,8 1,6 2,4 3,2 200 250 300 350 400 Ab so rb an ce (AU ) Wavelength (nm) t < 24 h 24 h < t < 48 h 48 h < t < 72 h A B Theoretical Gly (𝜋 → 𝜋∗) CTs
Figure IV.2. Decomposition of CORM-3 in the working buffer. (A) UV-Vis absorption spectra of CORM-3
at 400 µM recorded at different periods during 3 days. Gly, Glycinate; CTs, Charge Transfers. (B) Absorbance values at 285 nm over time.
This degradation function is represented alonside the experimental values in figure IV.2, panel B.
This analysis allows to infer the degradation rate constant, k, of the CORM under study. According to the data obtained, k = 0.0026 s-1. This can be used to determine the
half-life of the complex, t1/2, using equation IV.3 (Groch 1998).
(IV.3) 𝑡'/)= wq())i
In this case, t1/2 ≅ 266 s, meaning that half of CORM-3 in these conditions had
decomposed after less than 5 minutes. This result is in agreement with Chaves-Ferreira et al., that accounted for a half-life of 3.6 min in human plasma due to CORM-3 instability in water. (Chaves-Ferreira et al. 2015).
Finally, no readings in the visible region were recorded in this assay. Although CORM-3 is colorless, it was noticeable a yellowish color developing over time. To confirm the results here obtained, further studies could be carried out were the decomposition of CORM-3 could be followed at this wavelength.
1.1.2. BSA Conformational Study
Absorption spectroscopy is also a simple and relevant method to explore conformational changes in proteins upon ligand binding (Hu et al. 2004, Suryawanshi et al. 2016). In order to assess possible conformational changes due to CORM-3 interaction, a fixed concentration of BSA (8µM) was incubated with different concentrations of CORM-3 (0 – 600 µM). Given this metal complex previously seen fast decomposition in the working buffer, spectra were recorded at different incubation times (figure IV.3).
As can be seen in black in figure IV.3, BSA has two absoption peaks. The protein backbone is responsible for the stronger peak at ± 220 nm, while the aromatic amino acid residues (Trp, Tyr, Phe) give rise to the weaker one at around 280 nm (Xu et al. 2013). Furthermore, disulfide bonds between Cys residues also absorb near 260 nm (Schmid 2001). 10 min 1 h 0 1 2 3 4 200 250 300 350 400 Ab so rb an ce (AU ) Wavelength (nm) 0 1 2 3 4 200 250 300 350 400 Ab so rb an ce (AU ) Wavelength (nm) 0 1 2 3 4 200 250 300 350 400 Ab so rb an ce (AU ) Wavelength (nm) 24 h
Figure IV.3. UV-Vis absorption spectra of free BSA (in black) and BSA with CORM-3 (in blue) after 10 min,
1 and 24 h incubations at room temperature and protein-to-ligand ratios varying from 1:3.125 to 1:75 (for
25 It is known that at any wavelength the absorbance of a mixture is the sum of its components. Given the resemblances between BSA and CORM-3 absorption spectra, it’s not possible to immediately grasp an interaction just by looking at the incubation spectra alone. With this in mind, both free BSA and CORM-3 spectra were arithmetically added and the comparison with the ones obtained for the BSA-CORM-3 incubation samples can be seen in figure IV.4, at diferent protein-to-ligand ratios.
In this thesis, only the 10 min comparison is shown, since both 1 and 24 h incubations showed identical results. Such similarity can be understood considering that: (i) after 10 minutes CORM-3 degradation is almost completed, as we have shown in section 1.1.1. CORM-3 Decomposition, so the species in solution after that period should be highly similar; (i) the CORM-3 present in solution and subsequent decomposition products interact with BSA in similar ways, since nevertheless after 24 h it should be less CORM-3 present than at 10 min and the results were still identical (see Appendix 1, UV-Vis Interaction Analysis). 0 1 2 3 200 250 300 350 400 Abs or ba nc e (AU ) Wavelength (nm) 1 : 3.125 0 1 2 3 200 250 300 350 400 Abs or ba nc e (AU ) Wavelength (nm) 1 : 6.25 0 1 2 3 4 200 250 300 350 400 Abs or ba nc e (AU ) Wavelength (nm) 1 : 12.5 0 1 2 3 4 5 200 250 300 350 400 Abs or ba nc e (AU ) Wavelength (nm) 1 : 37.5 0 1 2 3 4 5 200 250 300 350 400 Abs or ba nc e (AU ) Wavelength (nm) 1 : 50 0 2 4 6 200 250 300 350 400 Abs or ba nc e (AU ) Wavelength (nm) 1 : 75 and + BSA@
CORM-3 BSA CORM-3
Figure IV.4. Comparison between spectra after 10 min incubation and the sum of free BSA and free