HYDROGEOPHYSICS IN FRACTURED CRYSTALLINE AQUIFERS IN ENGLISH GUYANA
Gerlane Cavalcante Messias
1, Jose Agnelo Soares
2, Felipe Kipper
1, Igor Fernandes Gomes
3,
Vandir Pereira Soares Júnior
1and Jefferson Fidélis Alves da Silva
1ABSTRACT.This work is a case study in English Guyana with the goal of finding groundwater in rock layers with fracture-controlled porosity using electrical resistivity imaging. This work was carried out in two phases by the Brazilian Army, in eight communities in the region of Alto Tacutu – Alto Essequibo in southeast Guyana. All work was done in accordance with a technical agreement between Brazil and Guyana. In the first phase, the surveys were completed by the team which collected resistivity data using a SuperSting R8 electrical resistivity meter with dipole-dipole and dipole-gradient arrays. Then the software EarthImager was used to analyze the data and create two-dimensional (2D) pseudo-sections with depths up to 70 m. In the second phase, eight wells were drilled in areas of low resistivity. The geology of this region consists of Precambrian granite rock layers with varying levels of fracturing. In this way, the effectiveness of the multielectrode resistivity imaging technique was demonstrated as a way to explore the availability of groundwater in crystalline rock formations with fracture-controlled porosity.
Keywords: electrical resistivity imaging, well siting, groundwater.
RESUMO.Este trabalho se constitui em um estudo de caso na Guiana Inglesa, com o objetivo de encontrar água subterrânea por meio de levantamentos de resistividade elétrica, nas áreas de porosidade controladas pelas zonas de fraturas. O trabalho foi realizado em duas fases pelo Exército Brasileiro em oito comunidades da região do Alto Tacutu – Alto Essequibo no sudeste da Guiana Inglesa, através de um acordo de cooperação técnica entre o Brasil e a Guiana. Na primeira fase, os levantamentos foram feitos por uma equipe que coletou dados de resistividade usando um eletrorresistivímetro SuperSting R8 com arranjos dos tipos dipolo-dipolo e dipolo gradiente. Em seguida foi utilizado o software EarthImager para analisar os dados e criar pseudoseções de duas dimensões (2D) até 70 m de profundidade. Na segunda fase, oito poços foram perfurados em pontos de baixa resistividade. A geologia da região é constituída de rochas graníticas Pré-cambrianas com níveis variados de fraturamento. Desse modo, demonstrou-se a efetividade do método de resistividade elétrica multieletrodo para explorar a disponibilidade de água subterrânea em aquíferos fraturados em terrenos cristalinos.
Palavras-chave: imageamento de resistividade elétrica, locação de poços, água subterrânea.
1Exército Brasileiro, Brasília, DF, Brazil – E-mails: gerlanec@hotmail.com, felipekippergeo@gmail.com, vandir.junior@eb.mil.br, fidelisilva1976@gmail.com 2Universidade Federal de Campina Grande - UFCG, Campina Grande, PB, Brazil – E-mail: agnelo.soares@ufcg.edu.br
300
HYDROGEOPHYSICS IN FRACTURED CRYSTALLINE AQUIFERS IN ENGLISH GUYANAINTRODUCTION
The electrical methods of underground research (Telford et al., 1976; Kearey et al., 2009) have been successfully employed in the investigation of aquifers (Hazell et al., 1992; Wright, 1992; Coriolano, 2002; Braga, 2016), in geoenvironmental diagnostics and in geotechnical studies (Dobecki & Romig, 1985; LaBrecque et al., 1996; Steeples, 2001; Power et al., 2013). Among the geophysical methods used in the study of fractured aquifers present in the crystalline basement, the most important are the electric methods, especially the multielectrode DC resistivity method, also called electrical resistivity tomography (Braga, 2016). This method in its simplest configuration uses four electrodes in the field, two for current injection and two for the measurement of potential difference. The multielectrode configuration, which makes the acquisition more agile, consists in the use of an automatic switching mechanism that allows the simultaneous use of a much larger number of electrodes, and at every instant of the data acquisition only four electrodes (or eight in the dual mode) remain active (AGI, 2018). For the application of this method it is necessary to adopt a certain type of electrode array, which consists of the way the electrodes of current injection and electric potential measurement are arranged in the field.
Sasaki (1992) developed an algorithm for the inversion of electroresistivity data, based on the damped least squares and the finite element methods, whose resolution is relatively little affected by noise, provided that the configuration adopted for the electrode arrangement is adequate. Loke & Barker (1996), using the basis of the Sasaki algorithm (1992), developed an algorithm for the rapid inversion of electrical tomography data that presents a performance about eight to twelve times faster than the conventional inversion algorithm by minimum squares method. This algorithm is the basis of the inversion program used in this work.
Steeples (2001) presents a general framework of applications of geophysical methods in the evaluation of targets near the surface of the terrain, indicating the DC resistivity method as suitable for the exploitation of groundwater resources and for the monitoring of electrically conductive underground contaminants. Gallas (2003) applied the electroresistivity method in an area of crystalline rocks in the municipality of São José do Rio Pardo, São Paulo, suggesting techniques for acquiring, processing and interpreting the results. The main objective of the surveys was to detect fractures or faults that could act as potential aquifers. These features were identified as zones of low electrical resistivity that presented continuity in depth. Madrucci
et al. (2005) present a detailed study on the fractured aquifer in the Lindóia region, State of São Paulo, which consists in the mapping of fractures from aerial photographs and from geophysical electroresistivity survey. The integrated analysis of fracture mapping, inverted geophysical data and field geological data allowed the identification of fractures filled by water, represented by low resistivity responses in the vicinity of fractures.
Pedersen et al. (2005) applied electromagnetic methods with the objective of exploring groundwater reservoirs. The authors have shown that geoelectric sections help to substantially improve the interpretation of seismic reflection data in order to more accurately identify lithological contacts between layers of clay and sand and between sand and partially fractured crystalline basement.
Dahlin & Zhou (2004) conducted numerical simulations to compare the resolution and efficiency of electroresistivity surveys using ten different types of electrode arrays for five different geological scenarios. They concluded that the dipole-dipole and gradient arrays present high resolution, are suitable for use in automatic multielectrode acquisition configurations, and present logistic advantages in relation to the other electrode arrays. Aizebeokhai & Oyeyemi (2014) evaluated the efficiency of the multielectrode gradient array for rapid data collection. They concluded that such electrode array presents better acquisition logistics and results in a higher resolution image when compared to the Wenner electrode array. Martorana et al. (2017) generated synthetic data of electroresistivity surveys for four different electrode arrays (dipole-dipole, pole-dipole, Schlumberger and gradient). The comparison between the obtained results showed that, in order to obtain a geoelectric section with an acceptable resolution and at the same time a high speed of data acquisition, it is recommended to use dipole-dipole or gradient arrays.
STUDY AREA
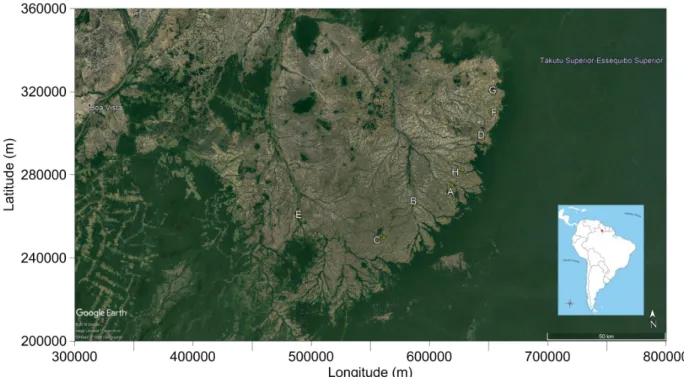
This paper presents the results of a geophysical and hydrogeological evaluation of crystalline terrains located in the south of the Cooperative Republic of Guyana (English Guyana), near the border with the state of Roraima, Brazil. This geophysical data survey campaign aimed to indicate the best locations for drilling wells for the production of groundwater in fractures of the crystalline basement. The geophysical method applied was the multielectrode electroresistivity method, also known as electrical tomography. The research lines were carried out in eight communities inhabited by Amerindians, whose locations are indicated in Figure 1.
Figure 1 – Location map of communities investigated by the electroresistivity method (red box): A – Aishalton; B – Karaudarnau; C – Achawib; D – Awaruwanau; E –
Bashaidrum; F – Maruranau; G – Shea; H – Churikidnau.
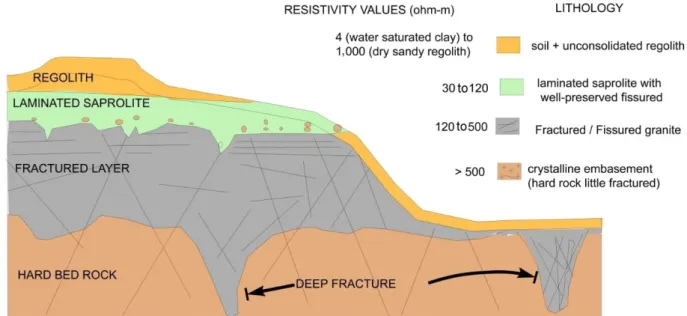
The geology of the region is composed of Precambrian granite rocks. The layers that constitute this type of terrain (Fig. 2), from top to bottom, are: 1st - reddish soil; 2nd - regolith - material rich in clay, derived from the decomposition of the basement, presents little thickness, locally is capped by lateritic crust, which may be absent due to erosion; 3rd fractured igneous rock -characterized by a dense horizontal fracturing in the first meters, decreasing fracture density with depth increase (subhorizontal to subvertical fractures, much of the groundwater resources come from this zone); 4th - hard crystalline basement - permeable only locally, due to the effect of fractures.
METHODOLOGY
The indicator used for the location of the wells was the electrical resistivity value together with geometric parameters of the potential fractured aquifers, such as thickness and slope towards the contact with the basement, in order to reach deeper zones of water percolation. Table 1 presents the typical values of electrical resistivity for the lithological units investigated. The geophysical survey was performed using a resistivity meter SuperSting R8 with 84 electrodes and automatic data acquisition. The parameters adopted in the acquisition are listed in Table 2.
Table 1 – Typical electrical resistivity values for the investigated lithological
units.
Lithological unit Resistivity (ohm.m)
Saturated clayey soil 4
Dry sandy regolith 1000
Laminated saprolite 30 to 120
Fractured rock 120 to 500
Hard rock >500
The data were processed in the EarthImager 2D software. The initial configurations considered the previous data removal with: 1) negative values of resistivity; 2) electric potential values below 0.2 mV; 3) apparent resistivity values below 1 ohm.m and above 10,000 ohm.m; 4) reciprocal error above 5%. Additionally, a maximum difference of 3% between successive iterations and an error between reciprocal positions of up to 5% were allowed. The method adopted in the inversion of the data was the smoothed inversion method (Oldenburg & Li, 1999).
302
HYDROGEOPHYSICS IN FRACTURED CRYSTALLINE AQUIFERS IN ENGLISH GUYANAFigure 2 – Typical profile of rock alteration in crystalline terrains (Dewandel et al., 2006).
Table 2 – Field parameters adopted in the electroresistivity data survey.
Section Community Electrode
spacing (m) Electrode array A Aishalton 3 Dipole-dipole B Karaudarnau 3 Dipole-dipole C Achawib 4 Dipole-dipole D Awaruwanau 4 Dipole-gradient E Bashaidrum 4 Dipole-dipole F Maruranau 4 Dipole-gradient G Shea 4 Dipole-dipole H Churikidnau 4 Dipole-dipole
Drilling of the wells was performed using a Prominas model R-1S drill, with capacity for drilling wells up to 250 meters deep. In the drilling, 10.1/2” or 9.7/8” diameter bits were used in the initial phase of the well. In the intermediate phase, 8” drill bit was used and, in the final stage, 6” diameter bit.
RESULTS
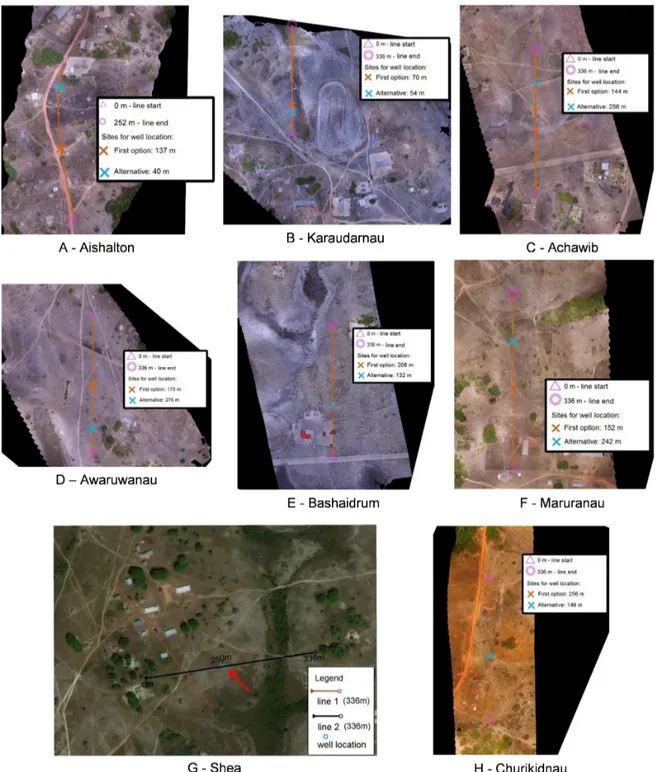
Figure 3 shows the localization maps of the electroresistivity sections performed in the eight communities, as well as the sites
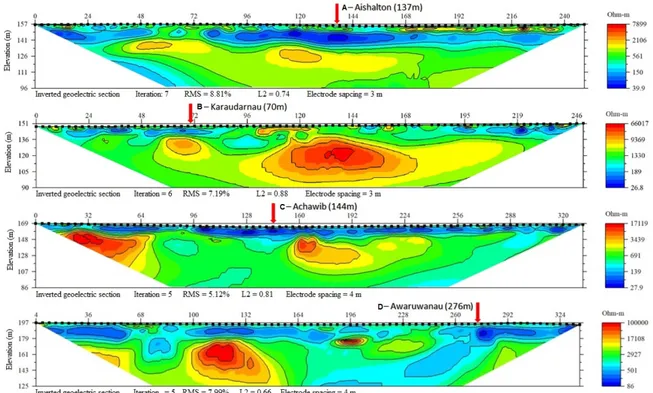
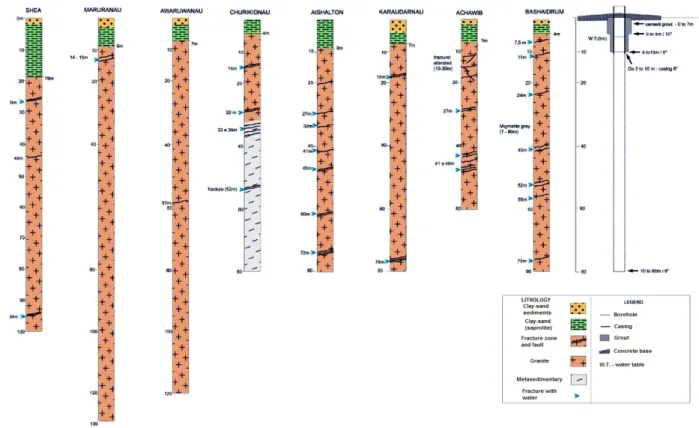
indicated for drilling the wells. Figures 4 and 5 show the eight geoelectric sections obtained by the inversion of the recorded geophysical data, with the positions indicated for drilling the wells, as indicated by the red arrows. Figures 6 to 9 show the lithological and constructive profiles of the wells drilled at the positions indicated in Figure 3.
In the geoelectric section of the Aishalton locality (Fig. 4-A) one can identify the water level around 150 meters deep. Above this, with a thickness of 7 meters and a resistivity (ρ)
of approximately 300 Ω.m, the occurrence of dry sandy-clayey regolith is indicated. Between the 137 and 150 meters there is a conductive zone (ρ ≈ 50 Ω.m) that supposedly corresponds
to the saturated saprolite. Below the dimension 137 and to the base of the geoelectric section there is a resistive region (ρ≈ 500 Ω.m) that should correspond to the fractured granite.
The lithological profile of the well drilled in Aishalton (Fig. 6) records the presence of a clay-sandy saprolite up to 9 meters deep followed by a range of densely fractured granite to the bottom of the well (80 meters deep). It should be noted that the geoelectric sections do not present sufficient resolution to indicate individually the fractures recorded in the lithological profile, however, the average resistivity of the interval is consistent with that expected for a fractured zone, as indicated in Table 1.
In the locality Karaudarnau, the geoelectric section (Fig. 4-B) suggests that from the surface of the terrain to the depth of 4 meters a dry regolith occurs withρ≈ 700 Ω.m and from
Figure 3 – Mosaic with the location of the electroresistivity data collection lines registered in the eight communities with the indication of the preferred positions
304
HYDROGEOPHYSICS IN FRACTURED CRYSTALLINE AQUIFERS IN ENGLISH GUYANAFigure 4 – Inversion models of resistivity for A – Aishalton; B – Karaudarnau; C – Achawib; D – Awaruwanau. The red arrows indicate the sites indicated for the drilling
of the wells.
Figure 5 – Inversion models of resistivity for E – Bashaidrum; F – Maruranau; G – Shea; H – Churikidnau. The red arrows indicate the sites indicated for the drilling
Figure 6 – Lithological and constructive profiles of wells drilled in the eight communities.
4 to 10 meters deep there is a range of saturated saprolite with
ρ≈ 150 Ω.m followed by a granite section with low fracturing
density (ρ≈ 1300 Ω.m) to the bottom of the section. In general,
the lithological profile (Fig. 6) confirms the profile suggested by the geoelectric section.
In Achawib, the geoelectric section (Fig. 4-C) indicates that in the position of the well, from the surface up to about 25 meters deep occurs a saturated saprolite withρ ≈ 100 Ω.m followed
by medium fractured granite (ρ≈ 600 Ω.m) to the bottom of
the section. The lithological profile (Fig. 6) shows the occurrence of a zone of saprolite and altered rock up to about 20 meters deep followed by a fractured granitic interval until the end of the drilling (60 meters depth).
The geoelectric section of Awaruwanau (Fig. 4-D) suggests a dry regolith (ρ ≈ 1000 Ω.m) to 4 meters deep, followed by
a saturated saprolite (ρ ≈ 120 Ω.m) between 4 and 18 meters
deep and finally a low-fracturing rock (ρ≈ 1500 Ω.m) to the
bottom of the section. Two wellbores were drilled at this site, but the first one resulted dry, then the alternative location was drilled. The lithological profile of this second location (Fig. 6) broadly
confirms the profile suggested by the geoelectric section, except that the saprolite is limited to a depth of 8 meters.
In Bashaidrum, the geoelectric section (Fig. 5-E) indicates, in the well position, the occurrence of dry regolith or rock (ρ≈
2000 Ω.m) down to 10 meters deep, followed by a conductive interval (ρ ≈ 150 Ω.m) between 10 and 20 meters deep that
should correspond to a saturated saprolite. From 20 meters deep to the bottom of the section there is indication of hard or weakly fractured rock (ρ≈ 1000 Ω.m). The lithological profile (Fig. 6)
in turn registers two thin layers of regolith and saprolite, each 2 meters thick, followed by densely fractured granite to the bottom of the well (80 meters deep).
The geoelectric section of Maruranau (Fig. 5-F) indicates the occurrence of saturated saprolite (ρ≈ 100 Ω.m) up to 20
meters deep, followed by hard rock (ρ ≈ 2000 Ω.m) to the
bottom of the section. The lithological profile (Fig. 6) shows a superficial layer of regolith, with a thickness of 3 meters, followed by a saprolite down to 9 meters deep and granite with little fracture to the final depth of the well (129 meters).
In Shea locality, the geoelectric section (Fig. 5-G) indicates that in the well position a saturated saprolite occurs
306
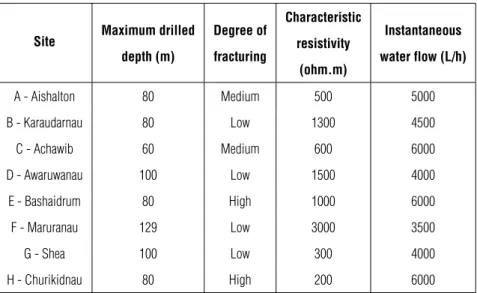
HYDROGEOPHYSICS IN FRACTURED CRYSTALLINE AQUIFERS IN ENGLISH GUYANATable 3 – Maximum drilled depth, fracture degree, characteristic resistivity and instantaneous water flow.
Site Maximum drilled
depth (m) Degree of fracturing Characteristic resistivity (ohm.m) Instantaneous water flow (L/h) A - Aishalton 80 Medium 500 5000 B - Karaudarnau 80 Low 1300 4500 C - Achawib 60 Medium 600 6000 D - Awaruwanau 100 Low 1500 4000 E - Bashaidrum 80 High 1000 6000 F - Maruranau 129 Low 3000 3500 G - Shea 100 Low 300 4000 H - Churikidnau 80 High 200 6000
(ρ≈ 100 Ω.m) down to 20 meters deep followed by a fractured
granite (ρ ≈ 300 Ω.m) down to the base of the section. The
lithological profile of the well (Fig. 6) basically confirms the profile indicated by the geoelectric section. In Churikidnau, the geoelectric section (Fig. 5-H) suggests saturated saprolite (ρ≈
60 Ω.m) down to 10 meters deep, followed by densely fractured rock (ρ ≈ 200 Ω.m) to the bottom of the section. Figure 6
shows the occurrence of saprolite up to 4 meters deep followed by fractured granite to the depth of 32 meters and fractured phyllite to the final depth of the well (80 meters).
Table 3 presents the maximum drilled depths, the degree of fracture observed in the lithological profile, the characteristic values of resistivity observed in the granite occurrence intervals in the wells and the instantaneous water flows measured after the installation of the pump in each of the drilled wells. No long term flow tests were performed. The degree of fracture is a qualitative index based on the description of the lithological profiles of the wells, as can be observed in Figure 6.
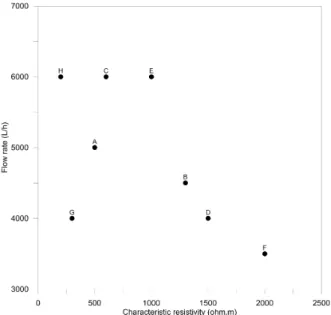
In order to characterize the relationships between the quantities listed in Table 3, Figures 7, 8 and 9 show, respectively, dispersion plots between flow and fracture degree, between characteristic resistivity and fracture degree, and between flow and characteristic resistivity. In these figures the degree of low fracturing is represented by the number 1, medium degree by 2 and the high one by 3.
In general, it can be affirmed that there is a good correlation between the characteristic values of electrical resistivity observed
in the intervals corresponding to the granite, the degree of fracture observed in the lithological profiles and the instantaneous flows recorded after the installation of the pump in each well.
Figure 7 shows that there is a continuous increase in the wells flow with the increase of the fracture degree, demonstrating that the fracture of the basement strong controls the water production capacity. In Figure 8, with the exception of wells 5 and 7 (Bashaidrum and Shea), the characteristic resistivity decreases consistently with the increase in the degree of fracture of the crystalline rock. Finally, Figure 9 shows the relationship between well flow and characteristic resistivity. Again, with the exception of wells 5 and 7, the wells flow rate decreases continuously with increasing fracture degree of the crystalline bed. Since wells flow depends on the degree of crystalline fracture, resistivity can be used to map most of the fractured zones of the basement, although other factors as water salinity and interconnectivity degree of fractures may complicate this relationship, as observed in wells 5 and 7. These results are in concordance with those found by Moreira et al. (2013).
CONCLUSIONS
In this paper, eight successful cases were presented in the application of the DC resistivity method as a diagnostic tool for the location of water wells in fractured aquifers of the English Guyana crystalline basement. The water flow shown shortly after the drilling of the wells is strongly controlled by the degree of fracturing of the igneous rocks that make up the crystalline
Figure 7 – Relation between instantaneous flow of wells and fracture degree of
the crystalline basement.
Figure 8 – Relation between characteristic resistivity and degree of fracture of
the crystalline basement.
Figure 9 – Relation between instantaneous flow of wells and resistivity
characteristic of the basement.
basement of the region. Of the eight wells drilled, in six of them a strong decrease of the characteristic electrical resistivity was observed with the increase of the basement fracture degree index. In addition, a consistent decrease in the wells flow was observed with the increase in the characteristic resistivity. For these reasons deep regions with low values of electrical
resistivity in the geoelectric sections are potential indicators of the presence of interconnected fracture zones in the crystalline basement, constituting in preferential zones for the drilling of wells for the production of groundwater. The same approach may be applied successfully to explore groundwater resources in fractured crystalline basement of different parts of the world.
308
HYDROGEOPHYSICS IN FRACTURED CRYSTALLINE AQUIFERS IN ENGLISH GUYANAACKNOWLEDGMENTS
The authors thank the Construction Engineering of the Brazilian Army for their permission to publish the results of this study, for the Universidade Federal de Pernambuco (Department of Civil Engineering) and the Universidade Federal de Campina Grande (Department of Mining and Geology) for technical support.
REFERENCES
AGI. 2018. SuperSting Earth Resistivity, IP & SP System with Wi-Fi. Instruction Manual V. 20180515. Advanced Geosciences Inc. AIZEBEOKHAI AP & OYEYEMI KD. 2014. The use of the multiple-gradient array for geoelectrical resistivity and induced polarization imaging. Journal of Applied Geophysics, 111: 364–376. BRAGA ACO. 2016. Geofísica aplicada: métodos geoelétricos em Hidrogeologia. Oficina de Textos. São Paulo, Brazil. 160 pp.
CORIOLANO ACF. 2002. Reavaliação de critérios estruturais na hidrogeologia de terrenos cristalinos, com ênfase na neotectônica e sensoriamento remoto. PhD Thesis – Centro de Ciências Exatas e da Terra. Universidade Federal do Rio Grande do Norte, Natal, Brazil, 199 pp.
DAHLIN T & ZHOU B. 2004. A numerical comparison of 2D resistivity imaging with 10 electrode arrays. Geophysical Prospecting, 52(5): 379–398.
DEWANDEL B, LACHASSAGNE P, WYNS R, MARÉCHAL J & KRISHNAMURTHY N. 2006. A generalized 3-D geological and hydrogeological conceptual model of granite aquifers controlled by single or multiphase weathering. Journal of Hydrology, 330(1-2): 260–284.
DOBECKI T & ROMIG P. 1985. Geotechnical and groundwater geophysics. Geophysics, 50(12): 2621–2636.
GALLAS JDF. 2003. Prospecção de água subterrânea em aqüíferos cristalinos com o emprego de métodos indiretos. Revista do Instituto Geológico, 24(1-2): 43–51.
HAZELL J, CRATCHLEY C & JONES C. 1992. The hydrogeology of crystalline aquifers in northern Nigeria and geophysical techniques used in their exploration. Geological Society, London, Special Publications, 66(1): 155–182.
KEAREY P, BROOKS M & HILL I. 2009. Geofísica de exploração. Oficina de textos. São Paulo, Brazil. 438 pp.
LABRECQUE D, RAMIREZ A, DAILY W, BINLEY AM & SCHIMA S. 1996. ERT monitoring of environmental remediation processes. Measurement Science and Technology, 7(3): 375–383.
LOKE MH & BARKER RD. 1996. Rapid least-squares inversion of apparent resistivity pseudosections by a quasi-Newton method 1. Geophysical Prospecting, 44(1): 131–152.
MADRUCCI V, TAIOLI F & ARAÚJO CCD. 2005. Análise integrada de dados de Sensoriamento Remoto, Geologia e Geofísica no estudo de aqüífero fraturado, Lindóia-SP. Revista Brasileira de Geofísica, 23(4): 437–451.
MARTORANA R, CAPIZZI P, D’ALESSANDRO A & LUZIO D. 2017. Comparison of different sets of array configurations for multichannel 2D ERT acquisition. Journal of Applied Geophysics, 137: 34–48. MOREIRA CA, CAVALHEIRO MLD, PEREIRA AM & SARDINHA DS. 2013. Análise das relações entre parâmetros geoelétricos e vazões para o aquífero livre de Caçapava do Sul(RS). Águas Subterrâneas, 27(3): 45–59.
OLDENBURG DW & LI Y. 1999. Estimating depth of investigation in DC resistivity and IP surveys. Geophysics, 64(2): 403–416.
PEDERSEN LB, BASTANI M & DYNESIUS L. 2005. Groundwater exploration using combined controlled-source and radiomagnetotelluric techniques. Geophysics, 70(1): G8–G15.
POWER C, GERHARD JI, TSOURLOS P & GIANNOPOULOS A. 2013. A new coupled model for simulating the mapping of dense nonaqueous phase liquids using electrical resistivity tomography. Geophysics, 78(4): EN1–EN15.
SASAKI Y. 1992. Resolution of resistivity tomography inferred from numerical simulation. Geophysical Prospecting, 40(4): 453–463. STEEPLES DW. 2001. Engineering and environmental geophysics at the millennium. Geophysics, 66(1): 31–35.
TELFORD W, GELDART L, SHERIFF R & KEYS D. 1976. Applied Geophysics. Cambridge University Press. Cambridge, 860 pp. WRIGHT EP. 1992. The hydrogeology of crystalline basement aquifers in Africa. Geological Society, London, Special Publications, 66(1): 1–27.
Recebido em 25 de junho de 2019 / Aceito em 14 de agosto de 2019 Received on June 25, 2019/ Accepted on August 14, 2019