Sandra Isabel Cunha Silveira
outubro de 2013
Redox changes in aged placental bed:
consequences for cell signalling
UMinho|20
13
Sandr
a Isabel Cunha Silv
eir
a
R
edo
x changes in aged placent
al bed: consequences for cell signalling
Sandra Isabel Cunha Silveira
outubro de 2013
Dissertação de Mestrado
Mestrado em Genética Molecular
Redox changes in aged placental bed:
consequences for cell signalling
Escola de Ciências
Trabalho realizado sob a orientação da
Doutora Elisabete Silva
e do
Professor Doutor Henrique Almeida
e da
III
Acknowledgements
Em primeiro lugar, gostaria de agradecer à minha orientadora, Doutora Elisabete Silva, por me integrar no seu próprio projecto de investigação, acompanhar as suas experiências e participar na sua execução, pela sua orientação, aconselhamento, apoio e paciência.
Gostaria ainda de agradecer ao Professor Henrique Almeida por me aceitar no grupo Ageing and Stress e assumir a co-orientação.
Gostaria de agradecer à Sra. Professora Deolinda Lima, directora do Departamento de Biologia Experimental da Faculdade de Medicina da Universidade do Porto, onde o trabalho se realizou, e por extensão, a todos os quantos que aí exercem, em especial os meus colegas de laboratório, Ana Isabel Soares e Anabela Silvestre, pelas ajudas ao longo do ano.
Um agradecimento especial ao Dr. Luis Guedes-Martins do Centro Hospitalar do Porto, Unidade Maternidade Júlio Dinis, por nos facultar os tecidos que permitiram a realização desta dissertação de mestrado.
Gostaria, igualmente, de agradecer aos meus pais e irmã pelo apoio.
Por fim, gostaria de agradecer a Brian Baron por todo o apoio, ajuda, por acreditar em mim e por estar sempre presente quando preciso.
V
Abstract
The occurrence of pregnancy-related disorders such as preeclampsia, IUGR or foetal death is associated with increased maternal age. These pregnancy complications are thought to be a consequence of a local imbalance in redox homeostasis, leading to an abnormal placentation, placental development and function. In placental bed, the uterine place where placenta adheres, ROS can react with biomolecules and alter cell function, though modification of cell signalling pathways involved in placentation or induction of cellular damage.
In this project it was hypothesized that at older reproductive age loss of redox homeostasis at the placental bed contributes to disruption of foetal/placental interactions and enhances the development of pregnancy complications. Therefore, to address this hypothesis, evaluation of oxidative stress markers and activation of cell signalling pathways was performed in samples of uterine placental bed of women at different ages. Employing a human cell stress-related protein expression array kit, it was observed that in reproductively older women the protein expression of cytochrome c, FABP-1 and ADAMTS1 were significantly increased. The array was validated by western blot, using antibodies for SODII, HSP70, Sirt2 and phospho-p38α. Western blot, also demonstrated a significant age-related increase SODII expression. Results show a local redox imbalance in placental bed of reproductively older women that could lead to increased cellular oxidative stress (OS). As marker of cellular OS, a protein carbonylation assay was used. Although no significant changes were observed in total protein carbonylation content, quantification of specific carbonylated proteins showed a positive correlation with maternal age. As mild increases in OS can alter signalling pathways, an additional human phospho-kinase array kit was employed to study the same tissue. STAT3 protein phosphorylation had over 100% increase in expression. OS status was also evaluated in pregnancy-related disorders. SODI, SODII and Sirt2 protein expression was evaluated by western blot. SODI and Sirt2 expression was increased in pregnancies of hypertensive women with or without pre-eclampsia. SODII expression had no significant changes in all groups. Once again, only a specific protein was significantly increased in the group of women with gestational hypertension and IUGR of the foetus.
This project gathered information on local uterine redox status and cell signal in reproductively older women and demonstrated that alterations in tissue redox balance are present in a maternal tissue, even in pregnancies without associated complications
VII
Resumo
A ocorrência de complicações relacionadas com a gravidez como a pré-eclâmpsia, restrição ao crescimento intra-uterino ou morte fetal, está associada com o aumento da idade materna. Elas podem ser consequência de um desequilíbrio local no balanço redox, que estará na origem de uma placentação anormal. No local de placentação, o local uterino onde a placenta adere, as espécies reactivas de oxigénio podem reagir com biomoléculas e alterar funções celulares, quer por modificação de vias de sinalização, quer por indução de danos celulares.
Neste projeto, colocou-se a hipótese de em idade reprodutiva avançada ocorrer um desequilíbrio do balanço redox no local de placentação, que contribui para a instabilidade da interacção feto/placenta e o aumento da probabilidade de ocorrerem complicações. Para testar esta hipótese foram avaliados marcadores de stress oxidativo e indicadores de activação de vias de sinalização celular em amostras de local de placentação de mulheres com diferentes idades. Recorrendo a um array de expressão de proteínas relacionadas com o stress celular, observou-se que em mulheres com idade reprodutiva avançada a expressão do citocromo c, FABP-1 e ADAMTS1 estava aumentada significativamente. A validação do array foi realizada por Western blotting utilizando anticorpos para SODII, HSP70, Sirtuin2 e fosfo-p38α. Os resultados do
Western blot demonstraram aumento significativo da expressão da SOD II com a idade
materna. Nesta primeira parte do trabalho, observou-se um desequilíbrio redox no local de placentação em mulheres com idade reprodutiva avançada, que poderá originar um aumento do stress oxidativo. Quando se empregou a carbonilação de proteínas como marcador de stress oxidativo, não se observaram alterações significativas no conteúdo total de carbonilos, mas a quantificação de proteínas específicas mostrou uma correlação positiva entre a carbonilação e a idade materna. Além disso, atendendo a que um ligeiro aumento do stress oxidativo pode alterar vias de sinalização, empregou-se um array de cínases de fosfatases para o seu estudo. A proteína STAT3 fosforilada teve um aumento da expressão superior a 100%.
Na segunda parte do trabalho, em gravidezes com complicações associadas, a expressão proteica das enzimas antioxidantes SODI, SODII e da Sirtuin2, avaliadas por
Western Blotting, mostrou que em mulheres hipertensas com ou sem pré-eclampsia, a
SODI e Sirt2 estavam aumentadas, enquanto a expressão da SODII não apresentou alterações significativas. O estudo da carbonilação proteica demonstrou que apenas uma
VIII
proteína específica se encontra significativamente aumentada no grupo de mulheres com hipertensão gestacional e restrição ao crescimento intra-uterino.
Este projecto reuniu informação sobre o estado redox e sinalização celular no local de placentação em mulheres com idade reprodutiva avançada e demonstrou a existência de alterações no equilíbrio redox uterino, mesmo em gravidezes sem complicações associadas.
IX
Table of contents
Abbreviations ... XI Figures ... XIII Tables ... XIV 1. Introduction ... 31.1. Placentation and placental bed ... 3
1.2. Oxidative stress ... 5
1.3. Oxidative stress biomarkers ... 7
1.3.1. Protein carbonylation ... 7
1.3.2. DNA Damage ... 8
1.3.3. Lipid Peroxidation ... 8
1.4. Cellular signalling ... 8
1.4.1. Extracellular signal-regulated protein kinase 1 and 2 pathway ... 10
1.4.2. p38 Mitogen-activated kinase pathway ... 10
1.4.3. C-jun amino terminal kinase pathway ... 11
1.5. Pregnancy-associated disorders ... 11
1.5.1. Hypertension ... 11
1.5.1.1. Pre-eclampsia ... 11
1.5.1.2. Intrauterine Growth Restriction... 13
1.6. Aims ... 14
2. Methods ... 17
2.1. Tissue collection ... 17
2.2. Tissue lysation ... 17
2.3. Protein quantification – Lowry method ... 17
2.4. Western Blotting ... 18
2.5. Protein carbonylation ... 19
2.6. Human Cell Stress Array ... 20
2.7. Protein quantification – Bradford method ... 21
2.8. Human Phospho-kinase Array kit ... 22
2.9. Statistical analysis ... 23
X
3.1. Reproductive ageing and redox balance in placental bed. ... 27
3.1.1. Protein array. ... 27
3.1.2. Western blotting – Protein array validation. ... 28
3.1.3. Oxidative stress marker - protein carbonylation. ... 30
3.2. Reproductive ageing and cell signalling. ... 31
3.2.1. Protein array. ... 31
3.2.2. Western blotting – Protein array validation. ... 33
3.3. Redox balance in placental bed and pregnancy-associated disorders. ... 33
3.3.1. Western blotting – cell stress related proteins. ... 33
3.3.2. Oxidative stress marker – protein carbonylation. ... 36
4. Discussion ... 41
5. Conclusions and future perspectives ... 49
6. Final remarks... 53
XI
Abbreviations
ADAMTS1 – A desintegrin and metalloproteinase with thrombospondin motifs 1 BSA – Bovine serum albumin
CO• – Carbonyl group
CuSO4 – Copper (II) sulphate
DNP – 2,4 –Dinitrofenol
DNPH – 2,4-Dinitrophenylhydrazine DTT – Dithiothreitol
ECM – Extracellular matrix
EDTA – Ethylenediaminetetraacetic acid ERK – Extracellular signal-regulated kinase FABP-1 – Fatty acid-binding protein 1 HCl – Hydrochloric acid
HRP – Horseradish peroxidase HSP70 – Heat shock protein 70 HT – Hypertension
H2O2 – Hydrogen peroxide
IUGR – Intrauterine growth restriction
JNK/SAPK – c-Jun N-terminal kinase/ Stress-activated protein kinase KNaC4H4O6 – Potassium sodium tartrate
MAPK – Mitogen-activated protein kinase
XII
MAPKKK – Mitogen-activated protein kinase kinase kinase NaCl – Sodium chloride
NaCO3 – Sodium carbonate
NADPH – Nicotinamide adenine dinucleotide phosphate NaOH – Sodium hydroxide
NO• – Nitric oxide OH• – Hydroxyl ion OS – Oxidative stress O2•- – Superoxide anion PE – Pre-eclampsia
RNS – Reactive nitrogen species ROS – Reactive oxygen species SDS – Sodium dodecyl sulphate Sirt 2 – Sirtuin 2
SOD – Superoxide dismutase
STAT3 – Signal transducer and activator of transcription 3 TBS – Tris-buffer saline
TBS-T – Tris-buffer saline with Tween 20 TFA – Trifluoroacetic acid
XIII
Figures
Figure 1 – Scheme of human Placentation.
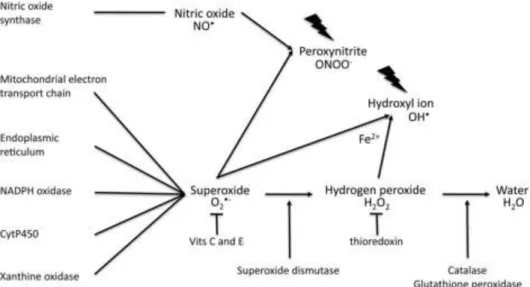
Figure 2 – Production of reactive oxygen species and nitrogen reactive species and its neutralization.
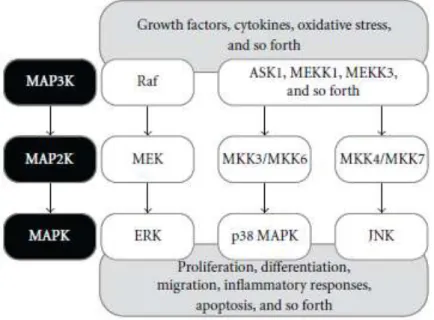
Figure 3 – Protein scaffold of MAPK pathways involved in oxidative stress.
Figure 4 – Scheme of trophoblast invasion and spiral remodelling in normal pregnancy and in pregnancy-associated disorders.
Figure 5 – Human cell stress array profile in human placental bed. Figure 6 – Effect of age on cell stress-related proteins expression. Figure 7 – Effect of age on DNP expression.
Figure 8 – Effect of age on DNP expression in different proteins.
Figure 9 – Human phospho-kinase array profile in human placental bed. Figure 10 – Effect of age on phospho-proteins expression.
Figure 11 – Effect of pregnancy-related disorders on SOD I expression. Figure 12 – Effect of pregnancy-related disorders on SOD II expression. Figure 13 – Effect of pregnancy-related disorders on Sirtuin 2 expression. Figure 14 – Effect of pregnancy-related disorders on DNP expression.
Figure 15 – Effect of pregnancy-related disorders on DNP expression in different proteins.
XIV
Tables
Table I – BSA standard curve for protein quantification by Lowry method.
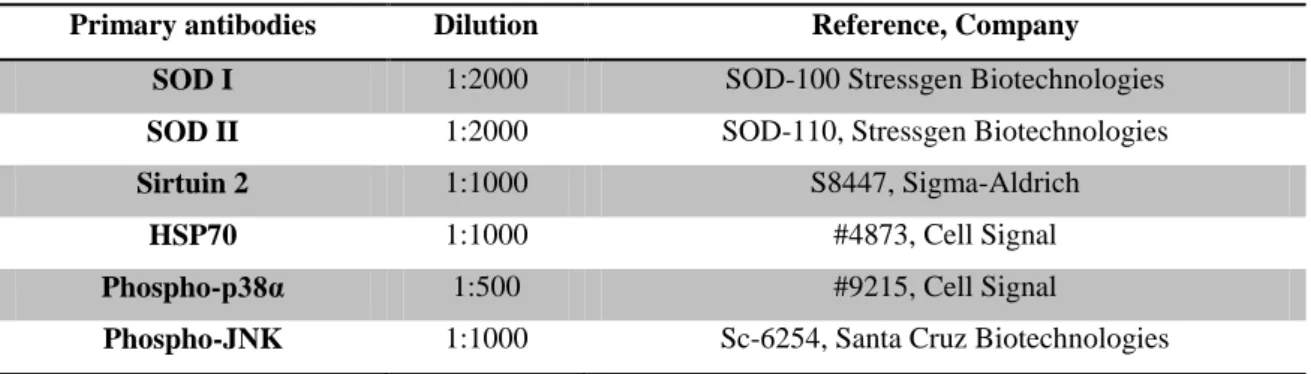
Table II – Primary antibodies used.
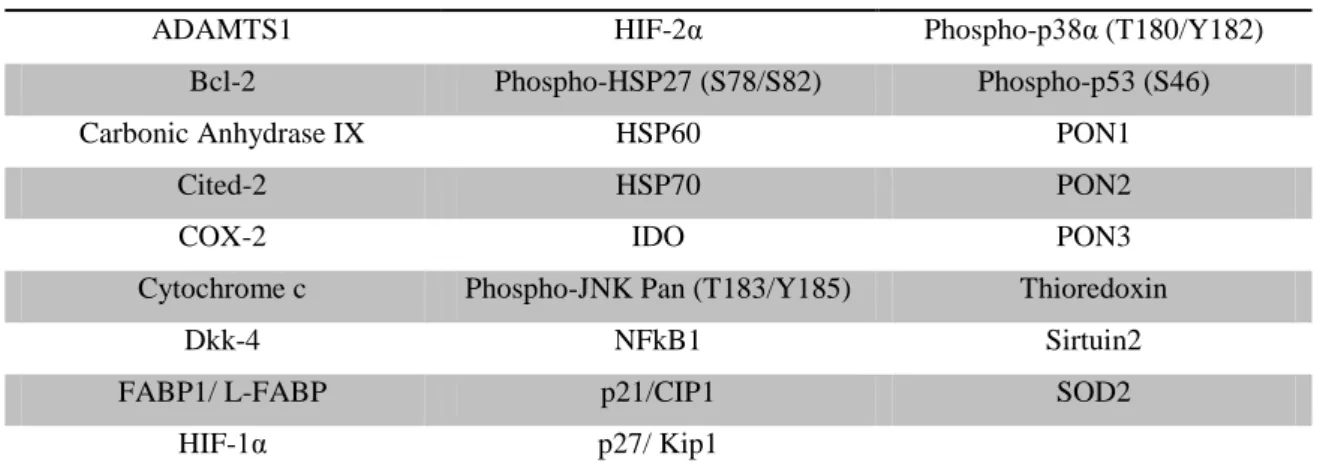
Table III – Capture antibodies in human cell stress array.
Table IV – BSA standard curve for protein quantification by Bradford method.
Table V – Capture antibodies in human phospho-kinase array.
Table VI – Identification of cell stress-related proteins expressed in human placental bed tissues.
Table VII – Identification of phospho-kinases proteins expressed in human placental bed tissues.
3
1. Introduction
Nowadays, in modern societies, women are postponing childbearing beyond the age of 35 years old (Balasch and Gratacós 2011). Higher education, pursuit of a career, economic independence, effective contraception, longer life expectation and the promise of advanced reproductive technologies are reasons for the decision of having their first child in later age (van Katwijk and Peeters 1998, Istance and Theisens 2008). As women’s fertility declines with age, being more notorious after 35 years-old, it leads to an increased risk of developing pregnancy-related complications like hypertension, pre-eclampsia and intrauterine growth restriction (IUGR), that can affect both mother and foetus during pregnancy and labour (van Katwijk and Peeters 1998).
Various observations favour the view that some pregnancy-related complications are due to an abnormal placental bed, the uterine environment where the placenta adheres, which in turn may result, from altered redox status, consequence to an imbalance between the activity of pro-oxidant and anti-oxidant molecules. This promotes reactive oxygen species (ROS) effects and the establishment of oxidative stress (OS). This condition can induce alterations in signalling pathways and damage to biomolecules such as proteins, DNA and lipids (Myatt and Cui 2004).
1.1. Placentation and placental bed
Placentation is the process of formation and development of the placenta and the associated anatomical modifications in maternal tissue. In humans, it involves the development of three regions (Figure 1).
The first region is called foetal placenta and contains both foetal and maternal blood and is the place where physiological exchange of nutrients and waste products occurs (Georgiades, Ferguson-Smith et al. 2002). The second region is termed basal plate and is a region that borders the maternal surface next to the foetal placenta although it does not contain any foetal blood and is transversed by maternal vessels. This region can also be called implantation site. The third region is known as placental bed and is constituted by maternal uterine tissue that contains the decidua basalis, which is the term given to the uterine endometrium specially modified to enable implantation.
4
Figure 1. Human Placentation.Placentation involves the development of three regions: foetal placenta,
which protects the foetus and serve as a gas and hormone exchange; basal plate which borders the maternal surface and the foetal placenta; and placental bed where trophoblast invasion and the physiological change occurs. Extracted from Georgiades, Ferguson-Smith et al. 2002
Placental bed contains 100-150 maternal spiral arteries (Georgiades, Ferguson-Smith et al. 2002, Lyall 2002). Maternal spiral arteries supply nutrients and oxygen to the placenta (Lyall 2005). But, for the success of a healthy pregnancy it is necessary that maternal spiral arteries are transformed into flaccid vessels in a physiological process where endovascular invasion of the arterial lumen by trophoblasts is a crucial process (Redline 2008). Trophoblast invasion through the uterine stroma is also fundamental for anchoring the placenta into the uterine wall. There is no doubt that placental bed plays a role is supporting placenta function and that failure in the setting up of the physiological changes may lead to pre-eclampsia, foetal growth restriction or even spontaneous miscarriage (Lyall 2005).
An imbalance in placental bed redox status is thought to contribute to the development of the above-mentioned pregnancy complications (Myatt and Cui 2004).
5
1.2. Oxidative stress
OS is described as an imbalance between the production of ROS/reactive nitrogen species (RNS) and the levels of antioxidant molecules, able to scavenge them (Myatt and Cui 2004). It is the basis of one of the most widely accepted theories of ageing (Harman 1956).
Pregnancy is known as a state of OS arising from an increased metabolic activity of mitochondria and increased ROS and RNS production in the placenta and the reduction of antioxidant defence mechanisms (Myatt and Cui 2004, Agarwal, Aponte-Mellado et al. 2012). A balance between ROS and RNS production and antioxidant defence is necessary to maintain cellular homeostasis (Lázár 2012), since ROS and RNS are needed for a correct cell function (Agarwal, Aponte-Mellado et al. 2012). However, when the production of pro-oxidant molecules increases or when the antioxidant defences decrease (Gupta, Malhotra et al. 2009) this originates an imbalance in the redox equilibrium and leads to a disturbance in cellular metabolism and regulatory pathways (Lázár 2012).
ROS play an important signalling role in female fertility and pregnancy. Indeed they are needed for physiological processes involved in oocyte maturation, fertilization, implantation and embryo development (Burton and Jauniaux 2011). ROS can alter trophoblasts proliferation and differentiation and placental vascular reactivity, thus being important regulators of placental function (Myatt and Cui 2004, Webster, Roberts et al. 2008). As such, an imbalance in cellular levels of ROS, leading to OS, may be implied in placental dysfunction and the development of pregnancy complications.
Most ROS are free radicals containing one or more unpaired electrons but some ROS are not free radicals. Nevertheless, both have high reactivity (Burton and Jauniaux 2011) and can induce cellular damage (Myatt and Cui 2004). One of the most reactive ROS is superoxide anion (O2-) (Myatt and Cui 2004, Gupta, Malhotra et al. 2009,
Agarwal, Aponte-Mellado et al. 2012, Lázár 2012). The major source of O2- is the
mitochondria, through the mitochondrial respiratory chain (Agarwal, Aponte-Mellado et al. 2012) but other sources of O2- include the short electron chain in the endoplasmic
reticulum, xanthine oxidase, nitric oxide synthase (Myatt and Cui 2004), cytochrome P450 and the enzyme adenine dinucleotide phosphate (NADPH) oxidase (Figure 2).
NADPH oxidase produces substantial quantities of O2- during early pregnancy
6
which leads to up-regulation of transcription factors, antioxidant production, angiogenesis, proliferation and matrix remodelling (Myatt and Cui 2004, Webster, Roberts et al. 2008, Gupta, Malhotra et al. 2009). O2- can be neutralized enzymatically
by superoxide dismutase (SOD) and converted into hydrogen peroxide (H2O2), which,
although less reactive is more stable and membrane permeable. In the cells H2O2 can be
convert into water by catalase and glutathione peroxidase (Burton and Jauniaux 2011). SOD has three isoforms: copper/zinc SOD (Cu/Zn SOD) or SODI that is located in the cytosol, Manganese SOD (Mn SOD) or SODII, located in the mitochondria and SODIII, an extracellular isoform that is structurally similar to Cu/Zn SOD. SODI and SODII isoforms have cell specific distribution in the placenta. SODI is intensely expressed in villous stroma whereas SODII is expressed strongly in the villous endothelium and faintly expressed in syncytiotrophoblast (Myatt and Cui 2004).
ROS can be neutralized by antioxidants. Antioxidants are molecules that protect the cell against ROS by dramatically delaying or preventing oxidation. They can be enzymatic or non-enzymatic: SOD, thioredoxin, thioredoxin reductase, catalase, glutathione peroxidase are endogenous enzymatic antioxidants (Agarwal, Aponte-Mellado et al. 2012), while vitamins C and E and glutathione are non-enzymatic antioxidants (Gupta, Malhotra et al. 2009).
Figure 2. Production of reactive oxygen and nitrogen species and its neutralization. Superoxide
anion is produced by the mitochondria, endoplasmic reticulum, NADPH oxidase, cytochrome P450 and xanthine oxidase and is scavenged by superoxide dismutase that converts it into hydrogen peroxide. Catalase and glutathione peroxidase may breakdown hydrogen peroxide into water. The action of antioxidants is necessary because an imbalance between superoxide and hydrogen peroxide leads to the formation of hydroxyl ion. In the other side, superoxide can interact with nitric oxide and form a powerful pro-oxidant, peroxynitrite. Extracted from Burton and Janiaux 2011.
7
Nitrative stress is also a biological process that alters the placental function. The most important RNS are nitric oxide (NO). It has a role, likely a signalling one, in the trophoblast invasion and in the maternal-foetal circulation. When NO and O2- interact
with each other, they generate a potent pro-oxidant, peroxynitrite that affects placental physiology (Webster, Roberts et al. 2008).
It is believed that local cellular redox imbalance may lead to alterations in cellular signalling pathways and also induce damage to biomolecules such as proteins, lipids or DNA. These events originate cellular dysfunction and may contribute to the development and maintenance of pregnancy-related complications (Myatt and Cui 2004).
1.3. Oxidative stress biomarkers
1.3.1. Protein carbonylation
Protein carbonylation is an irreversible protein oxidation process promoted by ROS (Dalle-Donne, Aldini et al. 2006, Suzuki, Carini et al. 2010), which includes the formation of stable carbonyl groups like aldehydes and ketones on protein side chains when they are oxidized. The amino acids that are more susceptible to be oxidized in this way are proline, arginine, lysine and threonine (Donne, Rossi et al. 2003, Dalle-Donne, Aldini et al. 2006, Wong, Cheema et al. 2008).
Protein oxidation results in alteration of protein conformation, exposure of hydrophobic domain and loss of catalytic function and structural properties (Levine 2002, Wong, Cheema et al. 2008). This phenomena is often mentioned as a process needed in the cells because it may act as a signal mechanism to ensure that defective proteins enter the degradation pathway and are degraded by the proteasome (Nystrom 2005).
Accumulation of protein carbonyls has been observed in various human age- related diseases (Dalle-Donne, Rossi et al. 2003) and during the ageing process (Levine 2002). Since protein carbonyls are very stable alterations they have been used as oxidative stress biomarker. (Dalle-Donne, Aldini et al. 2006, Wong, Cheema et al. 2008).
8
1.3.2. DNA Damage
DNA damage is described as an alteration in the structure of the DNA caused by oxidative stress, UV radiation, alkylating agents or hydrolytic deamination. These alterations comprise strand breaks and modifications in purines and pyrimidines (Kumari, Rastogi et al. 2008). Free radicals like OH often attack DNA, leading to guanine modification and producing of 8-hydroxy-2’-deoxyguanosine (Evans, Dizdaroglu et al. 2004, Burton and Jauniaux 2011) that can be measured biochemically or detected immunohistochemically (Burton and Jauniaux 2011). This type of modification was found increased in placental tissues of pregnancy-associated disorders when compared with normal pregnancies (Wiktor, Kankofer et al. 2004).
1.3.3. Lipid Peroxidation
Lipid peroxidation has been defined as the oxidative degradation of lipids that contain a number of carbon-carbon double bonds (Devasagayam, Boloor et al. 2003). Lipid peroxides are formed when ROS attack the phospholipids presents in cell membranes and react with polyunsaturated fatty acids leading to cellular damage contribute to the formation of lipid peroxides, lipid hydroperoxides and a secondary product of lipid peroxidation, malonaldehyde (Lázár 2012). In fact, it was demonstrated that in pregnancy related disorders, an accumulation of lipid peroxides occurs mainly in placenta (Agarwal, Gupta et al. 2005).
1.4. Cellular signalling
Environmental signals can regulate cellular activity by binding to cellular receptors and activating specific intracellular pathways (Aouadi, Binetruy et al. 2006, Berridge 2012). Many of these extracellular signals are transduced by highly conserved eukaryotic signalling mechanisms called mitogen-activated protein kinases (MAPKs) (Aouadi, Binetruy et al. 2006), members of important signalling pathways that regulate physiological processes like cell growth, differentiation and cell death (Junttila, Li et al. 2008).
When a stimulus is generated, a phosphorylation cascade is initiated originating a protein scaffold where a specific mitogen-activated protein kinase kinase kinase is
9
phosphorylated. It in turn phosphorylates a specific mitogen-activated protein kinase kinase that phosphorylates a specific mitogen-activated protein kinase (MAPK) such as the extracellular signal-regulated kinase (ERK) 1 and 2, the p38 mitogen-activated protein kinase (p38 MAPK) and JNK. In turn, these MAPKs can activate several transcription factors and/or cytoplasmatic and nuclear kinases (figure 3) (Aouadi, Binetruy et al. 2006, Junttila, Li et al. 2008).
So far, in mammals, four distinct MAPK signalling pathways were described: ERK 1 and ERK 2, that are responsible for cell survival and development, c-jun amino terminal kinase or stress-activated protein kinase (JNK/SAPK), p38 MAPK which are described as stress activated proteins (SAPK) and play a role in host defence mechanisms (Coulthard, White et al. 2009), and ERK5 (Ono and Han 2000, Aouadi, Binetruy et al. 2006, Cuenda and Rousseau 2007, Berridge 2012).
When a redox imbalance occurs, ROS can induce the activation of MAPK signalling pathways. Modification of essential amino acids residues by ROS that consequently alters the protein structure and function is one of the plausible mechanisms of MAPKs activation (Son, Cheong et al. 2011). In addition, MAPKs activation may occur directly by interaction with membrane receptors, such as Figure 3. Protein scaffold of MAPK pathways involved in oxidative stress. When an intracellular or an extracellular stimulus occurs, the phosphorylation of MAPKKK (MAP3K) is initiated. MAP3K in turn, phosphorylates MAPKK (MAP2K), which in succession phosphorylates MAPKs. The activated MAPKs consequently phosphorylate several substrates that are important for cellular activities such as development, differentiation, growth and apoptosis. Extracted from Son, Cheong et al 2011.
10
endothelial growth factor receptor and platelet-derived growth factor receptor (McCubrey, LaHair et al. 2006) or indirectly due to oxidation of MAPKs related proteins, such as protein tyrosine phosphatases (Finkel 2003, Son, Cheong et al. 2011).
1.4.1. Extracellular signal-regulated protein kinase 1 and 2 pathway
ERK 1/2 is a member of one of the most important pathways of MAPK signalling (Berridge 2012) once it participates in essential cellular functions as control of cell proliferation, differentiation, cell survival and the synaptic plasticity responsible for learning and memory (Junttila, Li et al. 2008, Berridge 2012). The ERK 1/2 pathway can be activated by mitogens, phorbol esters, growth factors and oxidative stress (Daoud, Amyot et al. 2005, Junttila, Li et al. 2008).
In pregnancy events, ERK 1/2 is also necessary because it is implicated in placental development (Aouadi, Binetruy et al. 2006), trophoblast differentiation and decidual invasion (Daoud, Amyot et al. 2005, Moon, Park et al. 2008). In fact, it has been shown that inhibition of ERK 1/2 alone reduces trophoblast migration (Moon, Park et al. 2008) and when in parallel with p38 MAPK decreases trophoblast differentiation (Daoud, Amyot et al. 2005).
1.4.2. p38 Mitogen-activated kinase pathway
The p38 MAPK pathway is also an important MAPK signalling pathway (Berridge 2012), that is activated by cytokines (Coulthard, White et al. 2009) and a wide range of environmental stress agents, as osmotic redox and radiation stress (Berridge 2012). This pathway is important in the control of apoptosis, inflammation, cell cycle regulation, senescence and oncogenesis (Ono and Han 2000, Coulthard, White et al. 2009).
The p38 MAPK has four isoforms: p38α, p38β, p38γ and p38δ (Cuenda and Rousseau 2007). The p38α isoform is the most well characterized and is described to play a vital role in placental embryonic development and placental angiogenesis (Mudgett, Ding et al. 2000). In a mouse model, it was demonstrated that disruption of p38α results in defective placental angiogenesis, leading to abnormal placental development or even to embryo death (Mudgett, Ding et al. 2000).
11
1.4.3. C-jun amino terminal kinase pathway
It is believed that JNK pathway is involved in the control several cellular processes such as cellular proliferation, apoptosis and embryonic development (Berridge 2012). It was also demonstrated that JNK pathway plays a role on promoting cell survival during pre-eclampsia (Padmini, Uthra et al. 2012).
1.5. Pregnancy-associated disorders
1.5.1. Hypertension
Hypertension is the most common disorder during pregnancy. It occurs approximately 15 % of pregnancies and may cause maternal and foetal morbidity and mortality (James and Nelson-Piercy 2004).
Hypertension can be divided into 3 groups (James and Nelson-Piercy 2004): chronic hypertension, which presently complicates 3% to 5% of pregnancies; gestational hypertension complicates 6–7% of pregnancies and resolves post-partum; and pre-eclampsia, which complicates 3%-14% of pregnancies (Agarwal, Aponte-Mellado et al. 2012). Pre-existing hypertension is a risk factor for the development of pre-eclampsia.
1.5.1.1. Pre-eclampsia
Pre-eclampsia is known as a complex pregnancy multisystem disorder that affects both the mother and foetus (Hubel 1999, Gupta, Agarwal et al. 2005). It has an incidence between 3%-14% (Agarwal, Aponte-Mellado et al. 2012) and is the leading cause of maternal and foetal morbidity and mortality (Hubel 1999, Agarwal, Aponte-Mellado et al. 2012). Pre-eclampsia is characterized by hypertension, edema and urinary albumin loss (Serdar, Gür et al. 2002), generalized vasospasm (Lázár 2012) that may lead to renal, liver and brain damage in the setting of eclampsia. In addition, it can lead to placental abruption, preterm delivery, IUGR and foetal death (Sibai, Dekker et al. 2005, Steegers, von Dadelszen et al. 2010). In this pregnancy disorder, trophoblast invasion is limited into the decidua basalis and insufficient spiral arteries remodelling occurs (figure 4) (Hubel 1999, Jauniaux, Poston et al. 2006, Redman and Sargent 2009).
12 Figure 4. Trophoblast invasion and spiral arteries remodelling. Trophoblasts invade the decidua
basalis and the adjacent myometrium leading to a remodelling of spiral arteries that become flaccid vessels. In pregnancy disorders like preeclampsia and IUGR the trophoblasts invade only the decidua basalis and the remodeling of spiral arteries is limited to the same tissue. Extracted from Bell 2004.
In a normal pregnancy, trophoblasts invade both decidua basalis and the adjacent myometrium leading to a remodelling of the spiral arteries (Lyall 2002). However, in the case of pre-eclampsia, trophoblast invasion and spiral arteries remodelling into flaccid vessels is restricted to the decidua basalis (Hubel 1999, Roberts and Escudero 2012). Deficient placentation will alter blood flow and result in an intermittent velocity of the utero-placental arterial blood flow with phenomena of hypoxia/reperfusion, which in turn leads to enhanced ROS production and OS establishment (Redman and Sargent 2009). It is believed that OS is an important factor in the development of this pathology (Hubel 1999, Gupta, Agarwal et al. 2005).
In placentae from pre-eclamptic women it was demonstrated that both the expression and activity of total SOD were decreased (Hubel 1999). Phospho-p38α and ERK1/2 were also significantly reduced (Webster, Brockman et al. 2006). Protein carbonylation, lipid peroxidation and DNA damage were also reported to be higher in the placenta and in decidua basalis from pregnancies complicated with preeclampsia
13
when compared with normal pregnancies (Serdar, Gür et al. 2002, Myatt and Cui 2004, Fujimaki, Watanabe et al. 2011).
1.5.1.2. Intrauterine Growth Restriction
IUGR is described as a pregnancy complication in which there is a failure of the foetus from achieving its genetic growth potential (Scifres and Nelson 2009, Lázár 2012). It may lead to foetal death, perinatal morbidity and in child it may lead to lifelong disorders such as hypertension, renal and cardiovascular diseases (Scifres and Nelson 2009). Aneuploidies, malformations, infections, metabolic factors, placental disorders and OS are recognized as causes for IUGR (Scifres and Nelson 2009, Lázár 2012).
In IUGR, as in pre-eclampsia, a deficient trophoblast invasion and insufficient spiral arteries remodelling, confined to the decidua basalis, is also observed (Jauniaux, Poston et al. 2006, Redman and Sargent 2009, Scifres and Nelson 2009). This leads to a hypoxia/reperfusion phenomena resulting from reduced velocity of the utero-placental arterial flow which, once again, leads to local OS (Redman and Sargent 2009) that is also thought to antedate the development of this pathology (Hubel 1999, Gupta, Agarwal et al. 2005).
14
1.6. Aims
Information about the age-related role of oxidative and nitrative stress in signalling mechanisms of placenta and placental bed remain rather vague. It is thus important to improve our knowledge on the damage caused by redox imbalance in these tissues. Although no single theory purposes an inclusive explanation for the mechanisms underlying ageing, a better understanding of the downstream effects of imbalanced redox status in cells from the reproductive tract may enhance our understanding of female reproductive ageing. In the future, it may lead to the development of preventive or therapeutic strategies answering to improve placenta function and reduce morbidity and mortality associated to pregnancy in aged women.
Based on the published knowledge about OS in the placental bed and its consequence on pregnancies, it is hypothesized that at older reproductive age, the uterus is more prone to redox homeostasis imbalance, which, as consequence, alters key signalling pathways at the uterine placental site that contribute to disruption of foetal/placental interactions and increases the likelihood of developing pregnancy complications. Therefore, to address this hypothesis three major aims were defined:
1) Determine oxidative stress status in uterine samples from placental bed of young and aged pregnant women;
2) Evaluate, the effect of women’s age in the local modulation of cell signalling; 3) Determine oxidative stress status in uterine samples from placental bed of young
and aged pregnant women with chronic hypertension, chronic hypertension and pre-eclampsia and gestational hypertension and intrauterine growth restriction of the foetus.
17
2. Methods
2.1. Tissue collection
Dr. Luis Guedes-Martins, MD, PhD Student, from Centro Hospitalar do Porto, EPE, collected all human samples. The protocol was approved by ethical committee of “Centro Materno-Infantil do Porto”. Volunteers, in accordance with the Institution’s guidelines, gave written consent to be included in this study. All human samples were collected at delivery by elective caesarean section. Uterine pieces were taken from the placental site, processed for structural studies and a stock was stored at – 80 ºC for molecular study.
Women were separated into four groups. Group one had no pathologies; group two had gestational hypertension plus IUGR; group three had chronic hypertension; group four had chronic hypertension plus pregnancy-associated pre-eclampsia.
2.2. Tissue lysation
A small unthawed portion of tissue was cut from samples frozen at -80 ºC and cut again to smaller portions. Tissue was homogenized, using a glass homogenizer (Heidolph), in 500 µL of ice-cold lysis buffer (10 mM NaCl, 5 mM EDTA, 50 mM Tris-HCl pH 7.5 and 1% SDS) containing proteases inhibitors (P8340, Sigma-Aldrich) and phosphatases inhibitors (P0044, P5726, Sigma-Aldrich). Afterwards, the lysates were sonicated and centrifuged at 1500 rpm for 5 minutes. The pellet was rejected and supernatants were stored at -80 ºC for future experiments.
2.3. Protein quantification – Lowry method
The protein content of tissue lysates was determined by Lowry method using Folin-Ciocalteau reagent (F-9252, Aldrich) and BSA (A9647-1006, Sigma-Aldrich) as standard. The albumin standard curve was prepared as shown in table I departing from an albumin stock solution of 2 µg/µL.
18
Table I - BSA standard curve.
Samples Albumin solution (µL) Protein mass (µg) Sample buffer (µL)
Blank 0 0 200 P1 40 0.4 160 P2 80 0.8 120 P3 120 1.2 80 P4 160 1.6 40 P5 200 2 0
Tissue lysate samples (50 µL) were pre-incubated with the reactive mixture (250 µL) for 10 minutes, at room temperature, which was prepared by mixing 2.5 µl of 1% CuSO4 with 2.5 µl of 2% KNaC4H4O6 followed by the addition of 245 µl of 2% NaCO3
in 0.1 N NaOH. After pre-incubation Folin-Ciocalteau reagent (25 µl diluted with water in the proportion of 1:1) was added to the mixture and in the dark for 30 minutes, at room temperature for colour development. The mixture was transferred to a 96 well plate (Sarstedt) and protein content was measured by spectrophotometry (Tecan ®), at 750 nm.
2.4. Western Blotting
Equal amounts of protein were mixed with 4x sample buffer (1,875 M Tris-HCl pH 8.8, 8% SDS, 40% glycerol, 0.5 M EDTA, 1 M DTT and 0.2% Bromophenol blue), heated at 65 ºC for 15 minutes, then at 95 ºC for 5 minutes and centrifuged at 15 000 for 5 minutes. The samples were resolved in Laemmli electrophoresis running buffer (125 mM Tris Base, 250 mM Glycine, 0,1% SDS), in a SDS-Page System set (BioRad) for 1 hour, at 25 mA/gel unit, and electrotransferred to a nitrocellulose membrane in Tris-glycine transfer buffer (25 mM Tris Base, 390 mM Glycine and 0.37% SDS) containing 20% methanol for 2 hours, at 25 volts. Afterwards, membranes were washed in distilled water, stained with Ponceau S (0.2% Ponceau, 3% trichloroacetic acid and 3% sulfosalicylic acid) and photographed in a ChemidocTM MP imaging system (BioRad). Then, they were washed with TBS-T (20 mM Tris, 137 mM NaCl, 0.05 mM tween ® 20), blocked for 1 hour in 5% non-fat dry milk in TBS-T and incubated with the appropriated primary antibody overnight at 4 ºC, with agitation. In the following day, membranes were washed with TBS-T for 30 minutes (TBS-T was changed every 10
19
minutes) and probed with donkey secondary antibody [1/15000 anti-rabbit HRP (711-035-152, Jackson ImmunoResearch)] in 5% non-fat dry milk in TBS- T for 1 hour at room temperature, also with agitation. Blots were then washed with TBS-T for 30 minutes (TBS-T was changed every 10 minutes) and detected with a chemiluminescent agent (170-5061, BioRad) for 5 minutes, at room temperature. The reaction was visualized in a ChemidocTM MP imaging system (BioRad).
The Ponceau S staining was used for protein normalization and quantification was performed using Image version 4.0.1 (BioRad).
Table II – Primary antibodies used
Primary antibodies Dilution Reference, Company
SOD I 1:2000 SOD-100 Stressgen Biotechnologies
SOD II 1:2000 SOD-110, Stressgen Biotechnologies
Sirtuin 2 1:1000 S8447, Sigma-Aldrich
HSP70 1:1000 #4873, Cell Signal
Phospho-p38α 1:500 #9215, Cell Signal
Phospho-JNK 1:1000 Sc-6254, Santa Cruz Biotechnologies
2.5. Protein carbonylation
Tissue lysation, protein quantification, electrophoresis, electrotransference and Ponceau S staining were performed as described in Western Blotting. Membranes were then equilibrated in 20% methanol (32213, Sigma-Aldrich) in TBS for 5 minutes and washed in 10% TFA (20751-261, Merck) for 5 minutes. Afterwards, membranes were incubated in 10 mM DNPH (42210-256-F, Sigma-Aldrich) in 10% TFA for 10 minutes in the dark, at room temperature, with agitation. Membranes were washed first in 10% TFA for 25 minutes (TFA was changed every 5 minutes) and then in 50% methanol for 5 minutes. Next, membranes were blocked in 5% BSA in TBS-T for 1 hour and incubated with appropriated rabbit primary antibody (1/10000 anti-DNP) (D9656, Sigma-Aldrich) overnight, at 4 ºC. In the next day, membranes were washed with TBS-T for 30 minutes (TBS-TBS-TBS-T was changed every 10 minutes) and probed with fluorescent secondary antibody (1/15000 goat anti-rabbit; 926-32213, Li-Cor Biosciences) in 5% BSA in TBS-T for 1 hour in the dark, at room temperature, with agitation. Blots were then washed, in the dark, with TBS-T for 20 minutes, (TBS-T was changed every 10 minutes) and washed again with TBS-Triton 0.2% (T9284, Sigma-Aldrich) for 10
20
minutes. Membranes were visualized in an Odyssey® CLx Infrared Imaging System (Li-Cor Biosciences).
The Ponceau S staining was used for protein normalization and quantification was performed using Image Studio Lite version 3.1 (Li-Cor Biosciences).
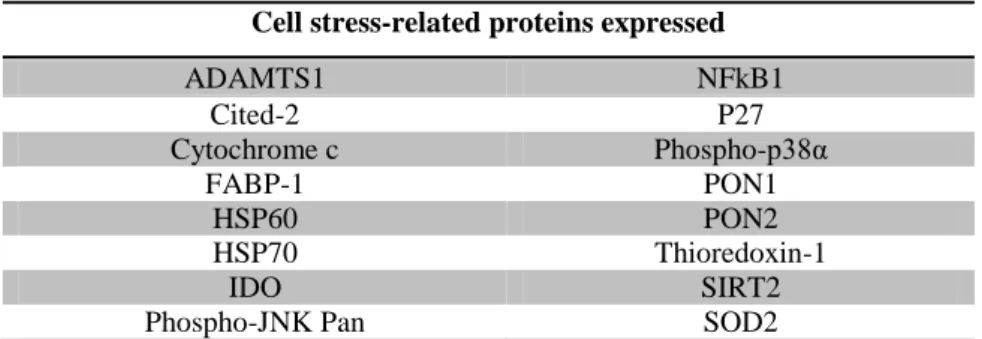
2.6. Human Cell Stress Array
The antibody array (ARY018, R&D Systems) is composed of 26 cell stress-related proteins, listed in table III. All the above-described procedures were performed following the manufacturer’s instructions.
A similar small portion of tissue was cut from samples frozen at -80 ºC (without thawing) and crushed in a glass homogenizer (Heidolph) with PBS (10 mM dissodium phosphate, 1,8 mM monopotassium phosphate, 137 mM sodium chloride, 2,7 mM potassium chloride) containing proteases inhibitors (P8340, Sigma-Aldrich) and phosphatases inhibitors (P0044, P5726, Sigma-Aldrich). After homogenization, Triton X-100 (T9284, Sigma-Aldrich) was added to a final concentration of 1% and samples were frozen at -80 ºC. Tissue lysates were then thawed and centrifuged at 1000 rpm for 5 minutes. Protein quantification was performed by Bradford method (described below). Nitrocellulose membranes containing the antibodies were blocked with array buffer 6 for 1 hour, at room temperature, with agitation in an appropriate 4-well multi-dish plate. While the membranes were blocking, 600 µg of protein (up to 1 ml) was mixed with 500 µL of array buffer 4 and then with array buffer 6 to a final volume of 1.5 ml. Reconstituted Detection Antibody Cocktail (20 µl) was added to the mixture and incubated for 1 hour, at room temperature. After aspiration of the array buffer 6 from the 4-well multi-dish plate sample/antibody mixtures were added to the nitrocellulose membranes and incubated overnight at 4 ºC, with agitation.
In the following day, membranes were washed with wash buffer for 30 minutes (wash buffer was changed every 10 minutes) and incubated with diluted streptavidin-HRP in array buffer 6 for 30 minutes, at room temperature, with agitation. Membranes were then washed for 30 minutes (wash buffer was changed every 10 minutes) and incubated with Chemi Reagent Mix for 5 minutes, at room temperature. The reaction was visualized in a ChemidocTM MP imaging system (BioRad).
21 Table III. Capture antibodies in human cell stress array.
ADAMTS1 HIF-2α Phospho-p38α (T180/Y182)
Bcl-2 Phospho-HSP27 (S78/S82) Phospho-p53 (S46)
Carbonic Anhydrase IX HSP60 PON1
Cited-2 HSP70 PON2
COX-2 IDO PON3
Cytochrome c Phospho-JNK Pan (T183/Y185) Thioredoxin
Dkk-4 NFkB1 Sirtuin2
FABP1/ L-FABP p21/CIP1 SOD2
HIF-1α p27/ Kip1
Table abbreviations: ADAMTS1 - A Disintegrin And Metalloproteinase with Thrombospondin Motifs 1, Bcl-2 - B-cell lymphoma
2, Cited-2 - Cbp/p300-interacting transactivator 2, COX-2 - ciclo-oxigenase 2, Dkk-4 - Dickkopf-related protein 4, FABP-1 - Fatty acid protein binding 1, HIF - Hypoxia-inducible factor , HSP27 – Heat shock protein 27, HSP60 – Heat shock protein 60, Heat shock protein 70, IDO - Indoleamine-pyrrole 2,3-dioxygenase, JNK - c-Jun N-terminal kinases, NFkB1 - Nuclear factor NF-kappa-B p105 subunit , p21/CIP1 - Cyclin-dependent kinase inhibitor 1A , p27/ Kip1 - Cyclin-dependent kinase inhibitor 1NF-kappa-B, PON - Serum paraoxonase/arylesterase, SOD2 – Superoxide dismutase 2
2.7. Protein quantification – Bradford method
A commercial Bradford solution 5x (BioRad) was diluted to a bradford solution 1x, in water. The albumin standard curve was prepared as shown in table IV departing from an albumin stock solution of 1 µg/µL.
Table IV – BSA standard curve.
Samples Albumin solution (µL) Protein mass (µg) Sample buffer (µL)
Blank 0 0 100 P1 20 0.2 80 P2 40 0.4 60 P3 60 0,6 40 P4 80 0,8 20 P5 100 1 0
In a 96 well plate (Sarstedt) 5 µL of each sample or standards were mixed with 95 µL of Bradford solution 1x. Mixture was left reacting 5 minutes at room temperature and protein content was measured by spectrophotometry (Tecan ®) at 595 nm.
22
2.8. Human Phospho-kinase Array kit
Tissue lysation and protein quantification were performed as described in human cell stress array Kit. The human phospho-kinase array kit (Ary 003B, R&D Systems) comprises a panel of site-specific phosphorylation of 43 kinases and 2 related total proteins listed in table V. All the above-described procedures were employed following the manufacturer’s instructions.
For each sample two nitrocellulose membranes (Part A and Part B) containing the antibodies were blocked with array buffer 1 for 1 hour, at room temperature, with agitation. While membranes were blocking, 600 µg of protein (up to 334 µL) was mixed with array buffer 1 to a final volume of 2 ml. After aspiration of blocking buffer, 1 ml of sample mixture was added to part A and B of the nitrocellulose membrane and incubated overnight at 4 ºC, with agitation.
In the following day, membranes were washed for a total time of 30 minutes (with buffer changes every 10 minutes) and each membrane A and B were incubated with the respective detection antibody cocktail for 2 hours, at room temperature, with agitation. Then, membranes were washed again for 30 minutes (wash buffer was changed every 10 minutes) and incubated with diluted streptavidin-HRP for 30 minutes, at room temperature, with agitation. Finally, membranes were severally washed for 30 minutes (wash buffer was changed every 10 minutes) and incubated with Chemi Reagent Mix for 5 minute, at room temperature. The reaction was visualized in ChemidocTM MP imaging system (BioRad).
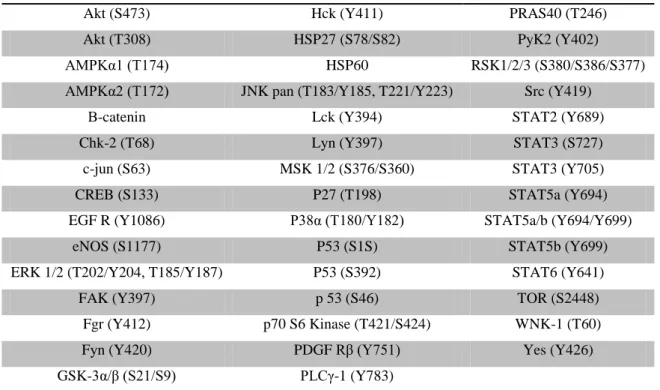
23 Table V. Capture antibodies in human phospho-kinase array kit.
Akt (S473) Hck (Y411) PRAS40 (T246)
Akt (T308) HSP27 (S78/S82) PyK2 (Y402)
AMPKα1 (T174) HSP60 RSK1/2/3 (S380/S386/S377) AMPKα2 (T172) JNK pan (T183/Y185, T221/Y223) Src (Y419)
Β-catenin Lck (Y394) STAT2 (Y689)
Chk-2 (T68) Lyn (Y397) STAT3 (S727)
c-jun (S63) MSK 1/2 (S376/S360) STAT3 (Y705)
CREB (S133) P27 (T198) STAT5a (Y694)
EGF R (Y1086) P38α (T180/Y182) STAT5a/b (Y694/Y699)
eNOS (S1177) P53 (S1S) STAT5b (Y699)
ERK 1/2 (T202/Y204, T185/Y187) P53 (S392) STAT6 (Y641)
FAK (Y397) p 53 (S46) TOR (S2448)
Fgr (Y412) p70 S6 Kinase (T421/S424) WNK-1 (T60)
Fyn (Y420) PDGF Rβ (Y751) Yes (Y426)
GSK-3α/β (S21/S9) PLCγ-1 (Y783)
Table abbreviations: Akt – Protein kinase B, AMPKα1 - AMP-activated protein kinase alpha 1, AMPKα2 - AMP-activated protein
kinase alpha 2, Chk-2 - Checkpoint kinase 2, CREB - cAMP response element-binding protein, EGF R - Epidermal growth factor receptor, eNOS – Endothelial nitric oxide synthases, ERK1/2 – Extracellular signal-regulated kinase 1 and 2, FAK - Focal Adhesion Kinase, Fgr - Feline Gardner-Rasheed sarcoma viral oncogene, GSK-3α/β - Glycogen Synthase Kinase 3 alpha and beta, Hck - hemopoietic cell kinase, Lck - Lymphocyte-specific protein tyrosine kinase, Lyn - v-yes-1 Yamaguchi sarcoma viral, MSK 1/2- mitogen- and stress-activated kinase 1 and 2, PDGF Rβ - Platelet-derived growth factor receptor beta, PLCγ-1 -
Phosphoinositide-specific phospholipase C gama 1, PyK2 - Pyruvate kinase 2, RSK1/2/3 - Ribosomal s6 kinase 1, 2 and 3, Src- v-src avian sarcoma (Schmidt-Ruppin A-2) viral oncogene, STAT - Signal transducer and activator of transcription, WNK-1 - WNK lysine deficient protein kinase 1.
2.9. Statistical analysis
Arithmetic means are given with standard error mean (SEM). Statistical analysis was carried out with a Student's t-test. All the association between protein expression and increasing maternal age was calculated using the Pearson correlation coefficient (r). The respective plots display a fitted linear regression line. A P-value less than 0.05 was assumed to denote a significant difference.
27
3. Results
3.1. Reproductive ageing and redox balance in placental bed.
3.1.1. Protein array.
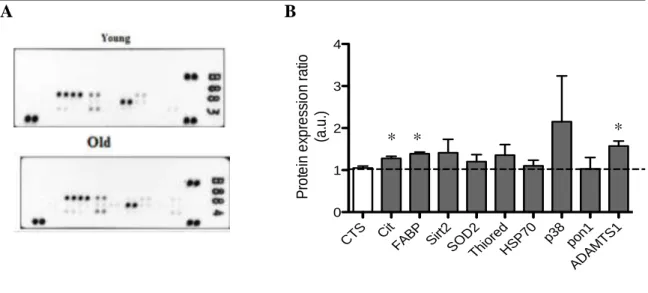
It is known that cellular oxidative stress may alter cell function and contribute to the development of several pregnancy-related pathologies. Knowing that age is also a risk factor for their development, it was decided to evaluate the expression of several cell stress related proteins in tissue lysates from placental bed of young (less than 25 years-old) and reproductively older (more than 34 years-old) women. The array was performed according to manufacturer’s instructions and results are shown in table VI and figure 5.
Table VI enumerates the 16 cell stress-related proteins that are expressed in placental bed.
Table VI - Identification of cell stress-related proteins in placental bed tissue. Cell stress-related proteins expressed
ADAMTS1 NFkB1 Cited-2 P27 Cytochrome c Phospho-p38α FABP-1 PON1 HSP60 PON2 HSP70 Thioredoxin-1 IDO SIRT2
Phospho-JNK Pan SOD2
For each protein expressed the average signal of protein duplicate spots was quantified and a ratio between reproductive older versus young women was determined. A ratio superior to 1 indicates increased protein expression in reproductively aged women. It was considered that a protein increase over 20% might denote biological significance. Cytochrome c, FABP-1, sirtuin 2, SODII, thioredoxin, phospho-p38α and ADAMST-1 all had a mean increase in protein expression superior to 20%. However, in the human cell stress array statistical significance was only obtained for cytochrome c, FABP-1 and ADAMTS1 (figure 5).
28
A B
Figure 5. Human cell stress array profile in placental bed. Relative expression of 26 cell stress related
proteins was determined in placental bed lysates from young (less than 25) and reproductively older (more than 34) women. (A) Representative arrays. (B) Ratio reproductive older/young of the quantification of the average signal of protein duplicates. Columns represent the mean of 3 experiments per group; vertical lines show error bars. (*) Significantly different from control values using the student t test (P < 0.05).
3.1.2. Western blotting – Protein array validation.
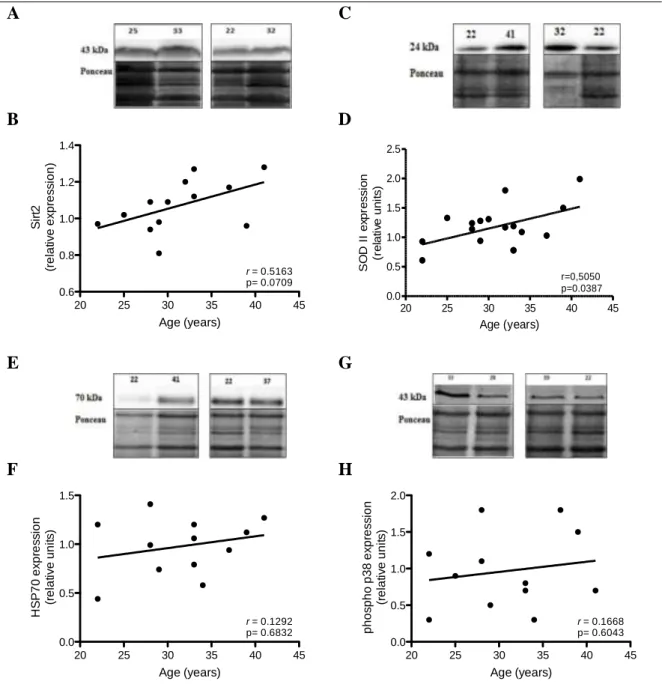
To validate the results obtained in the cell stress-related protein array the effect of maternal age in the expression of sirtuin 2, SODII, HSP70 and phospho-p38α was evaluated by western blotting.
In the cell stress-related protein array, sirtuin 2 expression in placental bed had a mean increase over 20%. Western blot results for sirtuin 2 denote an increase in protein expression in women with advanced reproductive age (Figure 6 A and B). A Pearson correlation value of 0.52 suggests a moderate positive correlation, but it did not reach statistical significance. Western blot for SODII was also performed and results are shown in figure 6 C and D. SODII expression increased significantly along maternal age. As for sirtuin 2, a Pearson correlation value of 0.51 suggests a moderate positive correlation between SODII expression and maternal age. HSP70 western blot results confirm the expression pattern obtained in the cell stress array. No correlation was observed between maternal age and HSP 70 expression in placental bed (Figure 6 E and F). No correlation was also observed between maternal age and protein expression regarding phospho-p38α protein expression (Figure 6 G and H). The great dispersion observed in the plotted values confirms the major error bar obtained in the array.
CTS C it FABP Sir t2 SO D2 Thio red HSP70 p3 8 pon1 ADAM TS1 0 1 2 3 4 P ro te in e xp re ss io n r a tio (a .u .) * * *
29
The results obtained in western blot studies are consistent with the results from the array and thus validate the obtained data.
A C
B D
E G
F H
Figure 6. Effect of age on cell stress-related protein expression. Protein expression was determined in
placental bed tissue obtained from women between 22 and 41 years old. (A, C, E, G) Representative western blots for Sirtuin 2, SODII, HSP70 and phospho- p38, respectively. Quantification of sirtuin 2 (B), SODII (D), HSP70 (F) and phospho p38 (H) protein expression. In each experiment the Ponceau S staining was used for protein normalization. Data are expressed as relative densitometric units and are plotted according to maternal age (r Pearson coefficient).
20 25 30 35 40 45 0.6 0.8 1.0 1.2 1.4 Age (years) S ir t2 (r e la ti v e e x p re s s io n ) r = 0.5163 p= 0.0709 20 25 30 35 40 45 0.0 0.5 1.0 1.5 2.0 2.5 r=0,5050 p=0.0387 Age (years) S O D I I e xp re s s io n (r e la ti ve u n it s ) 20 25 30 35 40 45 0.0 0.5 1.0 1.5 Age (years) H S P 7 0 e x p re s s io n (r e la ti v e u n it s ) r = 0.1292 p= 0.6832 20 25 30 35 40 45 0.0 0.5 1.0 1.5 2.0 Age (years) p h o s p h o p 3 8 e x p re s s io n (r e la ti v e u n it s ) r = 0.1668 p= 0.6043
30
3.1.3. Oxidative stress marker - protein carbonylation.
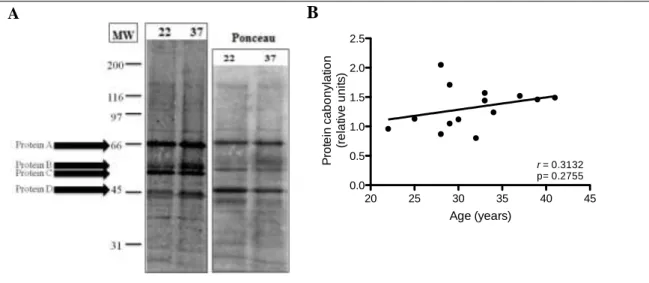
Oxidative stress may modify biological molecules. In the case of proteins, ROS may lead to the oxidation of amino acid residue side chains, to the formation of protein-protein cross-linkages and to oxidation of protein-protein backbone, which result in loss of function and protein fragmentation (Berlett and Stadtman 1997). These oxidative modifications lead to the formation of protein carbonyl derivatives, which are commonly seen as a biomarker of oxidative stress. Western blotting using an anti-DNP antibody was the method used to detect and quantify protein carbonylation in placental bed samples.
A B
Figure 7. Effect of age on DNP expression. DNP expression was determined in placental bed tissue
obtained from women between 22 and 41 years old. (A) Representative western blots. (B) Quantification of protein expression. In each experiment the Ponceau S staining was used for protein normalization. Data are expressed as relative densitometric units and are plotted according to maternal age (r Pearson coefficient).
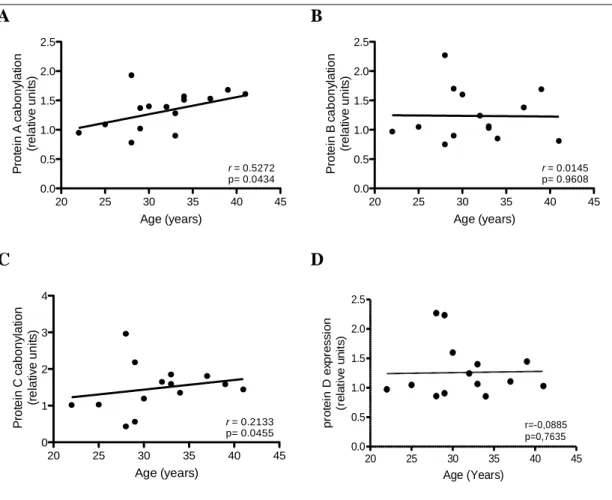
After quantification of total protein carbonylation in the analysed samples, no correlation was observed between these two variables. However, when performing quantification of protein carbonylation by western blot it is possible to measure specific carbonylation bands. As such, proteins highly carbonylated were given random letters from A to D and quantified separately. Figure 8 shows that a moderate positive correlation, with statistical significance, between age and specific carbonylation of protein A is occurring. 20 25 30 35 40 45 0.0 0.5 1.0 1.5 2.0 2.5 Age (years) P ro te in c a b o n y la tio n (r e la tiv e u n it s ) r = 0.3132 p= 0.2755
31
A B
C D
Figure 8. Effect of age on DNP expression in different proteins . DNP expression was determined in
placental bed tissue obtained from women between 22 and 41 years. (A, B, C, D) Quantification of protein A, protein B, protein C and protein D carbonylation, respectively. In each experiment the Ponceau S staining was used for protein normalization. Data are expressed as relative densitometric units and are plotted according to maternal age (r Pearson coefficient).
3.2. Reproductive ageing and cell signalling.
3.2.1. Protein array.
As oxidative stress can alter cell signalling and thus affect important cell functions it was evaluated a panel of site-specific phosphorylation of 43 kinases using the human phospho-kinase array kit (Ary 003). The array was performed according to manufacturer’s instructions and results are shown in figure 9 and table VII.
20 25 30 35 40 45 0.0 0.5 1.0 1.5 2.0 2.5 r = 0.5272 p= 0.0434 Age (years) P ro te in A c a b o n y la ti o n (r e la ti v e u n it s ) 20 25 30 35 40 45 0.0 0.5 1.0 1.5 2.0 2.5 r = 0.0145 p= 0.9608 Age (years) P ro te in B c a b o n y la ti o n (r e la ti v e u n it s ) 20 25 30 35 40 45 0 1 2 3 4 r = 0.2133 p= 0.0455 Age (years) P ro te in C c a b o n y la tio n (r e la tiv e u n its ) 20 25 30 35 40 45 0.0 0.5 1.0 1.5 2.0 2.5 r=-0,0885 p=0,7635 Age (Years) p ro te in D e xp re s s io n (r e la ti v e u n its )
32 Table VII - Identification of phospho-kinase proteins expressed in placental bed tissue.
Phospho-kinase proteins expressed
p38 α RSK 1/2/3 PDGF Rβ Lck
Erk 1/2 eNOS STAT5a/b STAT 2
JNK Pan Fyn WNK 1 STAT 5a
GSK-3α/β Yes PYK2 p70 S6 kinase
P53 Fgr PRAS40 PLC-γ1
EGF R STAT 6 HSP60 Hck
MSK1/2 STAT 5b c-Jun Chk-2
AMPKα1 STAT3 (S727) Src FAK
Akt STAT3 (Y705) Lyn CREB
TOR p27 β-catenin HSP27
AMPKα2
After quantification of the average signal of phosphorylated protein duplicate spots, a ratio between reproductive older versus young women was determined. A ratio superior to 1 indicates increased protein expression in reproductively aged women. The criteria used in the analysis of the present array were the same as for the human cell stress array. It was considered that an increase/decrease over 20%, in the specific phosphorylation site analysed, might denote biological significance. It was observed that the protein with a ratio superior to 1 was phospho-Stat3. Stat 3 had an increase in protein phosphorylation of 139% in S727 and 22% in Y705. Proteins with a decrease over 20% were JNK pan (T183/Y185, T221/Y223), MSK1/2 (S376/S360), Akt (S473), c-jun (S63), p53 (S392), Gsk3-α/β (S21,S9), STAT5b (Y699), LCK (Y394) and Fgr (Y412) (figure 9).
Figure 9. Human phospho-kinase array profile in placental bed. Relative expression of 43 kinase and
2 related proteins was determined in placental bed lysates from young (less than 25) and reproductively older (more than 34) women. (A) Representative arrays. (B) Ratio reproductive older/young of the quantification of the average signal of protein duplicates obtained in placental bed tissue lysates.
A B Ct RSKp7 0 Sta t3 Sta t3 p53 c-Ju n GS K3Akt Sta t5 JNKStat6 PD GF MSK 1/2LCKFgr CR EBSrc 0 1 2 3 P ro te in e x p re s s io n r a ti o (a .u .)
33
For array confirmation, phospho-JNK was evaluated by western blot.
3.2.2. Western blotting – Protein array validation.
To validate the results obtained in the human kinase array kit, phospho-JNK1/2 expression was determined in lysates from placental bed tissue. Figures 10 represents the relative blots of phospho-JNK1 and phosho-JNK2, respectively.
After normalization with Ponceau S, no significant changes were observed for both phospho-JNK1 and phospho-JNK2.
A C
B D
Figure 10. Effect of age on phospho-kinase protein expression.Protein expression was determined in
placental bed tissue obtained from women between 22 and 41 years old. (A, C) Representative western blots for phospho-JNK 1 and phospho-JNK2, respectively. Quantification of phospho-JNK1 (B), phospho-JNK2 (D). In each experiment the Ponceau S staining was used for normalization. Data are expressed as relative densitometric units and are plotted according to maternal age (r Pearson coefficient).
3.3. Redox balance in placental bed and pregnancy-associated disorders.
3.3.1. Western blotting – cell stress related proteins.
Previous studies reported differences in placental antioxidant levels in normal and pregnancies associated disorders such as hypertension, preeclampsia and IUGR.
20 25 30 35 40 45 0.0 0.5 1.0 1.5 2.0 Age (years) p h o s p h o J N K 1 e x p re s s io n (r e la ti v e u n it s ) r = 0.2495 p= 0.4110 20 25 30 35 40 45 0.0 0.5 1.0 1.5 Age (years) p h o s p h o J N K 2 e x p re s s io n (r e la ti v e u n it s ) r = 0.1190 p= 0.6985 A
34
Results for the expression of SODI, SODII and sirtuin 2 in placental bed of normal pregnancies and pregnancies with associated-disorders are depicted in figures 11-13. Figure 11 shows the expression of SODI in normal pregnancies and in pregnancies with associated disorders. Following normalization with Ponceau S staining no changes were observed in SODI, in pregnancies with gestational hypertension plus IUGR. In the group of pregnancies complicated with chronic hypertension and chronic hypertension plus pre-eclampsia SODI expression is increased (Figure 11).
A C
B D
Figure 11. Effect of pregnancy related disorders on superoxide dismutase I expression. Protein
expression was determined in placental bed tissue. (A,C) Representative western blots for SOD I in gestational HT plus IUGR, in chronic hypertension and chronic hypertension plus preeclampsia, respectively. Quantification of SOD I protein expression in gestational HT plus IUGR (B), in chronic hypertension and in chronic hypertension plus pre-eclampsia (D). In each experiment Ponceau S staining was used for normalization. Data are expressed as relative densitometric units (r Pearson coefficient).
No changes in the expression levels of SODII isoform were observed in placental bed from women with the studied pregnancy-associated disorders (Figure 12).
The expression of sirtuin 2 was also evaluated in pregnancy-related disorders. Sirtuin 2 expression is only significantly increased in placental bed from women with pregnancy-associated chronic hypertension and pre-eclampsia (Figure 13).
Normal gHT+ IUGR 0.0 0.5 1.0 1.5 2.0 S O DI e x p re s s io n (r e la ti v e u n it s ) Normal cHT cHT+PE 0.0 0.5 1.0 1.5 2.0
*
S O DI e xp re s s io n (r e la ti ve u n it s )35
A C
B D
Figure 12. Effect of pregnancy related disorders on superoxide dismutase II expression. Protein
expression was determined in placental bed tissue. (A, C) Representative western blots for SOD II in gestational HT plus IUGR, in chronic hypertension and chronic hypertension plus preeclampsia, respectively. Quantification of SOD II protein expression in gestational HT plus IUGR (B), in chronic hypertension and in chronic hypertension plus pre-eclampsia (D). In each experiment the Ponceau S staining was used for protein normalization. Data are expressed as relative densitometric units.
A C
B D
Figure 13. Effect of pregnancy related disorders on Sirtuin 2 expression. Protein expression was
determined in placental bed tissue. (A,C) Representative western blots for Sirtuin2 in gestational HT plus IUGR, in chronic hypertension and chronic hypertension plus preeclampsia, respectively. Quantification of Sirtuin2 protein expression in gestational HT plus IUGR (B), in chronic hypertension and in chronic hypertension plus pre-eclampsia (D). In each experiment Ponceau S staining was used for normalization. Data are expressed as relative densitometric units.
Normal gHT+IUGR 0.0 0.5 1.0 1.5 S O DI I e x p re s s io n (r e la ti v e u n it s ) Normal cHT cHT+PE 0.0 0.5 1.0 1.5 2.0 2.5 S O DI I e xp re s s io n (r e la ti ve u n it s ) Normal gHT+IUGR 0.0 0.5 1.0 1.5 S ir t2 e x p re s s io n (r e la ti v e u n it s ) Normal cHT cHT+PE 0.0 0.5 1.0 1.5
*
S ir t2 e xp re s s io n (r e la ti ve u n it s )36
3.3.2. Oxidative stress marker – protein carbonylation.
It is evidenced that protein carbonylation is increased several pathologies. Figure 14 shows protein carbonylation in placental bed tissues of the studied pregnancy-associated disorders. Total protein carbonylation did not show any significant changes.
A C
B D
Figure 14. Effect of pregnancy related disorders on DNP expression. Protein expression was determined in placental bed tissue. (A,C) Representative western blots for DNP in gestational HT plus IUGR, in chronic hypertension and in chronic hypertension plus preeclampsia, respectively. Quantification of DNP protein expression in gestational HT plus IUGR (B), in chronic hypertension and in chronic hypertension plus pre-eclampsia (D). In each experiment the Ponceau S staining was used for protein normalization. Data are expressed as relative densitometric units.
Specific carbonylation of proteins was performed as in 3.1.3 section. Proteins highly carbonylated were given random letters taking into consideration that the letters were the same for proteins already quantified in 3.1.3 section and between groups. Figure 15 shows that a positive correlation in protein F in gestational HT plus IUGR occurs with statistical significance.
Normal gHT+IUGR 0.0 0.5 1.0 1.5 2.0 2.5 P ro te in c a b o n y la ti o n (r e la ti v e u n it s ) Normal cHT cHT+PE 0.0 0.5 1.0 1.5 2.0 2.5 P ro te in c a b o n y la ti o n (r e la ti ve u n it s )