Umay KAYAALP
July,2013
TWO STAGE ABE FERMENTATION WITH
IN SITU
PERVAPORATION AND HIGH CELL
DENSITY
Dissertation presented to Faculdade de Ciências e Tecnologia, Universidade Nova de Lisboa for obtaining the master degree in Membrane Engineering
TWO STAGE ABE FERMENTATION WITH IN SITU PERVAPORATION AND HIGH CELL DENSITY
The EM3E Master is an Education Programme supported by the European Commission, the European Membrane Society (EMS), the European Membrane House (EMH), and a large international network of industrial companies, research centres and universities (http://www.em3e.eu).
Copyright @ Umay KAYAALP, FCT/UNL
A Faculdade de Ciências e Tecnologia e a Universidade Nova de Lisboa têm o direito, perpétuo e sem limites geográficos, de arquivar e publicar esta dissertação através de exemplares impressos reproduzidos em papel ou de forma digital, ou por qualquer outro meio conhecido ou que venha a ser inventado, e de a divulgar através de repositórios científicos e de admitir a sua cópia e distribuição com objectivos educacionais ou de investigação, não comerciais, desde que seja dado crédito ao autor e editor.
i
ACKNOWLEDGMENTS
I would like to express my deepest appreciation to all those who provided me the possibility to complete this master graduation thesis. A special gratitude I give to my supervisor Wouter Van Hecke, whose contribution in stimulating suggestions and encouragement, helped me to coordinate this period with a fruitful results. Also my adviser Heleen De Wever whose directions and support from the preliminary to the concluding level enabled me to develop an understanding of the subject. Her understanding and support mean lot to me. And finally Silvia Vangeel; I am so grateful for her patience and help during my clumsy times in the laboratory.
And my biggest appreciation to my master coordinators Prof. Isabel Coelhoso and Prof. João Crespo, it has been the greatest honour to be their students. Also all our professors whose efforts enlightened our path; Carla Brazinha, Carla Portugal, Luísa Neves, Svetlozar Velizarov and all the academic staff of FCT Chemistry department.
Elena Vallejo was always there for our problems. On her behalf I want to thank all organization committee of EM3M for giving us such a great chance for master degree.
Without family support you can never express yourselves enough. I am so glad that I am so lucky about my family and they raised me confident enough to seek the reality of the world. And besides that there are some special people that I met on the way from Istanbul to Belgium. Without their presence I may not handle the hard times as easy as now. My twin sister Terica Raquel Sinclair were always there with me sleepless nights. Also I cannot describe how happy I am that I had a real family support here in Mol. Urko Goikolea Ajuriaguerra, Agurtzane Ugarte Ozaeta, Vanessa Drolon, Emre Gunerken, Stephen Andersen and my lab mate Stefano Gandolfi. They were here always there to draw coconut trees on my blues. A very special thanks to Ceren Dursun and Ozan Yildirim to make me feel like in Istanbul whenever I need. And finally I want to thank to my best friend Ekin Dalak because growing up together was the biggest challenge we had and I am glad that we succeed it together.
ii
ABSTRACT
Solvent recovery via in situ pervaporation directly coupled to two stage ABE (Acetone-Butanol-Ethanol) fermentation was studied. Organophilic pervaporation decreased the inhibitory effect of butanol successfully. The permeate enriched to 55-214 g∙L-1 total solvents depending on solvent concentrations in the fermenter. The maximum flux reported was 719 g∙h-1∙m-2 with a total ABE flux of 148 g∙h-1∙m-2. The continuous fermentation was performed for 500 hours with a xylose/glucose mixture (100/50 g∙L-1) feedstock and the maximum overall productivity calculated as 0.7 g∙L-1∙h-1 with lowest dilution rate, 0.017 h-1.
To obtain higher productivities and to be able to deal with high flow rates cell recycling via ultrafiltration was applied to two staged fermentation. Dry cell weight (DCW) in the solventogenic reactor increased to a maximum of 43 g∙L-1 after 44 hours of cultivation, while the average DCW value over 72 hours of operation was 23 g∙L-1. Overall productivity was 1 g∙L-1∙h-1 eventhough the glucose conversion was lower that expected.
Keywords: In situ product recovery (Organophilic pervaporation), Two-stage continuous fermentation,
TABLE OF CONTENTS
ACKNOWLEDGMENTS ... I
ABSTRACT ... II
INDEX OF FIGURES ... III
INDEX OF TABLES ... IV
ABBREVIATIONS ... V
1. INTRODUCTION ... 1
BACKGROUND AND MOTIVATION ... 1
OBJECTIVES ... 1
2. LITERATURE REVIEW ... 2
2.1. HISTORY OF BIOBUTANOL AND CURRENT STIUATION ... 2
2.2. FEEDSTOCK ... 5
2.3. MICROORGANISM ... 9
2.4. FERMENTER CONFIGURATIONS ... 14
2.4.1. BATCH – FED BATCH FERMENTATION ... 17
2.4.2. CONTINUOUS FERMENTATION AND CELL RECYCLING ... 18
2.5. ONLINE PRODUCT RECOVERY ... 28
2.5.1. ORGANOPHILIC PERVAPORATION ... 31
3. ECONOMIC EVALUATION OF BIOBUTANOL PRODUCTION ... 42
3.1. OVERALL VIEW ... 42
3.2. BIOBUTANOL FUTURE ... 45
4. MATERIALS AND METHODS ... 47
4.1. CULTURE AND INOCULATION PREPARATION ... 47
4.2. TWO STAGE FERMENTATION WITH ONLINE BUTANOL REMOVAL ... 47
4.3. SAMPLING AND ANALYSIS ... 48
4.4. HIGH DENSITY FERMENTATION WITH CELL RECYCLING ... 50
5. RESULTS AND DISCUSSION ... 53
5.1 TWO STAGE FERMENTATION WITH ONLINE BUTANOL REMOVAL ... 53
5.2. HIGH CELL DENSITY FERMENTATION WITH CELL RECYCLING ... 59
6. CONCLUSION ... 68
iii
INDEX OF FIGURES
Figure 2.1: Amounts of wood waste and paper and cardboard waste available for biofuel production (PJ/year),
2006 (Eurostat, 2010). ... 6
Figure 2.2: Metabolic pathways of C. acetobutylicum.. ... 11
Figure 2.3: A schematic diagram of the morphological changes observed during continuous fermentation by C. acetobutylicum ... 12
Figure 2.4: (a) Simplified batch reactor. E‐1: autoclaved fermenter (b) Simplified fed‐batch reactor E‐2 recovery unit (optional), E‐3 product collection tank ... 17
Figure 2.5: Simplified continuous reactor. E‐1: autoclaved fermenter, E‐2: recovery unit, E‐3: product collection tank, E‐4 bleed tank ... 18
Figure 2.6: Decrease of the filtrate flow rate of different filter membranes with time... 21
Figure 2.7: Removal Techniques ... 29
Figure 2.8: Pervaporation Unit ... 33
Figure 2.9: (a) Feed channel and flows through a differential element of volume (dz) and (b) temperature gradient along feed flow. ... 35
Figure 2.10: Diffusion through the membrane surface (y axis). ... 36
Figure 3.1:Breakdown of Fossil Energy Use in Various Stages of Fuel Life Cycle for Corn‐Based Butanol ... 45
Figure 4.2 : P&ID scheme of high density cell fermentation setup. ... 50
Figure 5.1: Online data for pH and OD for acidogenic and solventogenic fermenters. S ... 54
Figure 5.2: DCW (g∙ L‐1) function of online OD. ... 54
Figure 5.3: Evolution of concentrations of carbohydrates, VFAs and solvents in acidogenic (left) and solventogenic (right) fermenters. DCW evaluation during time for AF and SF. ... 57
Figure 5.4: Overall flux values for PDMS pervaporation module. ... 57
Figure 5.6: Applied pressures to UF modules. ... 59
Figure 5.7: Online data for pH and OD for acidogenic and solventogenic fermenters. ... 62
Figure 5.8: Evolution of concentrations of carbohydrates, VFAs and solvents in acidogenic (left) and solventogenic (right) fermenters. DCW evaluation during time for AF and SF. ... 65
Figure 5.9: Calculated TMP values for UF modules during fermentation time. ... 66
iv
INDEX OF TABLES
Table 2.1. Comparison of continuous butanol production using different carbon sources with free cells, cell
recycling, or immobilization ... 7
Table 2.2: Commercialized pretreatment routes for corn‐sugar cane, whey permeate and corn stover. ... 8
Table 2.3: A brief summary of ABE production in bioreactors coupled with membrane cell recycle systems ... 23
Table 2.4: Total ABE and Acids Produced and ABE Productivity during Integrated Fermentation/Product Removal Experiments ... 29
Table 2.5: Comparison of selectivity and energy requirement for butanol recovery by different separation methods. ... 31
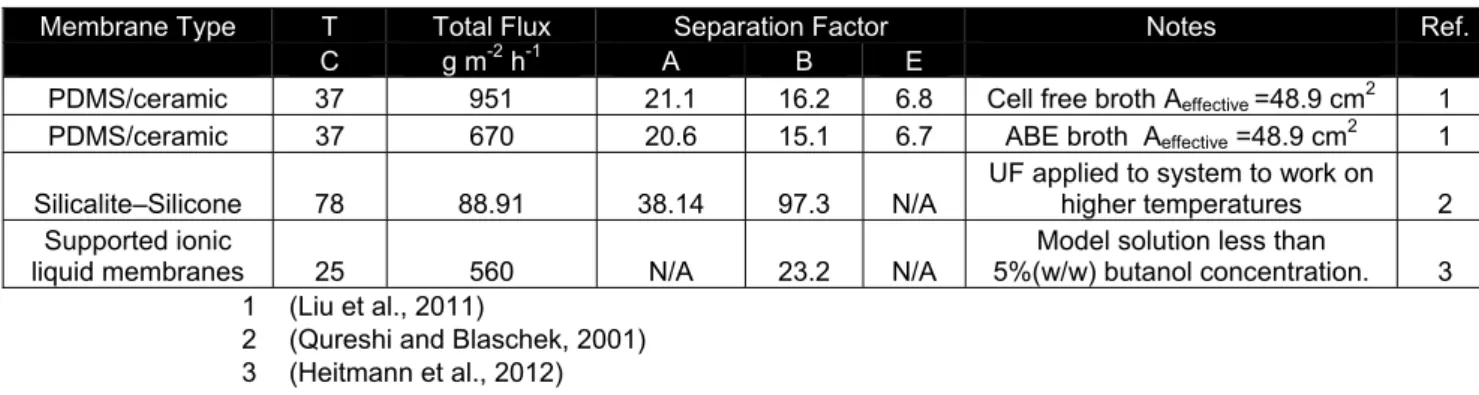
Table 2.6:Performance of ABE fermentations used for ABE separation ... 39
Table 3.1: Properties of ABE Products ... 43
Table 4.1 Dilution rates for component analyses ... 49
Table 4.2: Initial set point values of HCD fermentation ... 51
Table 5.1 : Fermentation profile of two stage continuous fermentation coupled with PDMS pervaporation. ... 59
Table 5.2: Calculated TMP and Permeability values for UF‐2 module for filtrate flux 100 L.m‐2.h‐1 ... 60
Table 5.3: Calculated TMP and Permeability values for UF‐2 module for filtrate flux 300 L.m‐2.h‐1 ... 60
Table 5.4: Calculated TMP and Permeability values for UF‐1 module for filtrate flux 300 L.m‐2.h‐1 ... 61
Table 5.5: Recalculated permeability values for UF‐1 and UF‐2 ... 61
Table 5.6: Time zones used on figures for HCD fermentation. ... 62
Table 5.7: Performance profile for HCD fermentation ... 63
v
ABBREVIATIONS
Symbol Explanation Unit
A Membrane Area m2
AF Acidogenic Fermenter
BC Biochemical
Ci Concentration kg.L-1
D Dilution Rate h-1
DDGS Distiller’s dried grains with solubles
Fi Volumetric flow L.h-1
GREET Greenhouse Gases Regulated Emissions and Energy Use in Transportation
HTR The hydraulic retention time h
ILs Ionic Liquids
J Flux kg.h-1.m-2
LCA Life cycle assessment
LHV Lower Heating Value
M Mass kg
NA Natural Gas
P ov Overall productivity g.h-1. L-1
PABA p-aminobenzoic acid
PDMS polydimethylsiloxane
Pi pressure bar
PM Permeability of Membrane mol.m
-1 .s -1.bar-1 PTMSP Poly[1-(trimethylsilyl)-1-propyne]
PVDF polyvinylidene fluoride
Q Mass Flow kg.h-1
molar heat J.mol-1
rA Reaction rate kg.h-1.L-1
Rp component production rate kg.h-1.L-1
Rx Cell growth rate kg.h-1.L-1
S Substrate concentration kg.L-1
SF Solventogenic Fermenter
SILMs Supported ionic liquid membranes
T Time h
T residence time h
TMP Trans Membrane Pressure
V Volume L
VFA Volatile fatty acids
VOC Volatile Organic Compounds
W Weight of permeate kg
w width of unit m
X Biomass concentration kg.L-1
vi Y x/s yield coefficient for biomass formation on substrate
yi molar concentration of a selectively permeating component in permeate mol.L-1
Density kg.L-1
The effective fraction of water om the feed flow Enrichment Factor
Selectivity
j Molar Flux mol.h-1.m-2
S Solubility Coefficient D Diffision Coefficient
Mass Fraction Molar Fraction
Molar Density mol.L-1
Membrane resistance s.m-2
Heat Capacity of the feed J.C-1.kg-1
1
1. INTRODUCTION
BACKGROUND AND MOTIVATION
The production processes of second generation bio butanol has been taken great attention due to increased energy needs of world population. Butanol is a superior fuel especially with high LHV and transport friendly behaviours. We studied continuous two staged Clostridium Acetobutylicum fermentation with in-situ product recovery via pervaporation and high cell density. These different phenomenons were studied with double combinations in literature but no publication is available up to now for all three applications at same time.
In situ removal is a process that removes the products from fermentation broth while fermentation goes on. Reduced inhibition of solvents allows the higher productivities. Meanwhile high cell density is another approach to increase the productivity. The grown cells are recycled back to fermenter and higher cell/substrate ratio is obtained.
These are the two new approaches to improve butanol fermentation energy balance to positive scale.
OBJECTIVES
Xylose/Glucose mixture as a feed stock will be subject to trial. The conversion of xylose is important since for trials of second generation biofuel production this mixture presents a good simulation especially for lignocellulosic biomass and waste biomass fermentation.
Cell recycling with ultrafiltration membranes (UF) will applied to the system. UF performance, trans membrane pressures will be calculated.
Filtration (UF) to increase cell density in fermenter and allow higher pervaporation temperatures.
2
2. LITERATURE REVIEW
2.1. HISTORY OF BIOBUTANOL AND CURRENT STIUATION
The conversion of plant biomass into solvents for fuel and chemical industry is in principle an old technology. In fact, the fermentation of sugar and starch to ethanol can be regarded as the oldest and largest biotechnological process (for beer and wine production). Butanol is a fermentation product of anaerobic bacteria. In 1862, one of the most famous French microbiologists Louis Pasteur was the first to describe the synthesis of this C4-alcohol by his “Vibrion butyrique” probably by mixed culture fermentation. Nowadays, biobutanol has the economic and technological potential to replace petrochemical derived butanol for the production of fuels from renewable resources. In addition to its usefulness for the biofuel sector, butanol is a valuable C-4 compound for chemical synthesis for which it is presently chemically synthesized from fossil-oil-derived ethylene, propylene, and triethyl-aluminum or carbon monoxide and hydrogen (Dürre, 1998; Zverlov et al., 2006).
3 extender for airplanes, as was demonstrated during the World War 2 when Japan converted its sugar refineries into plants to produce butanol as aviation fuel (Ezeji et al., 2010).
However, the glorious period of ABE fermentation encountered a heavy blow by the end of 20th century, because of the rapid emergence of petrochemical synthetic processes. After a peak in the 1950s, the capacity of the AB fermentation plants in the Western industrialized countries declined constantly due to persistent problems with fermentation reliability because of frequent bacteriophage infections and decreasing quality of molasses by improved sugar processing technology (Zverlov et al., 2006; Chiao and Sun, 2007).
It is only recently that the whole situation has come to a turning point. Coupled with economic reasons more critical problems occurred due to petrochemical based production. An accelerated release of fossil-based CO2 due to human activity is now generally accepted as a major factor contributing to the greenhouse effect. Approximately 28% of the energy available for consumption in the 25 EU countries is attributed to transportation, of which, more than 80% is due to road transport. Worldwide, about 27% of primary energy is used for transportation, which is also the fastest growing sector (Eurostat 2012).
In current situation it has been estimated that 10–12 billion pounds of butanol is produced annually, which accounts for 7–8.4 billion dollar market at current price. Butanol has a projected market expansion of 3% per year. Half of the butanol production is used in the form of butyl acrylate and methacrylate esters used in latex surface coating, enamels and lacquers (Lee et al., 2008a).
Under the Directive 2009/28/EC on the promotion of the use of energy from renewable sources this share rises to a minimum 10% in every Member State in 2020. Regarding the expand of biofuels use in the EU, the Directive aims to ensure the use of sustainable biofuels only, which generate a clear and net Green House Gas (GHG) saving without negative impact on biodiversity and land use.
The total energy demand in transport (public road transport, private cars and motorcycles and trucks) in the EU was 12 EJ in 2005, with an estimated increase to 15 EJ in 2020 (European Commission, 2009). This means that in order to meet the target of 10% renewable energy in transport, 1.2-1.5 EJ biofuel could be needed. If all wood, paper and cardboard waste not already recovered or recycled is used for biofuel production, it could cover 3-4% of the total 2005 fuel demand. If also all waste already used is assumed available for conversion into biofuels, a total of 5-8% of fossil transport fuels could be replaced (European Commission, 2007).
4 could be corn-based ethanol. In addition, of the 36 billion US gallons (140,000,000 m3), no less than 16 billion must be from cellulosic biofuels. The act also contained provisions setting usage requirements for biodiesel (Agency Environmental Protection, 2013).
Some old ABE plants have started to restore the fermentation production again and biotechnological enterprises are planning to establish new plants. The goals are not only to reduce carbon dioxide emissions -as it is agreed in Kyoto and Rio protocols - but also nationally to help reverse stagnation of rural agricultural communities and resulting unemployment and mass migration from rural to urban areas.
The first-generation renewable products have provided a good start on the way of decreasing energy dependence, but may not provide an optimal economic solution across the value chain since the feedstock is not sustainable. Second-generation biofuels are produced from sustainable feedstock. Sustainability of a feedstock is defined by availability of the feedstock, impact on greenhouse gas emissions, and impact on biodiversity and land use. Today Sovert (UK), CATHAY (CN), Cobalt (USA), Green Biologics (UK), Butyl Fuel LLC (USA), Tetravitae Bioscience on behalf of Eastman Chemicals (USA), ABENGOA (ES) can be considered the companies which are most associated with the development of n-butanol as an advanced biofuel and which aim to market.
Despite the production limitations of biobutanol production, like toxicity to the bacteria, low yield and concentration; there is an accelerated growing movement for commercialization of the process. Up to now, generally in industry batch reactor designs are being used. Eventhough it is the most conventional way of biobutanol production, long lag phases and butanol inhibition decrease the economic value of the production.
Overall advantages of butanol over other biofuels can be listed as follows:
Butanol has higher energy content than ethanol and can be blended with gasoline at higher concentrations (11.5% in the United States, with the potential to increase to 16%).
Suitable for transport in pipelines, can be introduced into gasoline easily and without additional supply infrastructure. The current method for transporting the ethanol gasoline mix is by tanker trucks directly to refilling stations, which further increases the cost for bioethanol production. Butanol/gasoline mixtures are less susceptible to separate in the presence of water than
ethanol/gasoline blends, demanding no essential modifications to blending facilities, storage tanks, or retail station pumps.
Butanol has lower vapour pressure than ethanol. Butanol is less corrosive rather than the other solvents.
Production routes from conventional agricultural feedstocks are all possible, supporting global implementation. Lignocelluloses from fast-growing energy crops (e.g., grasses) or agricultural “wastes” (e.g., corn stover) are also feasible feedstock.
5 Compared with conventional unleaded gasoline, ethanol is a particulate-free burning fuel source that combusts with oxygen to form carbon dioxide, water and aldehydes. Gasoline produces 2.44 CO2 equivalent kg∙L-1 and ethanol 1.94 kg∙L-1. However ethanol contains 2/3 of the energy per volume as gasoline, ethanol produces 19% more CO2 than gasoline for the same energy. The Clean Air Act requires the addition of oxygenates to reduce carbon monoxide emissions in the United States (Jacobson, 2007). These insufficient results lead butanol investments to grow faster. Butanol contributes to clean air by reducing emissions and unburned hydrocarbons in the tail pipe exhaust. Butanol has research and motor octane numbers of 113 and 94 compared to 111 and 92 for ethanol (Ladish, 1991) . Although 100% butanol fuel has a slightly lower energy density than gasoline, combustion occurs at a uniform temperature and pressure, as it is a single component fuel. This is different from gasoline as gasoline ignites over a broader temperature and pressure, resulting in incomplete combustion as it is made of many different kinds of molecules. This incomplete combustion results in lower efficiency for internal combustion engines. (Biobutanol.com, 2012)
Since 2006, BP and DuPont have undertaken an extensive program of technology development and fuel testing for biobutanol (isobutanol) to prove the benefits of the molecule over alternative biofuel molecules. Under this trials, Dyson Racing won a American Le Mans Series (ALMS) race in August 2010 using biobutanol as the fuel in a real race car engine. (BP and DuPont, 2012)
By 2010, State-owned Russian Technologies Corporation started to build the country's first biofuel plant. June 2012, in USA seven ethanol plants had expressed an interest in retrofitting isobutanol production technology. Butanol offers a renewable alternative to petro-based chemical-grade butanol - a $10 billion global market. n-Butanol is a key building block chemical in the $85 billion coatings, adhesives and inks market and an intermediate in the $700 billion global polymers market. (European BiofuelsTechnology Platform, 2012)
Abengoa, a Spanish company that produces biosolvents in Brazil, EU and, USA have been engaged in technology development for the production of n-butanol using bio-based ethanol. The company’s bioenergy business has been very active in developing commercial market for cellulosic ethanol, and its 0.1 m m3∙year -1 Kansas biorefinery plant is expected to start production in the fourth quarter of 2013. (Abengoa, 2013)
The history and current market position of biobutanol were covered for general overview of reader. The literature review will continue with fundamental research in next chapter.
2.2. FEEDSTOCK
6 more significant inroads into the world’s energy portfolio. Lignocellulosic biomass and waste products of agricultural processes can be alternative for feedstock. (Qureshi et al., 2008) Lignocellulosic biomass consists of a variety of agro-industrial residues (e.g. corn fiber, corn stover, wheat straw, barley straw and sugarcane bagasse), energy crops (e.g. switchgrass), forestry products (wood chips), and municipal solid wastes. Several lignocellulosic materials such as corn fiber, dried distiller grains and soluble, wheat straw, and switchgrass have been reported and successfully applied in ABE fermentation as substrates to produce butanol. In general, cellulose and hemicellulose present in the lignocellulosic feedstocks are not directly accessible to the microorganisms. Butanol producing Clostridia do not express enzymes with cellulolytic activity. Therefore, lignocellulose has to be pretreated and hydrolyzed to release all the sugars that can be utilized by the microorganisms in the subsequent fermentation process (Howard and Abotsi, 2004; Reddy and Yang, 2005; Kumar and Gayen, 2011).
Two lignocellulosic waste source available – wood waste and paper and cardboard waste. Leduc and Wetterlund, 2010; studied lignocellulosic waste production based on Eurostat statistics with the date of 2010. Figure 2.1. shows the waste production of EU. Wood waste defined as waste from the forest industry and from construction and demolition of buildings. Paper and cardboard waste includes for example collected waste as well as waste from pulp, paper and cardboard production.
Figure 2.1: Amounts of wood waste and paper and cardboard waste available for biofuel production (PJ/year),
2006 (Eurostat, 2010).(Leduc and Wetterlund, 2010)
7 Zheng et al. (2013) and Kumar et al. (2011); reviewed the carbon source and fermentation type effects on continuous ABE fermentation. Table 2.1. represents the results of different continuous culture systems for butanol production using various carbon sources.
Table 2.1. Comparison of continuous butanol production using different carbon sources with free cells, cell
recycling, or immobilization
Fermentation Mode Carbon Source
Butanol Concentration
g.L-1
Butanol Productivity
g.L-1.h-1
Ref.
Free Cells Xylose 2.03 0.529 1
Free Cells Glucose 6.21 1.24 1
Free Cells Glucose+glycerol 8.6 0.42 1
Free Cells Starch 9.8a 0.2b 1
Free Cells Sago Starch 9.1a 0.85 2
Free Cells Degermed corn 14.28 a 0.3 2
Free Cells Satrch+Glucose 9.9 a 0.42 2
Cell Recycling Xylose 4.26 3.32 1
Cell Recycling Glucose 12.9 a 7.34 1
Cell Recycling Lactose 4.9 2.01 1
Cell Recycling Starch 15 a 3.3b 1
Cell Recycling Syntehetic Medium 8.8 a 11 2
Immobiliziation Glucose 7.19 a 13.66c 1
Immobiliziation Lactose 2.1 2.3 1
Immobiliziation Whey Permeate 8.6 a 0.36-1.1 2
Immobiliziation
Lactose+yeast
extact 1.43 a 0.78 2
Immobiliziation Corn 12.5 4.60 2
Immobiliziation Sweet potato slurry 7.73 a 1.00 2
Immobiliziation Starch 5.52 0.71 1
a ABE concentration
b ABE productivity
1 (Zheng et al., 2013)
2 (Kumar and Gayen, 2011)
8 Table 2.2: Commercialized pretreatment routes for corn-sugar cane, whey permeate and corn stover. (Meyer and
Papoutsakis, 1989; Tao and Aden, 2009)
Feed Stock Pretreatment Steps
1 2 3 4 5
Corn Milling Saccharification Dehydration
Corn Steeping De-germentation De-fiberation Enzyme
Hydrolysis
Sugar Cane Milling Boling Solid/Liquid
Separation
Whey
permeate Spray Drying
Corn Stover Steam & Acid Treatment Solid/Liquid Separation
Lime & Gypsium Treatment
Enzyme
Hydrolysis CO2 Removal
Investigations on simultaneous hydrolysis and fermentation with barley straw and wheat straw were performed. Elimination of separate pretreatment step can increase the economic value of ABE fermentation in two ways. First of all cheap feedstock will be available for commercial use and additional pretreatment equipment will not be necessary.
The lime treated barley straw resulted in successful batch fermentation with Clostridium beijerinckii 260 and ABE concentration of 26.64 g∙L-1 was achieved. Lime was used against inhibitors that released during hydrolysis. This was superior to both glucose and untreated barley straw (initial sugar 60 g∙L-1) fermentations (Qureshi et al., 2010). Same with barley straw experiments wheat straw run in simultaneous hydrolysis and fermentation with agitation by gas stripping mode resulted with productivity 0.31 g∙L-1∙h-1 and yield 0.41 (Qureshi, Saha, Hector, et al., 2008). When it has been concluded that simultaneous hydrolysis of wheat straw to achieve 100% hydrolysis to simple sugars and fermentation to butanol is possible. Another fed-batch fermentation performed for 533 hours. In addition to wheat straw, the reactor was fed with a sugar solution containing glucose, xylose, arabinose, galactose, and mannose. The culture utilized all of the above sugars. It was noticed that near the end of fermentation (286–533h), the culture had difficulties utilizing xylose. As a result of supplemental sugar feed to the reactor, increase of ABE productivity was observed by 16% with productivity of 0.36 g∙ L-1 ∙h-1 (Qureshi, Saha, and Cotta, 2008).
Low-grade glycerol has also been used to produce butanol in a chemostat culture of C. Acetobutylicum, resulting in the high yield and productivity of 0.34 mol.mol-1 and 0.42 g∙L-1∙h-1, respectively (Vasconcelos et al., 2004). Underneath these promising results usage of alternative feedstock for ABE fermentation getting closer to commercialize.
9
2.3. MICROORGANISM
Butanol (and acetone, ethanol, and isopropanol) can be naturally formed by a number of clostridia. In addition, clostridia can produce chiral products which are difficult to make by chemical synthesis and degrade a number of toxic chemicals (Lee et al., 2008b). Clostridia is rod-shaped, spore-forming gram-positive bacteria and typically strict anaerobes (Monot et al., 1982). Gram-positive bacteria, such as solventogenic clostridia, differ from gram-negative bacteria with respect to physiology, cell structure, and pathology in that they do not have an outer cell membrane and, consequently, lack a periplasmic space.
Solventogenic clostridia can utilize a large variety of substrates from monosaccharides including many pentoses and hexoses to polysaccharides (Jones and Woods, 1986). Complex nitrogen sources such as yeast extract are generally required for good growth and solvent production, but otherwise the nutrient requirements for the growth of clostridia are rather simple (Monot et al., 1982).
A great advantage of clostridial strains is that they can accept pentoses and hexoses. Wild type yeasts can normally only utilize hexoses leaving the pentoses from the hemicellulose unconverted. This is the most significant advantage of butanol in comparison with ethanol plants. To extract as much energy content as possible from the biomass during combustion, the transformation into fuels has to reduce the number of oxygen atoms per carbon. This is achieved in a disproportionation reaction, a balanced redox reaction, during the anaerobic metabolism of microorganisms. During the process CO2 is extracted from carbohydrates. Glucose (C6H12O6), a single sugar molecule, would for example be converted to two molecules CO2 and a molecule of butanol. C6H12O6→ C3H7COOH+2 CO2 +2 H2
2 C3H7COOH → C4H9OH + CH3COCH3+CO2
Butanol-producing Clostridia include a variety of species, including acetobutylicum,
saccharoacetobutylicum, beijerinckii, aurantibutyricum, pasteurianum, sporogenes, and
tetanomorphum. (Kumar and Gayen, 2011) Among these species, C. acetobutylicum, C. beijerinckii, C. saccharoacetobutylicum, and C. saccaroperbutylacetonicum are the primary producers with good butanol production and yields (Lee et al., 2008c).
10 and C. beijerinckii ATCC 55025, NCIMB 8052, and BA101 (Ennis et al., 1989; Qureshi and Blaschek, 2000; Zheng et al., 2009).
It is generally accepted that sporulation happens when solvents are produced and endospores function as a defence against the harsh environment, which however also results in unstable solvent production in ABE fermentation. A very distinctive feature of Clostridia is the biphasic fermentation. During the first phase, which is known as acidogenesis, acids (acetate and butyrate) and carbon dioxide are produced as the main products during the exponential growth phase, lowering the pH of the medium. Then, through a series of regulations, signals and change in gene expression, the second phase, which is known as the solventogenesis, is triggered and acids are reassimilated and converted to solvents (acetone, butanol and ethanol). The transition from acidogenic to solventogenic phase is the result of a dramatic change in gene expression pattern (Dürre, 1998). A typical ABE fermentation using C. acetobutylicum yields acetone, butanol and ethanol in the ratio of 3:6:1.
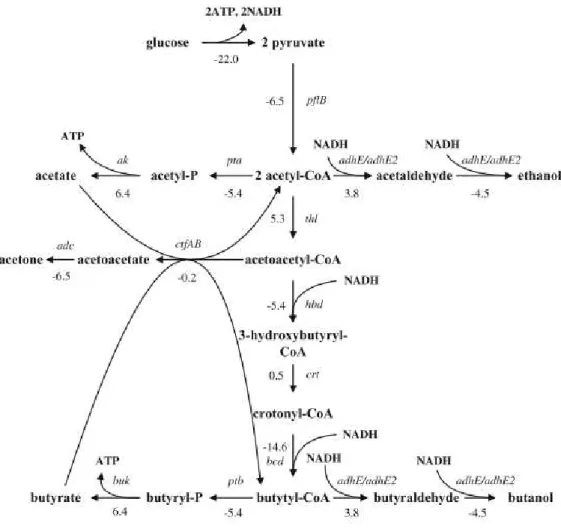
Figure 2.2. shows the metabolic pathway of C. acetobutylicum for ABE fermentation. As it can be seen from the figure clostridia requires high redox potential to produce butanol (and ethanol) and the supply of additional reducing power results in increased butanol and ethanol formation with reduced acetone formation. The formation of butyric acid during the acidogenic phase is important for maintenance of the redox equilibrium because nicotinamide adenine dinucleotides (NADHs) produced during glycolysis are only oxidized in the butyric acid formation pathway, not in the acetic acid formation pathway, resulting in the regeneration of NAD+. It seems that acetyl-CoA is mostly used to form butyryl-CoA, based on the fact that the conversion of acetyl-CoA to butyryl-CoA exhibits enhanced thermodynamic stability (Zheng et al., 2009). Butyryl phosphate appears to be important for butanol production. When the buk gene (which encode butyrate kinase) was inactivated, more butanol was produced (Lee et al., 2008b). It was reported that the initiation of butanol formation corresponded to the time when butyryl-P concentration reached its peak. It was suggested that the concentration of butyryl-P should be higher than 60 – 70 pmol∙gDCW-1 for butanol production (Zhao et al., 2005; Ezeji et al., 2010).
Groot and Luyben, 1987; studied glucose and xylose conversion kinetics with immobilized continuous fermentation. They concluded that xylose is only converted when glucose is completely consumed and the biocatalyst is not fully inhibited by butanol. Another study investigated the inhibition
of C. acetobutylicum metabolism of glucose and xylose by end products of fermentation and
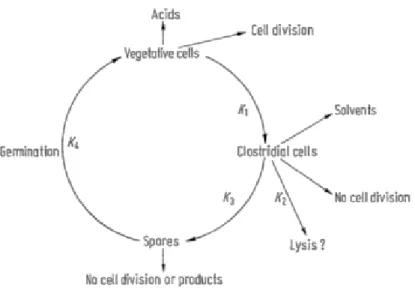
11 Meyer and Papoutsakis, (1989) investigated morphological forms and changes during the continuous fermentations. A schematic representation of this morphological cycle is given in Figure 2.3. The rate of conversion, or differentiation, of one morphological form to another is designated by a reaction rate K. These non-reversible changes occur as a result of complex interactive triggering mechanisms. For example, the morphological change from vegetative cells to clostridial cells at rate K1, involves the acid concentration, pH, and residual sugar and nitrogen concentrations.
Figure 2.2: Metabolic pathways of C. acetobutylicum. The numbers shown in the figure represent the standard
Gibbs energy changes ∆ of the corresponding reactions. The genes are shown in italics, and their
corresponding enzymes are as follows: pflB, pyruvate ferredoxin oxi- doreductase; thl, thiolase; hbd,
3-hydroxybutyryl-CoA dehydrogenase; crt, crotonase; bcd, butyryl-CoA dehydrogenase; pta, phosphotransa-
cetylase; ak, acetate kinase; ptb, phosphotransbutyrylase; buk, butyrate kinase; ctfAB,
acetoacetyl-CoA:acetate/butyrate:CoA transferase; adc, acetoacetate decarboxylase; adhE/adhE2, aldehyde/alcohol
dehydrogenase (Zheng et al., 2009).
12 of culture morphology must be maintained. If the biomass removal rate were maintained at a rate equal to the differentiation rate K1, (assuming no sporulation or cell lysis) then, theoretically, control over the solvent-producing clostridial population would be possible. Whether this remained stable would depend on the balancing of environmental conditions, e.g. avoidance of toxic product concentrations. In this situation however, vegetative cells could still accumulate and the differentiation rate K1 would be expected to change. Therefore, the maintenance of the growth rate ( ) and spore germination rate, K4, equal to the differentiation rate of vegetative cells to clostridial cells, K1, minus the clostridial cell lysis rate, Kz, and sporulation rate, K 3, (K4+ =K1-K2-K3) is a controlling index for stable solvent production.
Figure 2.3: A schematic diagram of the morphological changes observed during continuous fermentation by C.
acetobutylicum, P262, fermenting whey permeate medium. K1 designates the rate of conversion (or
differentiation) of vegetative cells to clostridial forms. K2 designates the rate of loss of clostridial forms due to
lysis. K3 designates the rate of sporulation of clostridial forms. K4 designates the rate of spore germination to
vegetative cells (Meyer and Papoutsakis, 1989)
Metabolic Engineering of cultures
We can list the objectives of metabolic engineering clostridia as it follows:
Enhanced butanol production with respect to the final concentration and productivity, Increased butanol (solvent) tolerance,
Extended substrate utilization range, Increased butanol yield on carbon source,
Selective production of butanol instead of mixed acids/solvents production.
13 Several examples of metabolic engineering of C. acetobutylicum have been reported over the years, mainly by the research groups of E. Terry Papoutsakis and George Bennett. The first successful metabolic engineering example was the amplification of the acetone formation pathway in C. acetobutylicum. This resulted in increased final concentrations of acetone, butanol, and ethanol by 95%, 37%, and 90%, respectively, compared to its parental strain (Mermelstein et al., 1993).
One of the earliest developed butanol-tolerant strain was a mutant of C. acetobutylicum ATCC 824 called initially as SA-1. This strain was developed using serial transfer, a procedure where samples of C. acetobutylicum culture at OD585 0.8 (or the highest attainable) are transferred into fresh media containing increasing concentrations of n-butanol. SA-1 had a 121% increase in tolerance over wild type when grown on 6% extruded corn broth (Lin and Blaschek, 1983). Similar experiments later led to strain SA-2, grown on brain heart infusion and P2 (minimal) medium. SA-2 had a 27% increase in butanol tolerance over wild type and was hypothesized to have adjusted its lipid membrane content in order to maintain a stable environment for cellular functions (Baer et al., 1987). In both SA-1 and SA-2, increased tolerance did not result in a greater overall butanol yield, suggesting that tolerance is not the only variable limiting butanol yield. A new method for strain development in C. acetobutylicum was introduced in 1994 by, Mermelstein et al., employing a plasmid vector system for introducing foreign DNA into ATCC 824 by electrotransformation. This genetic transfer technique has been the most widely used to investigate the effect of overexpressing or inactivating various genes on ABE tolerance in solventogenic clostridia (Ezeji et al., 2010).
As it is mentioned previously toxic effect of butanol limits the fermentation performance on first hand. The accepted dogma is that toxicity in the ABE fermentation is due to chaotropic effects of butanol on the cell membranes of the fermenting microorganisms, which poses a challenge for the biotechnological whole-cell bio-production of butanol. Development of solvent-tolerant strains to ameliorate solvent toxicity has typically followed one of two approaches: (1) enhancement of butanol toxicity defences in solventogenic clostridia and (2) metabolic engineering of well-characterized microorganisms (E. coli and S. cerevisiae) for ABE production (Kharkwal et al., 2009, Tomas et al., 2003).
A recently published international patent by DuPont describes the production of butanol in E. coli, Bacillus subtilis and S. cerevisiae. By overexpressing the thl, hbd, crt, bcd, ald and bdhAB genes of C. acetobutylicum involved in butanol biosynthesis, 0.8 mM, 0.19mM and 0.01mM butanol could be produced by engineered E. coli, B. subtilis and S. cerevisiae, respectively (Donaldson et al., 2007).
14 Ezeji et al. (2004) developed a hyper amylolytic C. beijerinckii, designated BA101. Although many butanol-producing microorganisms secrete starch-hydrolyzing enzymes, C. beijerinckii BA101 has an enhanced capability to utilize starch and accumulate higher concentrations of butanol (17–21 g∙L-1) in the fermentation medium. In addition to the use of corn, liquefied corn meal and corn steep liquor (a byproduct of corn wet milling process that contains nutrients leached out of corn during soaking) were tested for acetone–butanol production. In the batch process with recovery, 60 g∙L-1of liquefied corn meal and corn steep liquor yielded ca. 26 g∙L-1of solvent.
Attempts have been made to develop a C. acetobutylicum strain that can utilize cellulose directly. There is evidence that C. acetobutylicum ATCC 824 can produce a cellulosome, that is, a cellulose-degrading multienzyme complex consisting of several catalytic components surrounding a scaffold protein. C. acetobutylicum ATCC 824, however, has no cellulolytic activity suggesting that some element of the cellulosome is missing or not expressed. In an effort to make C. acetobutylicum utilize cellulose directly, the cellulase gene from C. cellulovorans or the gene encoding the scaffold protein from C. cellulolyticum and C. thermocellum were introduced into C. acetobutylicum. However up to now no sufficient results were obtained. More studies are needed to characterize the existing cellulase gene cluster in C. acetobutylicum before further metabolic engineering. (Lee et al., 2008b)
We have chosen two-step fermentation because of the advantageous biphasic behaviour of C.acetobutylicum. First reactor is kept in the conditions to support acidogenesis phase. Grown culture is fed to second solventogenic reactor where conditions are optimized for solvent production. This layout has several advantages, which will be discussed further. For all experiments C. acetobutylicum culture had been used.
2.4. FERMENTER CONFIGURATIONS
In this section, fermenter behaviours will be studied for three different modes of operation; batch, fed-batch and continuous mode.
Both physical and biological information are required for the design and estimation of reactor performances. Physical factors are generally effecting hydrodynamic environment of the bioreactor. Liquid flow patterns and circulation time, and intensity of mixing and the effects of shear can be listed as physical parameters. These factors generally depend on bioreactor geometry. Also some physicochemical parameters such as liquid viscosity and interfacial tension highly depended on agitator speed, effect of baffles. Agitator properties also have a significant effect on gas bubble size and a relatively effecting both liquid and gas phase hydrodynamics. The biokinetic input involves such factors as cell growth rate, cell productivity and substrate uptake rate.
15
Rate of accumulation:
This term express the derivation of mass in the system boundaries according to one species. If we consider the total mass balance derivative term will be equal to zero. But as in the generative fermentation, the behaviour of single specie aqueous solutions mass can be written in terms of concentration- and volume- .
∙ 1
Since volume change during fermentation can be negligible, accumulation of component during time can be written as it follows:
∙ 2
Convective flow terms
Total mass flows - Q ( ∙ ) into and out of the system are given as volumetric flow - ∙ multiplied by density – ( ∙ . On the other hand, when component balance is being created, component flows must be expressed. Instead of density, concentration - with respect to mass ∙ can be used to express component mass flow over/in the system. Concentration can be also be expressed by mass fraction – i in case of total mass flow. is a dimensionless number that shows the ratio of component over total species and can be formulate as;
3
We can conclude that, for component balance two starting point can be created; 4
16 Production rate
This term in the balance equation represents the production or consumption of component by reaction in the system boundaries. is defined as rate of production of the component for per reaction volume – ∙ ∙ . The product formation for single component can be defined as;
∙ 5
is positive with the case of generation and counted as negative for consumption. The term is valid for single component balance, hence if we want to observe the overall change in the system we have to consider overall production rate. Since a chemostat is being subject to modeling, for example for substrate balance, S ∙ , two main consumptions should be taken into account: Cell growth and component production. The relationship between , and can be expressed as a constant yield coefficients, yield coefficient for product formation on substrate / , yield coefficient for biomass formation on substrate / and yield coefficient for product formation ( / . ∙ ∙ indicates positive values of biomass production in the system, meanwhile ∙ ∙ stands for product formation rate. In chemostats, yield can be defined as the amount of product that was obtained during fermentation. Since there is component accumulation through the reaction yield value should indicate positive values. Correlations for biomass/substrate and product/substrate can be expressed as it follows.
/ 6
/ 7
/ 8
Since is depended value with 2 different variables, should be written in terms of and . If the equations 6 to 8 rearranged two different expression of can be obtained.
/ / /
/ 9,10
Now we can define the equation for the profile of S as; S
/ / ∙ S
17
2.4.1.
Batch
–
Fed
Batch
Fermentation
Batch reactors are the most common reactor type in industry. The reliability is highly favored by industry, and therefore has sometimes preference over fed-batch and continuous processes. The general procedure for batch production: the bioreactor is first charged with medium, inoculated with cells, and the cells are allowed to grow for a sufficient time, such that the cells achieve the required cell density or optimum product concentrations.
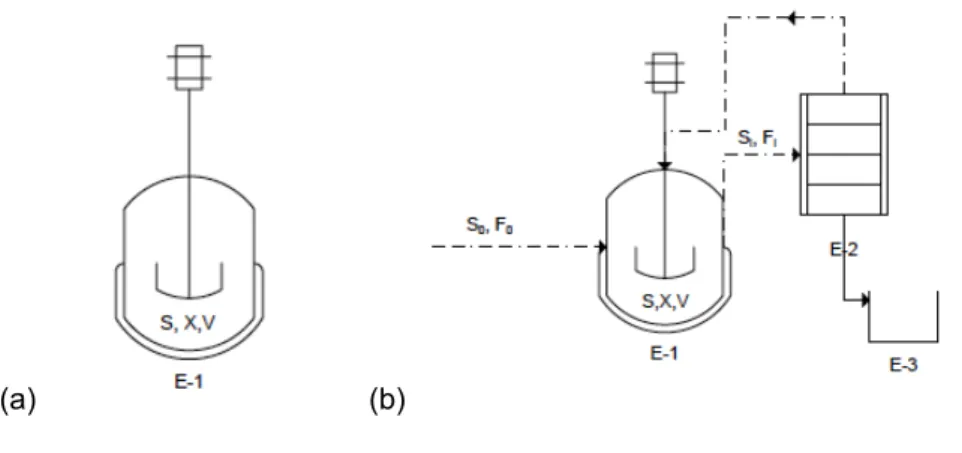
(a) (b)
Figure 2.4: (a) Simplified batch reactor. E-1: autoclaved fermenter (b) Simplified fed-batch reactor E-2 recovery
unit (optional), E-3 product collection tank
Figure 2.4-a shows a simplified batch reactor. Since there is no flow in or out of the bioreactor, during normal operation, the biomass and substrate balances both take the form,
S
∙ 13
The highest butanol concentration achieved in batch fermentation with MP2 medium and 0.60 M sodium acetate and 8% glucose, C. beijerinckii BA101 produced 20.9 g∙L-1 butanol (32.6 g∙L-1 total solvents). MP2 is chemically defined medium has following components per liter. 0.2 g MgSO4∙7H2O, 0.01g MnSO4 H2O, 0.01g FeSO4, 0.01g NaCl, 1.0 g PABA, 0.01g Biotin, 0.1 g thiamin, 0.5 g KH2PO4, 0.5 g K2HPO4, 2.0 g (NH4)2SO4 and various amounts of CH3COONa. In all batch cultures glucose conversion was limited below about 80 g ∙ L-1 due to accumulation of butanol in the broth and also substrate inhibition. In a batch fermentation and exceeds the threshold concentration of 22∓28 g∙L-1 that is estimated to be required for the ABE fermentation to become economically competitive once again. (Chen and Blaschek, 1999)
In the figure 2.4-b a simple batch layout can be seen. The important characteristics of fed-batch operation are therefore as follows:
18 2. Possibility of operating with separate conditions for growth and production phases.
3. Control possibilities on feeding policies.
4. Development of high biomass and product concentration.
For a case study, parallel batch and fed-batch fermentations were carried under same initial conditions. Sugar supply and online product recovery; oleyl alcohol extraction applied to fed batch system with defined time sequences. At the end of fermentation, the organic phase contained over 30 g∙L-1 butanol and 5 g∙L-1 acetone. This is over twice the concentration of butanol that can be obtained in conventional batch fermentation (Roffler et al., 1987). This translates into not just increased sugar conversion but also reduced wastewater and maintenance costs.
Volume change due to sugar addition or solvent removal in fed batch fermenters can be expressed as;
θ 14
with being the initial broth volume, F(t) the volumetric flowrate of feed into the fermenter, θ the effective fraction of water in the feed, the volume of the i-th aqueous phase sample, and n being the number of samples taken up to time t. The effective fraction of water in the feed is the sum of the water actually in the feed and the amount of water produced from the fermentation of the glucose contained in the feed.
2.4.2.
Continuous
Fermentation
and
Cell
Recycling
Figure 2.5: Simplified continuous reactor. E-1: autoclaved fermenter, E-2: recovery unit, E-3: product collection
19 Continuous operation (Figure 2.5.) is the third option and has several advantages over batch and fed-batch operations, including minimizing equipment downtime and time loss due to the lag phase of the microbial culture. Also, the dilution effect during the addition of the substrate solution may also solve the problem of catabolite toxicity. Dilution rate D, h‐1 is defined as the ratio of the volumetric feed rate of medium (F, L∙h-1) to the volume of fermentation culture solution (V, L).
15
The hydraulic retention time (HRT), residence time , is a measure of the average length of time that a soluble compound remains in a constructed bioreactor. It can also be defined as the inverse of dilution rate.
1
16
Another necessary data to discuss about feasibility of reactors is productivity. We can define overall productivity as; rate of product per time per volume.
g ∙ ∙ 17
The rate of accumulation equals to zero for steady state continuous reactors. The composition inside the reactor assumed constant from beginning of reaction until the end. For sugar consumption, , we can rearrange the equation with respect to initial and final sugar concentration, , and dilution rates.
18
Productivity of ABE fermentation has been subject to development via continuous culture usage. Increased productivity affects the capital costs in first hand. Butanol production, however, can degrade over time when Clostridium acetobutylicum is grown in continuous culture. Studies have therefore been carried out, in which the concentrations of glucose, phosphate, nitrogen, sulphate, or other nutrients have been purposely limited to prevent decreasing butanol yields in continuous culture. (Roffler et al., 1987)
High concentrations of butanol are desirable, because product recovery costs are strongly dependent on butanol concentration in the product stream. High concentrations of butanol can be produced in continuous culture, but the productivity of the fermentation is highly reduced. For continuous culture, a high butanol concentration continuously limits productivity.
20 possible in a single stage system (Gapes, 2000) . When a two-stage continuous process is used the inhibitory effect of butanol can be decreased. The acidogenic and solventogenic phases are separated in two consecutive fermenters (Bahl et al., 1982; Afschar and Schaller, 1991). The first stage is then maintained at a relatively high dilution rate (D1) and the second at a low one. Only the bacteria in the second stage are exposed to high levels of butanol and there is a continuous supply of non- inhibited cells from the first fermenter. (Godin and Engasser, 1990)
The main problems with continuous operation that must be dealt with is that while a higher process flow rate typically results in higher reactor productivities, it also leads to lower substrate conversion and lower product concentrations. And also most production systems exhibited a very low volumetric ABE productivity due to low cell concentration; it has generally been observed that the cell concentration in anaerobic cultures is lower than that in aerobic cultures. Biomass recycle appears to be one possible means of overcoming this problem. By promoting a higher biomass concentration, cell recycle reactors may achieve high product concentrations and substrate conversion, even at high throughput rates (Meyer and Papoutsakis, 1989; Tashiro et al., 2005).
High cell density can be obtained via adsorption, entrapment, covalent bond formation and membrane filtration. For first three cases, the culture may experience substrate, nutrient, and product diffusion limitations. In substrate diffusion limitations, the culture may not get carbon source for its energy needs thus resulting in death of the innermost cell layers due to starvation or formation of spores. This will reduce the amount of active cells that take part in the reaction. Due to reduced amount of cells will lead to reduced reactor productivities. At the same time, product diffusion limitation may not allow diffusion of toxic products from the cell surroundings thus affecting cell viability.(Nasib Qureshi & Thaddeus Ezeji 2008) Compared with bioreactors that use cell-immobilizing, bioreactors with cell-recycling are advantageous due to the homogeneity of the broth that facilitates diffusion in the bioreactor as well as the total recycling of microorganisms (Ferras et al., 1986). Table 2.3 shows the fermentation performances of ABE production in bioreactors coupled with membrane cell recycle systems.
Tashiro et al. (2005) could obtain a high cell density by concentrating the solventogenic cells of the broth 10 times. Hollow fiber ultra-filtration modules were used for recycling. 20 g.L−1 of active cells were obtained after only 12 h of cultivation and after 200 h continuous operation the overall volumetric ABE productivity was 7.55 g∙L−1∙h−1. Maximum cell concentration increased gradually through cultivation to an average final value greater than 100 g∙L−1.
21 Pierrot et al. (1986) used hollow-fiber ultrafiltration to separate and recycle cells in a continuous fermentation of C. acetobutylicum. Under partial cell recycling with and at a dilution rate of 0.5 hr-1, active cellular concentration of 20 g∙L-1 and a solvent productivity of 6.5 g∙L-1∙h-1 is maintained for several days at a total solvent concentration of 13 g∙L-1. With partial cell recycling, it is the bleed dilution rate which at steady-state equals the specific growth rate. Thus the growth of cells in the recycling fermenter is simply controlled through the bleed flow rate. The total dilution rate, on the other hand, mainly determines the extent of substrate conversion in the continuous fermenter.
Ennis et al. (1989) was investigated for the production of ABE from whey permeate using Clostridium acetobutylicum P262. Reported overall productivity was 1.32 g∙L-1∙h-1 with overall dilution rate 0.3 h-1.
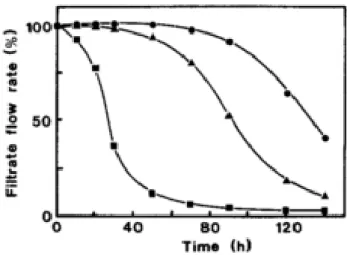
Schlote & Gottschalk (1986) performed phosphate imitated runs (1.34 g∙L-1) and with dilution rate of D=0.10h -1 overall productivity reported as 1.41 g∙L-1∙h-1. Three kinds of membrane performances and biomass-membrane interactions were reported for recycling Clostridium. A cellulose-triacetate ultrafiltration membrane with a cut-off volume of 20000 MW was found to work best. The decrease of the flow rate of the filtrate with time is depicted in Figure 2.6. It can be seen that the polysulfone filter with a cut-off volume of 100000 MW was clogged by 50% already after 24 h, since the cellulose acetate filter was clogged by 50% after 90 h.
Figure 2.6: Decrease of the filtrate flow rate of different filter membranes with time. Suspensions of inactive cells
of C. aecetobutylicum were used. Overflow rate, approximately 101/h. Cellulose-acetate filter membrane,
pore-diameter 0.2 m, ; polysulfone ultrafilter, cut-of volume 100000 MW,∎ ; cellulose-triacetate ultrafilter, cut-off
volume 20000 MW, • (Schlote and Gottschalk, 1986)
22 Ferras et al. (1986) investigated ceramic membrane usage for cell recycle as sterilization process of ceramic membranes are easier than polymeric membranes. The device developed was sterilizable by steam and permitted drastic cleaning of the ultrafiltration ceramic membrane without interrupting the continuous fermentation. It has been shown to be an easily operated and reliable experimental tool for studying high-cell-density cultures and inhibition phenomena. With total recycle of biomass, a dry weight concentration of 125 g∙L-1 was attained, which greatly enhanced the volumetric solvent productivity of fermentation in averaging 4.5 g∙L-1∙h-1 for significant periods of time (>70 h) and maintaining solvent concentration and yield at acceptable levels.
Xylose conversion has been studied by J. Zheng et al. (2013). A continuous acetone– butanol–ethanol (ABE) production system with high cell density obtained by cell-recycling of C. saccharoperbutylacetonicum N1-4. To obtain a high cell density at a faster rate, the solventogenic cells of the broth were concentrated 10 times by membrane filtration and were able to obtain approximately 20 g∙L-1 of active cells after only 12 h of cultivation. Cell concentration increased gradually through cultivation and the highest concentration was reported as 100 g∙L-1. The maximum butanol productivity of 3.32 g∙L-1∙h-1 was obtained at a dilution rate of 0.78 h-1.
The potential advantages associated with the use of membrane bioreactors are: productive cells are returned to the fermenter for re-use; greater biomass concentrations are achievable due to the availability of fresh nutrients in the feed medium, facilitating improved volumetric productivities; and inhibitory products can be removed from the cell- free filtrate stream, possibly more easily than when cells are present, prior to its return (partial) to the fermenter, giving rise to even greater productivities.
23 Table 2.3: A brief summary of ABE production in bioreactors coupled with membrane cell recycle systems
Reference Unit Ferras et al. (1986) Afschar et al. (1985)
Configuration SingleUF module
Parallel 2 UF module
Series 2 UF
module MF module
Fermentation Single Stage Single Stage
Bleed1 h-1 N/A N/A
D ov h-1 0.33 <0.33 not stable value 0.4
pH 1 5.4 4.4
T1 oC 35 37
Operation period h 504 288 528 N/A
ABE Concentration gL-1 20.5-9.3 N/A N/A 7
A gL-1 N/A N/A N/A N/A
B gL-1 5.9-12.4 N/A N/A N/A
E gL-1 N/A N/A N/A N/A
Productivity 1 g L-1h-1 1.3 3.5 4.5 N/A
Productivity2 g L-1h-1 N/A N/A N/A N/A
Productivityoverall g L-1h-1 N/A N/A N/A 4.5
Cinitial gL-1 70 60
Cresidual sugar
gL-1 5-60a N/A N/A N/A
Organism
Clostridium acetobutylicum (ATCC 824)
Clostridium acetobutylicum ATCC 824 (DSM
792)
Manufacturer Carbosep M1 SFEC, Bollene, France (ENKA, Wuppertal)
Membrane Material mineral polypropylene
Avarege Pore size µm N/A N/A
Mw cut-off Dalton N/A N/A
Crosflow velocity Lh-1 0.97-2.27 N/A
∆P across membrane kPa N/A N/A
V1 L 3.45 2
Feed Type Glucose Glucose
DCW gL-1 125 N/A N/A
Cell Density gL-1 14 17 50 8
a: data is provided from table b: butanol productivity c: culture vessel
24 Table 2.3 (continued): A brief summary of ABE production in bioreactors coupled with membrane cell recycle
systems
Reference Unit Schlote et al. (1986) Ennis et al. (1989)
Configuration UF module MF module
Fermentation Stage Single Stage Single Stage
Bleed1 h-1 N/A 0.018
D ov h-1 0.1 0.4 0.24 0.3
pH 1 4.4 5.4-5.6
T1 oC 37 34 33
Operation period h N/A 80 215
ABE Concentration gL-1 22.02 N/A 9.3 4.6
A gL-1 6.75 N/A N/A
B gL-1 14.08 N/A 6
E gL-1 1.19 N/A N/A
Productivity 1 g L-1h-1 1.41b 4.1b 1.02b
Productivity2 g L-1h-1 N/A N/A N/A
Productivityoverall g L-1h-1 N/A N/A N/A 1.32
Cinitial gL-1 60-90 N/A
Cresidual sugar
gL-1 N/A N/A N/A
Organism
Clostridium aeetobutylicum DSM 1731
Clostridium aeetobutylicum P262
Manufacturer
Sartorius GmbH, Göttingen, FRG
Norton Company (Worcester, Massachusetts, USA)
Membrane Material cellulose- triacetate Ceramic / S. Alumina
Avarege Pore size µm N/A 45
Mw cut-off Dalton 20000 N/A
Crosflow velocity Lh-1 N/A 0.75d
∆P across membrane kPa N/A 14-17
V1 L 0.3-0.7 1.2
Feed Type Glucose Lactose
DCW gL-1 13.1 23.3
Cell Density gL-1 N/A 12.5 19.5
a: data is provided from table b: butanol productivity c: culture vessel
25 Table 2.3 (continued): A brief summary of ABE production in bioreactors coupled with membrane cell recycle
systems
Reference Unit Pierrot (1986) Tashiro et al. (2005)
Configuration Hollowfiber Filtration Hollowfiber Filtration
Fermentation Stage Single Stage Single Stage
Bleed1 h-1 0.027 0.065 N/A 0.09 0.11-0.16
D ov h-1 0.3 0.565 0.85 0.76 0.71-0.74
pH 1 4.8 6.5
T1 oC N/A 30
Operation period h 150 150 48 60 207
ABE Concentration gL-1 16.00 13 12.9 11.5 8.58
A gL-1 6.40 N/A N/A
B gL-1 8.53 N/A N/A
E gL-1 1.07 N/A N/A
Productivity 1 g L-1h-1 4.5 6.5 N/A
Productivity2 g L-1h-1 N/A N/A N/A
Productivityoverall g L-1h-1 4.5 6.5 11 9.77 7.55
Cinitial gL-1 45
Cresidual sugar
gL-1 ≈0 less than 20
Organism
Clostridium aeetobutylicum ATCC 824
Clostridium saccharoperbutylacetonicum N1-4 ATCC 1356N1-4
Manufacturer Amicon hollow-fiber module
(HIPIO0 20)
MICROZA PSP-102, Asahi Kasei Co. Ltd., Tokyo, Japan
Membrane Material N/A Organic Polymer
Avarege Pore size µm N/A 25
Mw cut-off Dalton 100000 N/A
Crosflow velocity Lh-1 0.405 N/A
∆P across membrane kPa 41.4 N/A
V1 L 2 0.4
Feed Type Glucose Glucose
DCW gL-1 N/A N/A 33.1 17.2-13.6
Cell Density gL-1 20 N/A N/A 106
a data is provided from table b butanol productivity c culture vessel
26 Table 2.4 (continued): A brief summary of ABE production in bioreactors coupled with membrane cell recycle
systems
Reference Unit Meyer et al. (1989)
Configuration UF module
Fermentation Stage Single S. /non glucose limited Single S. / glucose
limited
Bleed1 h-1 N/A N/A N/A N/A N/A
D ov h-1 0.43 0.3 0.2 0.23 0.2
pH 1 4.5 4.8 4.5
T1 oC 35
Operation period h
not mentioned but there is a cleaning break for fouling every 6 h
ABE Concentration gL-1 10.13 8.92 14.39 20.04 6.18
A gL-1 2.17 0.69 2.26 4.93 0.22
B gL-1 5.23 3.57 6.94 12.30 0.82
E gL-1 0.33 0.22 0.52 0.99 0.08
Productivity 1 g L-1h-1 N/A N/A N/A N/A N/A
Productivity2 g L-1h-1 N/A N/A N/A N/A N/A
Productivityoverall g L-1h-1 N/A N/A N/A N/A N/A
Cinitial gL-1 41.4 73.26 59.4 13.5
Cresidual sugar
gL-1 10.098 53.82 38.7 41.22 0.0126
Organism
Clostridium acetobutylicum ATCC 824
Manufacturer CECI Column
Eluate Concentrator Amicon, Danvers, MA, USA
Membrane Material
Avarege Pore size µm N/A
Mw cut-off Dalton 100000
Crosflow velocity Lh-1 0.6-1.2
∆P across membrane kPa N/A
V1 L 0.7
Feed Type Glucose
DCW gL-1 N/A
Cell Density gL-1 N/A
a data is provided from table b butanol productivity c culture vessel
27 Table 2.4 (continued): A brief summary of ABE production in bioreactors coupled with membrane cell recycle
systems
Reference Unit Zheng et al. (2013)
Configuration Hollowfiber Filtration
Fermentation Stage Single Stage
Bleed1 h-1 N/A
D ov h-1 0.78
pH 1 > 5.6
T1 oC 30
Operation period h > 110
ABE Concentration gL-1 5.89
A gL-1 N/A
B gL-1 4.26
E gL-1 N/A
Productivity 1 g L-1h-1 3.32b
Productivity2 g L-1h-1 N/A
Productivityoverall g L-1h-1 N/A
Cinitial gL-1 50
Cresidual sugar
gL-1 28
Organism
Clostridium
saccharoperbutylacetonicum N1-4 ATCC 13564
Manufacturer MICROZA PMP-102; Asahi Kasei,
Tokyo, Japan
Membrane Material Organic Polymer
Avarege Pore size µm 25
Mw cut-off Dalton N/A
Crosflow velocity Lh-1 N/A
∆P across membrane kPa N/A
V1 L 0.4
Feed Type Xylose
DCW gL-1 17.4
Cell Density gL-1 N/A
a data is provided from table b butanol productivity c culture vessel
28
2.5. ONLINE PRODUCT RECOVERY
The lipophilic solvent butanol is more toxic than others as it disrupts the phospholipid components of the cell membrane causing an increase in membrane fluidity. Increased membrane fluidity causes destabilization of the membrane and disruption of membrane-associated functions such as various transport processes, glucose uptake, and membrane-bound ATPase activity (Bowles and Ellefson, 1985).
Gas stripping is a simple but efficient way to recover butanol from the fermentation broth (Figure 2.7a). The production of ABE is associated with generation of H2O and CO2. The fermentation gas is bubbled through the fermentation broth then passed through a condenser for solvent recovery. The stripped gas is then recycled back to the fermenter and the process continues until all the sugar in the fermenter is utilized. Gas stripping enables the use of a concentrated sugar solution in the fermenter (Qureshi and Blaschek, 2001d) and a reduction in butanol inhibition and high sugar utilization (Maddox et al., 1995).
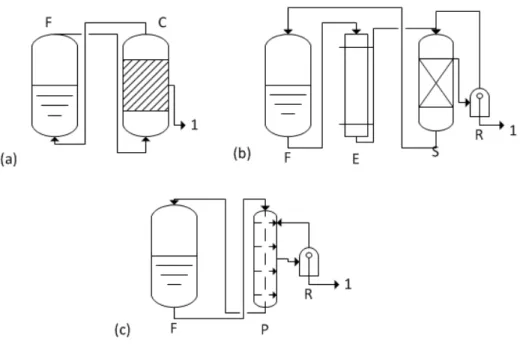
29 Figure 2.7: Removal Techniques (a) Gas Stripping (b) Liquid-Liquid Extraction (c) Perstraction F: Fermenter,
C:Condenser, E:Extractor, S:Seperator, R:Extractant Recovery, P: Membrane Contactor Unit for Perstraction, 1:
Product line (composition: water and ABE)
Qureshi et al. (1992); studied different product removal techniques that had been integrated into the identical fermentation process. The techniques that were investigate; liquid-liquid extraction, perstraction, gas-stripping, and pervaporation. Whey permeate was used as a substrate and Clostridium acetobutylicum P262 was used for all fermentations. The performance results are represented on Table 2.4.
Table 2.4: Total ABE and Acids Produced and ABE Productivity during Integrated Fermentation/Product Removal
Experiments
Total ABE Total Acid Productivity
Total Lactose
used Yield
g g g.L-.1 h-1 g g.g-1
Control Batch 7a 0,6b 0.07 45,1c 0.32
Liq-Liq Extraction 28 1.51 0.15 68.6 0.35
Perstraction 57.8 2.1 0.24 157.5 0.37
Gas Stripping 69.1 0.7 0.26 182.5 0.38
Pervaporation 42 9.9 0.14 123.4 0.34