https://doi.org/10.1007/s10230-020-00719-1 TECHNICAL ARTICLE
Feasibility of Co‑Treating Olive Mill Wastewater and Acid Mine
Drainage
Jorge Dias Carlier1 · Ana Teresa Luís1,3 · Luís Miguel Alexandre1 · Maria Clara Costa1,2
Received: 5 February 2020 / Accepted: 17 September 2020 © The Author(s) 2020
Abstract
Previous tests using a growth medium and olive mill wastewater (OMWW) have shown that it supplies carbon and electron donors suitable for sulphate reducing bacteria (SRB). We assessed the co-treatment of acid mine drainage (AMD) and OMWW using SRB-enriched bioreactors and identified the most abundant bacterial populations present under optimized conditions. The process requires a neutralizing agent to create optimal pH conditions for successful removal of the AMD’s main contaminants. Concentrations of SO42−, Al, Fe, Cu, Zn, and Mn decreased to below Portugal’s maximum admissible
values for irrigation waters, and all but Mn were reduced to less than Portugal’s emission limit values (ELVs) for wastewater discharges. Phenol concentrations—the main pollutants in OMWW—dropped to values between 1/10 and 1/5 their initial concentrations in batch tests using mixtures of AMD and OMWW, and to 1/2 their initial concentrations in flow-through tests. The final total phenol concentrations were still above the ELV for wastewater discharges, but phenols are not regulated in irrigation waters, and OMWW is used by some producers to irrigate soils. Six main SRB groups were identified as likely having a fundamental role in the bioremediation process: the genera Desulfovibrio, Sulfurospirillum, and Acetobacter and the families Sphingomonadaceae, Prevotellaceae, and Deferribacteraceae.
Keywords Bioremediation · Anaerobic bioreactor · Sulphate reducing bacteria · Acid rock drainage · Olive oil by-products
Introduction
Acid mine drainage (AMD), also known as acid rock drain-age, can contain high concentrations of sulphate, metals, and metalloids that can contaminate groundwater and water-courses and damage the health of aquatic species, plants, wildlife, and humans (Johnson 2003; Simate and Ndlovu
2014). The main cause of AMD is the oxidation of sulphide minerals (mainly pyrite) due to their exposure to oxygen, water, and microorganisms. It may occur naturally but is accelerated by mining activities that increase the exposure of Fe sulphide minerals to such conditions (Egiebor and Oni 2007; Johnson 2003; Johnson and Hallberg 2005).
AMD treatment approaches can be divided into those that rely on biological activities (biotic) and those that do not (abiotic), and can be classified into three broad categories— active, passive, and semi-passive treatment. Active treatment requires significant ongoing costs for operation, including labour, chemicals, and electricity, and are thus generally more appropriate for use at operating mines or for high flow rates, while passive and semi-passive treatment are more cost-effective solutions for inactive or abandoned mines sites where the remote location or other factors require the use of low-maintenance, low-cost treatment options (Johnson and Hallberg 2005; Simate and Ndlovu 2014; Skousen et al. 2017). Passive systems can operate for a long time (typically at least a decade) without any supplemental chemicals or energy, while semi-passive systems require a low dose of Electronic supplementary material The online version of this
article (https ://doi.org/10.1007/s1023 0-020-00719 -1) contains supplementary material, which is available to authorized users. * Maria Clara Costa
1 Centre of Marine Sciences (CCMAR), University of Algarve, Gambelas Campus, bldg 7, 8005-139 Faro, Portugal
2 Faculty of Sciences and Technology, University of Algarve, Gambelas Campus, bldg 8, 8005-139 Faro, Portugal 3 Present Address: Department of Geosciences, GeoBioTec,
Geobiosciences, Geotechnologies and Geoengineering Research Center, University of Aveiro, Campus de Santiago, 3810-193 Aveiro, Portugal
chemicals or nutrients, but without the need of continuous labour and power.
Abiotic passive treatment methods include geochemical systems such as open limestone channels, limestone leach beds, limestone sand, anoxic limestone drains, diversion wells, steel slag leach beds, and low-pH Fe oxidation chan-nels (Kefeni et al. 2017; Kleinmann et al. 1998; Skousen et al. 2017; Valls and de Lorenzo 2002). Biological treat-ment methods have been viewed with considerable interest because metals from AMD are removed in natural wetland ecosystems. Since natural treatment of AMD was found in Sphagnum moss dominated bogs, the early systems were attempts to simulate such systems (e.g. Kleinmann et al. 1983). However, they were effective only for sites with relatively low metal loads and at most sites, the moss rap-idly died (Gazea et al. 1996). Despite this, the research on using wetlands continued and eventually a wetland design evolved that proved tolerant to AMD and effective at reduc-ing the levels of dissolved metals (Kleinmann and Hedin 1993). Most of these passive biological AMD treatment systems consist of a series of constructed ponds amended with organic substrates and planted with cattails, sedges, and rushes to resemble natural wetlands (e.g. Girts et al. 1987). In such systems, Mn- and Fe-oxidizing microbes precipitate these metals as oxides and contribute to the coprecipitation of other metals and metal hydroxides (Gazea et al. 1996). This works well for most coal mine drainage, but metal mines typically require the activity of sulphate reducing bac-teria (SRB), which reduce sulphate to sulphide and forms metal sulphide precipitates (Cohen 2006). SRB require strict anaerobic environments with a pH in the range of 5–8, and if the pH and/or redox conditions are not ideal, microbial sulphate reduction declines and metal removal capacity is impaired (e.g. Brown et al. 1973). Over time, improved biological remediation techniques were developed using a variety of constructed compost and sulfidogenic bioreactors, in combination with abiotic methods such as the addition of limestone or other alkaline materials (Boonstra et al. 1999; Johnson and Hallberg 2005; Maree and Hill 1987; Skousen et al. 2017). Aerobic wetlands, packed-bed Fe oxidation bioreactors, and compost bioreactors are considered passive biological systems, while off-line sulfidogenic bioreactors are considered active biological systems (Johnson and Hall-berg 2005; Simate and Ndlovu 2014; Skousen et al. 2017).
There are also many examples of semi-passive systems where the AMD is at least partially treated by more acid-tol-erant SRB and by either a continual or flow-regulated addi-tion of suitable liquid organic wastes rich in carbon sources and/or electron donors (e.g. lactate, ethanol, sucrose; URS 2003).
In passive biotic systems, the most efficient organic mate-rials are mixtures of substrates that contain easily biodegrad-able compounds (soluble sugars, starch, and proteins) and
promote the rapid establishment of microbial populations with SRB communities. Solid, less-labile substrates (with cellulose, hemicelluloses, and lignin) will also promote long-term SRB activity based on the use of products gener-ated from their slow degradation. In contrast, in active and semi-passive biotic systems, where rapid treatment of large amounts of water is needed, the use of pure or easily degra-dable nutrient sources is typically more appropriate (Necu-lita et al. 2007; Sheoran et al. 2010; Skousen et al. 2017).
In the olive oil industry, both the traditional press extrac-tion method and the continuous three-phase decanter process generate three products: olive oil (~ 20%) and two streams of waste: the solid crude olive cake or olive husk (≈30%) and the aqueous olive mill wastewater (OMWW) or olive mill effluent (≈50%) (Tsagaraki et al. 2007). Approximately 3.1 × 10⁶ t of olive oil are produced annually worldwide,
with more than 95% of it produced in the Mediterranean region (FAOSTAT 2014). With an average of 0.2 t of olive oil extracted per t of processed olives and an average of 1.2 m3 OMWW produced per t of milled olives (Amaral 2009;
Jeguirim et al. 2017), the estimated annual worldwide pro-duction of OMWW is 18.6 × 10⁶ m3. OMWW has a high
chemical oxygen demand (COD) due to a considerable con-tent of sugars and its high phosphorus concon-tent, which can be easily treated by biological processes. However, recalci-trant phenolic compounds present in OMWW impart toxic characteristics to this effluent (Capasso et al. 1995; Niaou-nakis and Halvadakis 2006; Sayadi et al. 2000). The most common phenols in OMWW are polyphenols of different molecular mass; the list of specific phenols in OMWW is complex and variable, depending on several factors (e.g. climatic conditions and storage time of olives) (Obied et al. 2005). The discharge of raw OMWW into lakes and rivers is forbidden in all European Union countries due to its harm-ful effects on the ecological balance. Therefore, ponds are usually constructed to promote evaporation during summer, but they can cause a severe odour nuisance (Koutsos et al. 2018). In addition, in many cases, when the ponds are full, they can no longer accept OMWW, and olive oil produc-tion must cease (Renato Rocha, owner of a small/medium olive oil mill, personal communication, Nov. 2016). Due to the financial effects of this on producers, illegal disposal of untreated OMWW into aquatic resources has been observed (e.g. Elhag et al. 2017).
Recently, OMWW was successfully tested as a source of carbon and electron donors for SRB in a growth medium lacking any other organic compound, opening the way for further studies to evaluate the use of this waste in SRB-based processes to treat AMD (Carlier et al. 2019). The purpose of this study was to test a process for AMD treat-ment that combines an abiotic passive step using alka-line materials with a semi-passive biotic step. The biotic step was comprised of an SRB-based bioreactor that uses
OMWW as a source of carbon and electron donors. The potential of the process to co-treat both wastewaters was evaluated. In addition, the taxonomic composition of bac-terial communities at the end of the batch tests and in the optimized continuous bioreactor was analysed with the goal of identifying the major bacterial groups that are important to the process.
Materials and Methods
Source of AMD
The AMD used in this work was collected at the São Domingos Mine (37° 40′06.7″ N 7° 29′28.5″ W), in south-east Portugal, near the Spanish border. The mine is located in the Iberian pyrite belt (IPB), which extends along the southern region of Portugal to Rio Tinto in Spain and is considered one of the largest metallogenetic provinces of volcanogenic massive sulphide deposits in the world (Alvarenga et al. 2012; Álvarez-Valero et al. 2008). The São Domingos Mine was exploited during the Roman and Islamic occupations of the Iberian Peninsula and was the largest mine operating in Europe between 1857 and 1966; massive pyrite was the main mineral ore exploited, and copper and sulphur were the main elements extracted (Tavares 2008). The mine has been abandoned since the 1960s, leading to serious environmental deterioration of the area. The Portuguese public company Empresa de Desenvolvimento Mineiro (EDM, S.A.) is responsible for the environmental rehabilitation of the mining area. How-ever, as of 2013 most of the work has not been completed (Dias-Sardinha et al. 2013), and it remains incomplete. In the mine area, there is a deep open pit, old mining struc-tures in a high level of decay, ruins of industrial buildings, and tons of mining generating AMD contaminated with sulphate and metals (mainly Al, Fe, Cu, Zn, and Mn) that flows through characteristic reddish-yellow diverting chan-nels with several dams (Pereira et al. 2004). These chan-nels discharge to the Mosteirão stream, which then enters into the Chança River, a major tributary of the Guadiana River. The AMD from São Domingos is highly acidic (≈ pH 2) and has the following approximate constituent concentration ranges: sulphate (1000–5000 mg/L), Al (100–500 mg/L), Fe (50–500 mg/L), Zn (20–150 mg/L), Cu (20–100 mg/L), and Mn (5–20 mg/L) (e.g. Costa and Duarte 2005; Costa et al. 2008). The AMD samples used in this work were collected in the winter (January 31) and summer (July 27) of 2015 from one of the reddish-yellow dams (Online Resource, Fig. OR1) and were immediately transported (within ≈ 90 min) to the laboratory for char-acterization (Table 1).
Source of OMWW
The OMWW used in this study was collected in autumn 2015 from the mill Lagar de Santa Catarina (37° 09′05.8″ N 7° 47′20.5″ W), located in the village Santa Catarina da Fonte do Bispo, Algarve, Portugal. The collection of OMWW for this work was done in the first of four succes-sive settling tanks (≈10,000 L each) downstream from the separation of olive oil and crude olive cake, and upstream of the final evaporation pond (Online Resource, Fig. OR2). An initial characterization of the OMWW was conducted by analysing a sample for pH, COD, total nitrogen, total phosphate, sulphate, and total phenols (Table 2).
Source and Cultivation of the SRB Community The seeding community of SRB used for this work was obtained from a sludge sample collected from a wastewater treatment plant located between Faro and Olhão, in south-ern Portugal, by enrichment in Postgate B medium (Post-gate 1984) under anaerobic conditions at room tempera-ture (25 ± 3 °C) for about 2 weeks. The SRB community was maintained in the laboratory under these conditions through successive cultures inoculated with 1% (v/v) of the previous ones.
Table 1 Brief characterization of AMD waters collected at São Domingos Mine
Eh—using a correction factor of 241 mV applied to the measured redox potential
Winter AMD Summer AMD
pH (s.u.) 2.48 2.28 Eh (mV) 378 627 SO42− (mg/L) 1848 3846 Al (mg/L) 138 332 Fe (mg/L) 95 323 Zn (mg/L) 38 94 Cu (mg/L) 31 72 Mn (mg/L) 9.2 19
Table 2 Brief characterization of OMWW collected at the olive mill Lagar de Santa Catarina
COD chemical oxygen demand
pH (s.u.) 4.13 COD (mg/L) 44,800 Total N (mg/L) 2182 Total P (mg/L) 127 SO42− (mg/L) 530 Total phenols (mg/L) 610
Batch Reactor Experiments
Neutralization of AMD for the Batch Tests
The seeding SRB communities used in this work are active under neutral conditions but are less active at pH values < 5.5 (Martins et al. 2009). Therefore, the pH of the winter AMD (wAMD) used in the batch tests was first neutralized using limestone gravel (grain size 0.5–1.5 cm) purchased from LUSICAL, a company of the Lhoist group (https ://www. lhois t.com/), at a ratio of 1 kg/L of AMD in an overnight (16 h) bath. The effect on metal concentrations and pH will be discussed later. The liquid fraction was then decanted and used for the batch tests.
Experimental Setup for the Batch Tests
In previous work, a test using a 20% (v/v) dose of OMWW in Postgate B medium without lactate (making a 1:5 dilution) revealed high SRB activity (Carlier et al. 2019). Therefore, in this work the batch experiments were performed using the same dilution factor. The batch tests were performed using 20% (v/v) OMWW diluted in pH-neutralized winter AMD (nwAMD), with 5% (v/v) inoculum of the seeding SRB-enriched culture. The positive controls (no nwAMD) consisted of 20% (v/v) OMWW diluted in Postgate B with-out lactate, inoculated with 5% (v/v) of the same seeding SRB-enriched culture used in the tests. The negative controls (no SRB) consisted of batch flasks with 20% (v/v) OMWW (previously centrifuged to remove bacteria) diluted in either Postgate B medium without lactate or in nwAMD.
In a first set of 21 day batch tests, the mixture of the acidic OMWW with nwAMD became too acidic (pH 4.28), preventing the rapid growth of SRB. Therefore, a second set of batch tests kept for 28 days was carried out in which 10% (w/v) of a fine powder residue from a marble stone
cutting and polishing industry was added to the cultures as a buffering agent. This ground marble is mainly composed of dolomite (*89%), quartz (*11%), and traces of illite (Barros et al. 2009), and previous tests showed that no biological sulphate reduction occurs in the presence of this material without the addition of a suitable carbon source/ electron donor (data not shown). Table 3 summarizes the experiments performed on the batch reactors.
The assays were all carried out in triplicate using 100 mL glass bottles. The medium was purged with nitro-gen gas to create anoxic conditions, and about 10 mL of liquid paraffin was added to eliminate oxygen diffusion. The bottles were sealed with butyl rubber stoppers and aluminium crimp seals and incubated at room tempera-ture (25 ± 3 °C). Postgate B medium, glass bottles, rub-ber stoppers, and pipetting materials used for the batch experiments were previously autoclaved for 20 min at 121–124 °C (200 kPa) for sterilization.
Monitoring of the Batch Tests
To monitor the evolution of the batch reactors, 2 mL sam-ples were collected from the initial media and from all replicates during the experiments through the rubber stop-pers using a syringe and analysed. The maximum total volume collected was 10 mL (10% of the initial volume). Dissolved sulphate and sulphide concentrations were mon-itored weekly as indicators of SRB activity, while redox potential (Eh) and pH were monitored weekly due to their importance as limiting factors for SRB growth (O’Flaherty et al. 1998; Postgate 1984; Willow and Cohen 2003). The concentrations of dissolved Fe, Cu, and Zn were deter-mined weekly to evaluate metal removal in the incubation period. The concentration of total phenols was determined in the initial and final samples.
Table 3 Batch experiments (all conditions tested in triplicate)
OMWW olive mill wastewater, nwAMD neutralized winter acid mine drainage, SRB sulphate reducing
bac-teria
Experiment without calcite (21 days) Experiment with calcite (28 days)
Tests 20 mL OMWW 75 mL nwAMD 5 mL SRB inoculum 20 mL OMWW 75 mL nwAMD 5 mL SRB inoculum 10 g marble powder Positive controls 20 mL OMWW
75 mL Postgate B without lactate 5 mL SRB inoculum
– Negative controls 20 mL OMWW (centrifuged)
80 mL nwAMD 20 mL OMWW (centrifuged)80 mL nwAMD
10 g marble powder 20 mL OMWW (centrifuged)
Continuous Flow System Experiments
Continuous Flow System
The continuous flow bioremediation tests for AMD treat-ment using a SRB-based process feed with OMWW as a carbon source/electron donor supplement were carried out in a system comprised of two main components: a neutrali-zation tank with limestone gravel, and an upflow anaerobic packed bed (UAPB) bioreactor enriched with SRB (Fig. 1). The glass neutralization tank was 22 cm long, 15 cm wide, and 7 cm deep, had 1 kg of crushed limestone (grain size: 0.5–1.5 cm) arranged so that the AMD passed through the limestone particles (see the profile section of the neutrali-zation tank in Fig. 1), and had a working volume of ≈ 1 L. The UAPB bioreactor was a 35 cm high and 5.5 cm diam-eter glass cylinder filled initially with coarse sand (grain size: 0.2–0.5 cm); to correct the observed acidification, it was subsequently filled with a mixture of coarse sand and crushed limestone in a 1/1 ratio (v/v) to maintain a work-ing volume of ≈ 400 mL. The bioreactor and the container collecting the effluent were placed inside a fume hood to prevent contamination of laboratory air with H2S.
Start‑Up and Acclimatization Stages of the UAPB Bioreactor
The bioreactors were enriched with SRB for 2 weeks in batch mode using Postgate B medium inoculated with 10% (v/v) of the same seeding SRB culture used to inoculate
the batch tests. After this start-up period, after sulphate reduction was observed by decay of ≈90% of the sulphate concentration and corresponding rise in sulphide, the most probable number method was applied using anaerobic test tubes with Postgate E medium to confirm that the number of SRB colony-forming units (CFU) reached at least 106.
Afterwards, to acclimate the microbial community to AMD and to OMWW, the flow was initiated at 2.5 mL/h, making a hydraulic retention time (HRT) of 6.7 days in the biore-actor: first, for 5 days, the bioreactor was fed a mixture of 60% (v/v) Postgate B, 40% (v/v) nwAMD (delivered from the neutralization tank), and supplements of 0.4 mL etha-nol injected in the bottom of the bioreactor at 2-day inter-vals to compensate for the lack of carbon sources in the AMD; thereafter, the bioreactor was fed a mixture of 35% Postgate B, 45% nwAMD, and 20% OMWW until high sul-phate reduction activity was restored. Both the start-up and acclimatization stages were conducted at room temperature (25 ± 3 °C).
Treatment Tests on the UAPB Bioreactor
After the start-up and acclimatization stages, the stock of wAMD was depleted, and it was necessary to collect addi-tional AMD during the summer (sAMD) for the continuous flow treatment tests (Table 1). The continuous treatment tests were also performed at room temperature (25 ± 3 °C) and began with a mixture of 80% (v/v) sAMD and 20% (v/v) OMWW (the dilution successfully tested in the batch Fig. 1 Schematic representation
of the continuous flow system
1 - AMD supply tank;
2 - Neutraliza on tank with limestone gravel (profile sec on);
3 – OMWW supply tank;
5 - UAPB bioreactor with coarse sand or with a mix of 50% (v/v) coarse sand and limestone gravel, aer op miza on (profile sec on).
Item / Tag 1 2 3 4
Inlet
raw AMD raw AMD OMWW
neutralized AMD
+ OMWW Outlet neutralizedAMD effluenttreated Capacity (L) 5 2 0,05 0,8315 Working volume (L) 1 0,4
1
4
2
3
experiments), with the same flow rate and HRT used in the acclimatization stage (flow = 2.5 mL/h; HRT = 6.7 days). Several operational conditions were tested for process opti-mization, as described in the results and discussion section.
Monitoring the UAPB Bioreactor
To monitor the continuous flow system during the start-up and acclimatization stages, pH, Eh, and sulphate and sul-phide concentrations were determined in the neutraliza-tion tank outlet and in the bioreactor outlet, approximately weekly. During the treatment tests phase, these four param-eters and Al, Fe, Zn, Cu, and Mn concentrations were deter-mined in both outlets on the same frequency. Total phenol concentration was determined in the bioreactor outlet, though less frequently (18 day intervals, on average). Analytical Methods
Samples from the batch and the flow-through tests were ana-lysed after centrifugation at 2500 g for 5 min at room tem-perature to remove suspended solids. A pH/E Meter GLP 21 (CRISON) was used to measure Eh with a Pt electrode cou-pled with a reference-saturated calomel electrode (CRISON, 52 61) and pH with a glass pH electrode (VWR, SJ 223). Redox measurements were converted to Eh values using a conversion factor of 241 mV for the Pt electrode. A UV–vis-ible spectrometer DR2800 (Hach-Lange) was used to deter-mine: (1) the sulphate and sulphide concentrations, using the sulfaVer4 (Method 8051, Hach-Lange) and the methylene blue (Method 8131, Hach-Lange) procedures, respectively at 450 and 665 nm; (2) COD, using the dichromate method (kit LCK 514, Hach-Lange) with 2 h digestion at 148 °C, at 605 nm; (3) total nitrogen and total phosphorus, using persulphate digestion (Method 10,072, Hach-Lange) and molybdovanadate with acid persulphate digestion (Method 10,127, Hach-Lange) procedures, respectively at 410 and 420 nm; (4) total phenols, using the 4-nitroaniline method (Kits: LCK 345 (0.05–5 mg/L) and LCK 346 (5–200 mg/L) Hach-Lange, respectively at 478 and 510 nm). Metals deter-mination was conducted after acidification of the samples with nitric acid (to 5%). The concentrations of Fe, Zn, Cu, and Mn were measured using flame atomic absorption spec-troscopy with a novAA 350 system (Analytik Jena), and the concentration of aluminium was measured by microwave plasma atomic emission spectrometry with a 4200 MP-AES (Agilent), in both cases with calibration curves developed using standards prepared from the following stock solu-tions: Fe(NO3)3 in 0.5 M HNO3, Zn(NO3)2 in 0.5 M HNO3,
and Cu(NO3)2 in 0.5 M HNO3 (Merck Certipur, Germany); Mn(NO3)2 in 0.5 M HNO3 and Al(NO3)3 in 0.5 M HNO3
(Panreac AA, Spain).
Taxonomic Characterization of Bacterial Communities
Studied Communities
To identify the most important bacteria involved in the tested treatment process, the bacterial population composition was studied in the SRB-enriched culture used as an inoculum, in two samples from the batch experiments, and in one sample from the continuous UAPB bioreactor. Samples from the batch experiments were collected at the end of both tests with 20% OMWW, 75% nwAMD, and 5% SRB inoculum: one with the 10 g supplement of marble powder as a buffer-ing material (sample name: Y) and the other without the marble powder (sample name: AR). The UAPB bioreactor sample used for bacterial population studies was collected on operational day 372, during the last week of this experi-ment (sample name: Reactor IV).
DNA Extraction
The DNA extraction was accomplished by centrifuging 10-mL samples at 2500 g for 10 min to collect cells. Super-natants were discarded, and the cells were resuspended in 200-µL TEG buffer (25 mM TRIS, 10 mM EDTA pH 8.0 and 50 mM glucose). Genomic DNA was subsequently extracted and purified using the PowerSoil DNA Isolation Kit (MO BIO laboratories) according to the kit’s protocol.
16S rRNA Amplicon Library Preparation
The extracted and purified DNA was used for library con-struction of the V1-V3 16S rRNA gene’s region by polymer-ase chain reaction (PCR) bpolymer-ased on Caporaso et al. (2012) and using primers (27F: AGA GTT TGA TCC TGG CTC AG and 534R: ATT ACC GCG GCT GCTGG) adapted from the Human Gut Consortium (Ward et al. 2012). PCR amplifica-tions were performed using reacamplifica-tions of 25 µL, with 10 ng of extracted DNA as the template, 400 µM of each dNTP, 1.5 mM of MgSO4, 1 U of Platinum®Taq DNA polymerase
HF, in 1X Platinum® High Fidelity buffer (Thermo Fisher
Scientific, USA), and 400 nM of each primer containing bar-coded library adaptors. The settings for PCR cycling were: one initial denaturation step at 95 °C for 2 min, 30 cycles of amplification (95 °C for 20 s, 56 °C for 30 s, 72 °C for 60 s), and a final elongation step at 72 °C for 5 min. Duplicate PCR amplifications were performed for each sample, and the duplicates were pooled. The amplicon libraries were purified using the standard protocol for Agencourt Ampure XP Bead (Beckman Coulter, USA) with a modified bead to sample ratio of 4:5, then eluted in 33 μL of nuclease-free water (Qiagen, Germany); their DNA concentration was measured using Quant-iT™ HS DNA Assay (Thermo Fisher Scientific,
USA) and quality validated with a Tapestation 2200, using D1000 ScreenTapes (Agilent, USA).
DNA Sequencing
The purified sequencing libraries were pooled in equimolar concentrations and diluted to 4 nM. The samples were paired end sequenced (2 × 301 base pairs) on a MiSeq (Illumina) using a MiSeq Reagent kit v3 (Illumina, USA) following the kit’s standard guidelines for preparing and loading sam-ples on the MiSeq. The Phix control library was used as an in-run control (20% spiked-in) for run quality monitoring to overcome the low complexity issue often observed with amplicon samples.
16S rRNA Amplicon Bioinformatic Processing
Initial processing included trimming the forward and reverse sequences for quality reads using Trimmomatic v. 0.32 (Bolger et al. 2014) with the settings SLIDINGWIN-DOW:5:3 and MINLEN:275. The trimmed forward and reverse reads were subsequently merged using FLASH v. 1.2.7 (Magoc and Salzberg 2011) with the settings -m 25 -M 200, and the merged sequences were dereplicated and formatted using the UPARSE workflow (Edgar 2013). The dereplicated reads were then clustered into operational taxo-nomic units (OTUs) using the “cluster_otus” command of USEARCH (vers. 7.0.1090; Edgar 2013) with default set-tings, and the OTU abundances were estimated for a 97% sequence identity using the “usearch_global” command with parameter-id 0.97. The taxonomic classifications of OTUs were assigned using the RDP classifier (Wang et al. 2007) as implemented in the parallel_assign_taxonomy_rdp.py script in QIIME (Caporaso et al. 2010), using the Greengenes database taxonomy v.13.8. The results were analysed in R (R Core Team 2015) through the Rstudio IDE using the “ampvis” package v.1.9.1 (Albertsen et al. 2015).
Nucleotide Sequence Accession Numbers
The DNA sequences obtained from the batch tests were published in the NCBI high-throughput DNA and RNA sequence read archive (SRA) with the identifiers BioPro-ject: PRJNA304303 and SRA: SRP066901. The sequences from the test with 10% (w/v) marble powder (sample Y) were identified with BioSample: SAMN04297453; Runs: SRR2969424 and SRR2969423. The sequences from the test without marble powder (sample AR) were identified with BioSample: SAMN04297454; Runs: SRR2969430 and SRR2969425. The OTU sequences obtained from the taxonomic study in the batch experiments were published with GenBank accession numbers KU206784 to KU207047.
The DNA sequences obtained from the UAPB biore-actor (sample Rebiore-actor IV) have the identifiers BioPro-ject: PRJNA472456, SRA: SRP148642, BioSample: SAMN09236008, and Run: SRR7195056. The OTU sequences obtained from the taxonomic study in the UAPB bioreactor were published with GenBank accession numbers MG554745 to MG557554.
Results and Discussion
Batch Reactors
Neutralization of AMD for the Batch Tests
The batch experiments were carried out with nwAMD (the pH of the wAMD increased from 2.48 to 6.32, causing met-als to precipitate as metmet-als hydroxides. Although the con-centration of Fe in the nwAMD was low (0.07 mg/L), the concentrations of Zn and Cu were still relatively high (35 and 13 mg/L, respectively), as expected because precipita-tion of these elements occurs at higher pH values (Online Resource, Fig. OR3 to OR7). The sulphate concentration of the nwAMD remained as high (1803 mg/L) as in wAMD before pH neutralization (Table 1). These results are similar to those obtained by Vitor et al. (2015), who also used mar-ble powder to neutralize AMD collected at the São Domin-gos Mine: the pH was raised to ≈ 7, and Fe was almost totally removed (to ≈ 0.1 mg/L), while Zn, Cu, and sulphate concentrations were respectively ≈ 10, 1, and 2000 mg/L.
Batch Reactors Without Marble Powder
After mixing the acidic OMWW (pH 4.13) with nwAMD (pH 6.32) without the addition of a buffering agent, the mixture became acidic (pH 4.28). Even though this initial acidity was not ideal for the activity and growth of SRB, during the first week of incubation, the pH rose to ≈ 6.8 and the sulphate concentration decreased at the end of the test to 53% of its initial value. Although the early literature claimed strict pH limits on SRB activity, subsequent stud-ies have shown that sulphate reduction at pH values below 5 is possible (Koschorreck 2008). However, the maximum sulphide concentration measured during the experiment was just 3.3 mg/L, which is a sign of low SRB activity (Fig. 2a). In fact, the Eh fell below − 100 mV, which is known to be optimal for SRB (Postgate 1984), only in the last week of the experiment. Thus, it was not surprising that the final sulphate concentration was still relatively high (741 mg/L). Nevertheless, these results show that given time, favourable conditions for SRB were created in the batch reactors. In the negative control (no SRB; Fig. 2b), although sulphate decreased by 28%, the absence
of sulphide production and high Eh (+ 217 to + 235 mV) indicate that this sulphate loss was not caused by SRB activity.
With regard to metal removal, the assay with a SRB inoculum revealed promising results (99.4% Zn and 99.2% Cu removed) with final low concentrations for these metals: 0.20 mg/L Zn and 0.11 mg/L Cu (Fig. 2a). The role of bio-logical activity in these removals was confirmed by the nega-tive control (without SRB inoculum), in which Fe and Cu were not removed, and Zn decreased by only 29% (Fig. 2b).
The slight decreases in sulphate and Zn concentrations in the negative control could suggest the formation of zinc sulphate (ZnSO4). However, the decrease in both concentra-tions does not correspond to the expected stoichiometry for the mineral. There was a decrease of 5.21 mM of sulphate but only 0.16 mM Zn. It is more likely that there was some reduction of sulphate to sulphide, even if minimal, due to SRB putatively present in the OMWW, leading to precipi-tation of zinc sulphide (ZnS). Still, this does not justify the observed sulphate decrease. Another possibility is the pre-cipitation of compounds or complexes resulting from some type of interaction between sulphate in the nwAMD and the
phenols or other plant compounds present in the OMWW. Further research is needed to evaluate this hypothesis.
Regarding the concentration of total phenols, decreases to about one tenth of the initial value were observed after 3 weeks, both in the test inoculated with SRB and in negative control without inoculum (Fig. 2a, b). Even though the final concentration of total phenols in the inoculated and uninocu-lated flasks (5.5 mg/L and 5.0 mg/L, respectively) were still relatively high, the removal is important because phenols are the recalcitrant main pollutant in OMWW. The previous centrifugation of OMWW was expected to eliminate most suspended solids and bacteria but not to completely steri-lize the wastewater. Therefore, it is likely that the OMWW contained trace amounts of phenol-degrading microbes that may have contributed to the observed decrease in concentra-tion. Mineralisation of phenols can proceed under anaerobic conditions through different pathways metabolized by con-sortia of various microorganisms (Levén et al. 2012). Some abiotic reactions may have also contributed to the decrease in phenol concentrations. Information in the literature sup-ports the possibility that some metals and/or the sulphate in the AMD may have helped degrade the phenols when
0 500 1000 1500 0 20 40 60 80 100 0 7 14 21 Sulphate (mg/L) Total Phenols, Sulphide (mg/L) days A
[Sulphide] [Total Phenols] [Sulphate]
-500 -300 -100 100 300 500 0 2 4 6 8 10 0 7 14 21 Eh (mV) pH (s.u.) days B pH Eh 0 10 20 30 40 0 7 14 21 (mg/L) days C
[Zinc] [Iron] [Copper]
0 500 1000 1500 0 20 40 60 80 100 0 7 14 21 Sulphate (mg/L) Total Phenols, Sulphide (mg/L) days A
[Sulphide] [Total Phenols] [Sulphate]
-500 -300 -100 100 300 500 0 2 4 6 8 10 0 7 14 21 Eh (mV) pH (s.u.) days B pH Eh 0 10 20 30 40 0 7 14 21 (mg/L) days C
[Zinc] [Iron] [Copper]
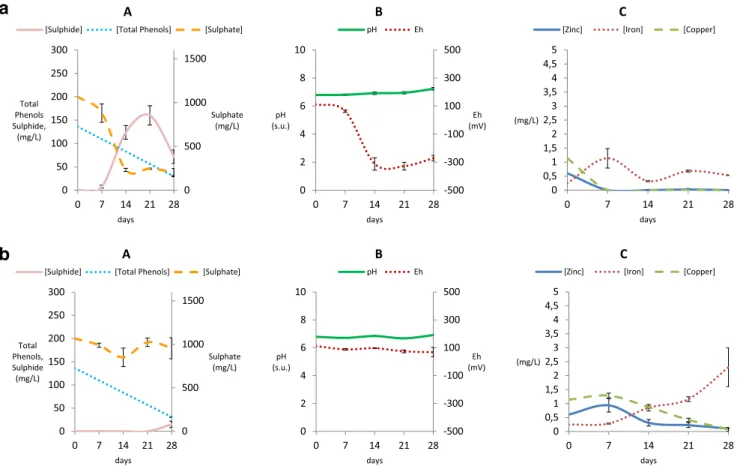
a
b
Fig. 2 Results from the 21-day batch experiments without addition of marble residue powder: a Results from test with 20 mL OMWW, 75 mL nwAMD, and 5 mL SRB-enriched inoculum, b Results from
negative control: 20 mL centrifuged OMWW, 75 mL nwAMD, no SRB enriched inoculum. A: sulphate, sulphide, and total phenols; B: pH and Eh; C: Zn, Fe, and Cu
the wastewaters were mixed. Several studies have shown that a wide range of environmental contaminants can be reduced by Fe2+ absorbed to or within Fe oxides; it has
also been shown that zero-valent Fe or Fe2+ can generate
reactive oxidants such as ·OH, Fe4+, and O
2 to oxidize
con-taminants (e.g. Fang et al. 2013). Fenton reagents (oxidant hydrogen peroxide (H2O2) activated by several Fe2+-bearing
minerals) producing the hydroxyl radical (·OH) are widely
used as advanced oxidation processes for degrading recal-citrant organic contaminants. Another well-known oxidant widely used to break down organics is the permanganate ion (MnO4−), which has the advantages of being relatively
cheap, easy, and safe to use, compared to hydrogen peroxide (e.g. de Souza e Silva et al. 2009). Moreover, it is known that the sulphate radical (SO4·−) is more powerful for the
decom-position of contaminants at neutral pH than the hydroxyl radical (·OH). In fact, when peroxymonosulphate (SO
52−) or
peroxydisulphate (S2O82−) are activated by catalysts (such
as Co, Ag, Cu, Fe), they generate SO4·−, which degrades
organic pollutants (Mezyk et al. 2011; Zhang et al. 2015). Thus, sulphate radical-based advanced oxidation processes (SR-AOPs) using SO52− or S2O82− for the degradation of
several organics, including phenols, have attracted increas-ing attention (e.g. Khan et al. 2017; Wang et al. 2015).
Batch Reactors with Marble Powder
In the second set of tests carried out with marble powder added to the batch flasks as a buffering material, the pH remained neutral (6.79–7.23), and a large reduction in sul-phate concentrations was observed. In the inoculated test, the maximum SRB activity was observed during the second week, in which the Eh decreased from + 64 to − 313 mV, and 78% of the initial sulphate concentration was reduced (Fig. 3a). Throughout the test, sulphide reached a concentra-tion of 160 mg/L and the sulphate concentraconcentra-tion decreased from 1066 to 207 mg/L.
The removal of metals by SRB was inconclusive because the pH neutralization before bacterial inocula-tion removed metals by precipitainocula-tion, most likely as metal hydroxides. First, before the beginning of the assays, the wAMD was neutralized with limestone gravel to nwAMD (pH 2.48—> 6.32). Then, after the acidification caused by the addition of OMWW to nwAMD (pH 6.32—> 4.28),
0 500 1000 1500 0 50 100 150 200 250 300 0 7 14 21 28 Sulphate (mg/L) Total Phenols Sulphide, (mg/L) days A
[Sulphide] [Total Phenols] [Sulphate]
-500 -300 -100 100 300 500 0 2 4 6 8 10 0 7 14 21 28 Eh (mV) pH (s.u.) days B pH Eh 0 0,51 1,52 2,53 3,54 4,55 0 7 14 21 28 (mg/L) days C
[Zinc] [Iron] [Copper]
0 500 1000 1500 0 50 100 150 200 250 300 0 7 14 21 28 Sulphate (mg/L) Total Phenols, Sulphide (mg/L) days A
[Sulphide] [Total Phenols] [Sulphate]
-500 -300 -100 100 300 500 0 2 4 6 8 10 0 7 14 21 28 Eh (mV) pH (s.u.) days B pH Eh 0 0,51 1,52 2,53 3,54 4,55 0 7 14 21 28 (mg/L) days C
[Zinc] [Iron] [Copper]
a
b
Fig. 3 Results from the 28-day batch experiments with 10% (w/v) marble residue powder: a test with 20 mL OMWW, 75 mL nwAMD, and 5 mL SRB-enriched inoculum, b negative control with 20 mL
centrifuged OMWW, 75 mL nwAMD, no SRB-enriched inoculum. A: sulphate, sulphide, and total phenols; B: pH and Eh; C: Zn, Fe, and Cu
a second neutralization step occurred when marble pow-der was added to the batch flasks (pH 4.28—> 6.79). Nevertheless, three metals were detected in the begin-ning of the experiment (Cu: 1.14 mg/L; Zn 0.61 mg/L; Fe: 0.25 mg/L), and only one was above detection at the end (Cu < 0.4 mg/L; Zn < 0.07 mg/L; Fe: 0.53 mg/L) (Fig. 3a). In the negative control, the Eh remained posi-tive (+ 68 to + 112 mV), which is not suitable for SRB, and no sulphate was removed. However, in the fourth week, a small increase in sulphide concentration was observed (Fig. 3b). This is a sign that some sulphate reduction occurred (though very low compared to the inoculated tests), which suggest the presence of SRB in the OMWW used in this work (despite the attempt to remove bacteria from it by centrifugation). Further work may be performed to discover whether these putative SRB belong to the spe-cies Desulfovibrio marrakechensis discovered in OMWW collected in Morocco by Chamkh et al. (2009) or if they belong to other species. The presence of sulphide in the negative control with marble powder justifies the decrease of Cu and Zn from 1.14 mg/L and 0.61 mg/L to 0.08 mg/L and 0.10 mg/L at the end of the experiment, respectively (Fig. 3b), suggesting possible precipitation as metal sul-phides. The role of sulphide in these removals was con-firmed by the negative control without marble powder, in which sulphide was not detected and Cu was not removed, while Zn decreased by just 29% (Fig. 2b).
Surprisingly, in both negative controls, the Fe con-centration gradually increased during the experiments, reaching 4.98 mg/L without marble powder (Fig. 2b) and 2.30 mg/L with marble powder (Fig. 3b). In fact, even in both tests inoculated with SRB (with and without marble powder), the increasing trend in Fe concentrations was also observed in the first week, though values decreased as sulphate concentrations fell (Figs. 2a, 3a). It is known that Fe-based nanoparticles have a strong affinity for organic compounds, and several researchers have reported their use in removing various pollutants from wastewaters, includ-ing from OMWW (Nassar et al. 2014; Ochando-Pulido et al. 2013). It is possible that the increasing Fe concentra-tion was caused by putative interacconcentra-tions between Fe-based particles and organic compounds from the OMWW.
Again, as in the experiment without marble powder, significant decreases in total phenols were observed in the test inoculated with SRB and the negative control with-out SRB. This reinforces the idea that this removal may have been caused by biological activity of microorgan-isms present in the OMWW and/or by abiotic processes, as discussed above. The final phenol concentrations (29.5 ± 0.8 mg/L and 31 ± 1 mg/L respectively) were about one fifth of the initial values in the batch flasks (Fig. 3a, b).
Continuous Flow System
Neutralization Tank
Effective neutralization of AMD from pH 2.48 (wAMD) or 2.28 (sAMD) to 7.2 ± 0.2 provided optimal pH conditions for SRB activity and growth (pH between 5 and 8; e.g. Cohen 2006). Moreover, also favouring these bacteria, the concen-tration of sulphate after the neutralization step remained high: during the acclimatization stages (when wAMD was used), the sulphate concentration in the neutralization tank outlet was 1668 ± 15 mg/L, while during the treatment tests (when sAMD was used), the sulphate concentration in the outlet of this tank was 2106 ± 96 mg/L (Fig. 4).
Regarding metals treatment in the neutralization tank, removal efficiencies > 99.5% were achieved for Al, Fe, and Cu, while removals of 32 ± 16% and 77 ± 5% were achieved for Mn and Zn, respectively (Fig. 4, Table 4). Manganese concentrations dropped from 14 ± 2 to 9 ± 1 mg/L after the hydraulic retention time (HRT) in the neutralization tank had been increased from 21 to 42 days by cutting the flow in half on the 246th day of the experiment. The flow of the entire system (neutralization tank and UAPB bioreactor) was adjusted depending on the sulphate reduction efficiency in the UAPB bioreactor, as discussed below.
The precipitation of metals in the neutralization step was visible as a fine orange sludge, but during the experiment, most of the sludge accumulated in the inlet zone of the tank where there was no limestone. Removal of metal ions in the neutralization tank was expected due to the higher pH, per the metal speciation-pH plots generated with Medusa-Hydra software (Puigdomenech 2015) (Online Resource, Fig. OR3-OR7). The diagrams show that Al and Fe begin to hydro-lyse at low pH and form solid (oxy)hydroxides, while Cu and Zn hydrolyse and precipitate as hydroxide solids at still higher pH values. Mn will form oxides but not hydroxides at neutral and higher pH values. Abiotic Mn oxidation by oxygen is very slow at pH values below 9 (Stumm and Mor-gan 1995). Moreover, reduced Fe reacts faster with oxygen than Mn; its presence may inhibit or reverse Mn oxidation (Luan et al. 2012), and if Fe competes for oxygen, a pH of 10 may be needed to remove the Mn as an oxide (Lovett 1992). The higher HRT since day 246 probably allowed the water to stay in the neutralization tank for a longer time after Fe removal, thus decreasing the competition for oxy-gen and leading to slightly improved Mn removal. Indeed, Mn removal in limestone-filled channels at pH ≥ 7 proceeds much better if Fe and Al are first removed by pretreatment (Skousen et al. 2017).
Since the abiotic oxidation rate of Mn2+ is limited
under neutral conditions and biotic oxidation processes are responsible for the formation of most environmental Mn oxides (Diem and Stumm 1984), the biological (microbial)
oxidation of Mn has been considered as a viable alternative for water treatment removal of this metal (e.g. Katsoyiannis and Zouboulis 2004). Even if efficient bacterial generation of biogenic Mn oxide requires aeration and supplying organic nutrients, the use of algae can overcome this drawback since they are primary producers, and their photosynthesis
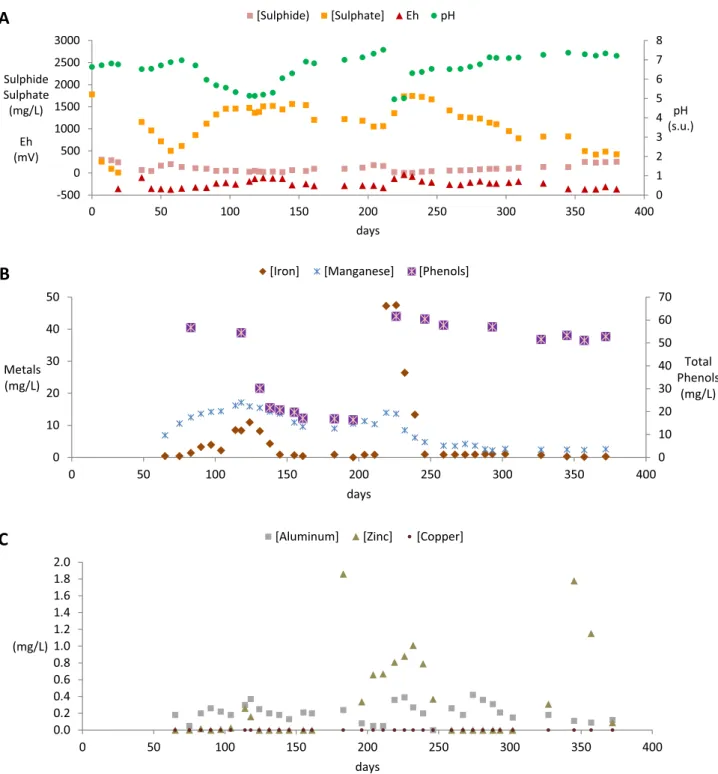
increases dissolved oxygen levels and phycosphere pH, thus creating conditions for Mn oxidation (Wang et al. 2017). It has been long known that Mn precipitation can be achieved in passive in-line treatment systems with bacteria, cyano-bacteria, fungi, diatoms, and green algae participating in the process (Robbins 1999). 0 1 2 3 4 5 6 7 8 -500 -2500 250 500 750 1000 1250 1500 1750 2000 2250 2500 2750 3000 0 50 100 150 200 250 300 350 400 pH (s.u.) Sulphate (mg/L) Eh (mV) days
A
[Sulphate] Eh pH 0 5 10 15 20 25 30 35 0 50 100 150 200 250 300 350 400 (mg/L) daysB
[Iron] [Zinc] [Manganese]0.0 0.2 0.4 0.6 0.8 1.0 1.2 1.4 1.6 1.8 2.0 0 50 100 150 200 250 300 350 400 (mg/L) days
C
[Aluminum] [Copper]Fig. 4 Parameters monitored in the neutralization tank of the continuous flow experiment. a: sulphate, pH, and Eh; b: Fe, Zn, and Mn; c: Al and Cu
UAPB Bioreactor
Sulphate removal efficiencies: The different operational conditions tested (Fig. 5) and the evolution of monitored parameters during the continuous flow experiment (Fig. 6) allowed us to evaluate and optimize the efficiency of the treatment process. During the bioreactor start-up in batch mode with Postgate B medium, from day 0 to 14, the decrease in sulphate concentration from 1781 to 97 mg/L and the achievement of 289 mg/L sulphide indicates high SRB activity and growth (Fig. 6a). This was confirmed by the high number of SRB CFUs (3.7 × 10⁶) counted in a
sample collected from the bioreactor midpoint at the end of this period (day 14). After the start-up period (at day 15), to acclimate the microbial community to AMD, the bioreactor was fed for 5 days with a 2.5 mL/h flow (making a HRT of 6.7 days) with a 60% (v/v) Postgate B and 40% (v/v) nwAMD mixture (see Fig. 5) and supplements of 0.4 mL ethanol injected at 2-day intervals to compensate
for the lack of carbon sources in the AMD. During this period, high sulphate reduction was still observed, as shown by the 12 mg/L sulphate and 244 mg/L sulphide in the bioreactor outlet on day 19 (Fig. 6a). Then, to accli-mate the microbial community to OMWW, starting on day 21, a mixture of 35% Postgate B, 45% nwAMD, and 20% OMWW was supplied at the same flow rate (2.5 mL/h) and HRT (6.7 days; see Fig. 5). This mixture caused a slight drop in pH (from day 0 until day 21, pH = 6.81 ± 0.08 and between days 36 and 46, pH = 6.53 ± 0.1) and a decreased rate of sulphate removal (on day 36, sulphate concen-trations reached 1155 mg/L and sulphide dropped to 68 mg/L). This decline in sulphate reduction efficiency was expected because the microbial consortium in the bio-reactor had been enriched and maintained with lactate- and ethanol-based feeds, compounds that can be directly used by most SRB, and then had to adapt to the carbon sources present in the OMWW, which must be first bio-logically transformed into simpler compounds. OMWW is Table 4 Efficiency of treatment
in the neutralization tank throughout the continuous flow experiment, after start-up and acclimatization (day 58–380)
a Cu detection limit
Parameter Inlet (sAMD) Outlet (nsAMD) Removal average Units Removal %
Average St. Dev Average St. Dev
pH 2.28 7.2 0.2 – s.u – – Eh 627 262 43 – mV – – Mn 19 13 3 6 mg/L 32 16 Cu 72 < 0.4a – > 71.6 mg/L > 99.4 – Zn 94 22 5 72 mg/L 77 5 Fe 323 0.7 0.4 322 mg/L 99.8 0.1 Al 332 0.4 0.3 332 mg/L 99.9 0.1 SO42− 3846 2106 96 1740 mg/L 45 2 0 2 4 6 8 10 12 14 16 18 20 0 10 20 30 40 50 60 70 80 90 100 0 50 100 150 200 250 300 350 400 HRT (days) % (v/v) days
Postgate B OMWW nwAMD nsAMD Limestone added to coarse sand bed HRT
Fig. 5 Operational conditions in the UAPB bioreactor of the continu-ous flow experiment. Liquid medium/influent composition: Postgate B medium, OMWW, and neutralized AMD % (v/v). Neutralized win-ter AMD was used from day 1 to day 58; neutralized summer AMD
was used from day 58 to end of the experiment. Packed bed composi-tion: limestone gravel % (v/v) added to coarse sand. Hydraulic Reten-tion Time (HRT) regime
an aqueous extract of olives that is rich in sugars (Amaral et al. 2008; Azbar et al. 2004) that, despite being soluble compounds, must first be transformed by fermenters into alcohols and organic acids that can be used by SRB (e.g. Seyler et al. 2003). Nevertheless, after that, SRB activ-ity started to recover gradually: sulphate concentration in the bioreactor outlet decreased to 503 mg/L and sulphide
reached 199 mg/L by day 57 and the pH rose to more neutral values (pH = 6.78 ± 0.12 between days 50 and 57).
After the start-up and acclimation stages, the continuous treatment tests began on day 58; the bioreactor was fed with a mixture of 80% nsAMD and 20% OMWW (see Fig. 5) with the same flow rate and HRT used in the acclimation stages (2.5 mL/h and 6.7 days). With this mixture, the pH
0 1 2 3 4 5 6 7 8 -500 0 500 1000 1500 2000 2500 3000 0 50 100 150 200 250 300 350 400 pH (s.u.) Sulphide Sulphate (mg/L) Eh (mV) days
A
[Sulphide) [Sulphate] Eh pH 0 10 20 30 40 50 60 70 0 10 20 30 40 50 0 50 100 150 200 250 300 350 400 Total Phenols (mg/L) Metals (mg/L) daysB
[Iron] [Manganese] [Phenols]0.0 0.2 0.4 0.6 0.8 1.0 1.2 1.4 1.6 1.8 2.0 0 50 100 150 200 250 300 350 400 (mg/L) days
C
[Aluminum] [Zinc] [Copper]Fig. 6 Parameters monitored in UAPB bioreactor effluent of the continuous flow experiment. a sulphate, sulphide, pH, and Eh; b Fe, Mn, and total phenols; c Al, Zn, and Cu
remained neutral for 1 week but then started to drop gradu-ally (Fig. 6a).
On day 90 (pH = 5.68), in a first attempt to reverse the acidification tendency, the bioreactor flow was decreased to 2 mL/h, resulting in a new HRT of 8.3 days. However, the pH continued to drop until it stabilized at a pH of 5.16 ± 0.04 between days 114 and 124), which is below the optimal range for SRB. Thus, as the pH dropped, sulphate concen-trations rose (to 1508 mg/L) and sulphide concenconcen-trations decreased (to 25 mg/L) on day 124, indicating low SRB activity. This phenomenon has been previously reported for sugar-rich substrates. For example, Cao et al. (2012) observed a negative impact on the SRB growth and the sul-phate removal rates when using sucrose, due to the acidity produced by fermentation, which resulted in high contents of volatile fatty acids (butanedioic, lactic, and formic acids). This acidification did not occur in the OMWW acclimation stage, likely because the lactate from the Postgate B was sufficient to assure direct sulphate reduction activity, and the alkaline compounds released from that activity helped maintain a neutral pH.
On day 124, in a second attempt to restore neutral pH, the amount of OMWW was intentionally decreased to 10% (half of the initial dose). Yet, after 1 week (on day 131) the pH in the bioreactor was still acidic (pH = 5.30), the sulphate concentration was high (1519 mg/L), and the sulphide con-centration was low (31 mg/L).
In a third attempt to reverse the acidification trend, the amount of OMWW was decreased on day 132–5% (a quarter of the initial dose). After that, the pH began to rise gradu-ally, becoming neutral on day 155 (pH = 6.91), improving SRB activity somewhat (sulphate concentrations dropped to 1052 mg/L and sulphide concentrations increased to 177 mg/L on day 204; Fig. 6a). In the following week, the concentrations of these compounds (1061 mg/L sulphate and 160 mg/L sulphide on day 211) indicated a steady-state pro-cess with incomplete sulphate reduction (50 ± 3% sulphate removal), most likely due to a lack of carbon sources/elec-tron donors. When OMWW was tested for the first time as the only carbon source/electron donor using batch cultures with Postgate B medium without lactate, such low doses (4% and 3.5% OMWW) produced similarly low sulphate reduc-tion efficiencies (55 ± 14% and 42 ± 2% sulphate removal rates were achieved, respectively; Carlier et al. 2019).
On day 211 the amount of OMWW was raised to the 20% dose successfully tested in the batch cultures, and the pH dropped again to acidic values (pH = 4.99 ± 0.04 between days 219 and 226) and a loss of SRB activity was again observed: sulphate concentrations increased to 1735 mg/L and sulphide concentration dropped to 5 mg/L on day 226 (Fig. 6a). This corresponds to a sulphate removal rate of just 23.1%, which confirmed the existence of a souring problem when OMWW is used to feed a bioreactor with SRB.
To prevent acidification, on day 229, the solid support bed for bacteria inside the bioreactor, which had just comprised coarse sand (grain size: 0.2–0.5 cm) was substituted by a 1/1 (v/v) mix of the same coarse sand plus crushed limestone (grain size: 0.5 to 1.5 cm; see Fig. 5). The experiment con-tinued with a flow of 2 mL/h and an HRT of 8.3 days and an OMWW dose of 20%. After that, the bioreactor returned to neutral pH values (pH = 6.9 ± 0.4 from day 229 to the last day of operation), and SRB activity started to slowly recover. Sulphate removal was only 25.2% on day 246, sul-phate concentrations dropped to 1666 mg/L, and sulphide concentrations increased to 65 mg/L (Fig. 6a).
Aiming further improve sulphate reduction, the bioreac-tor flow was decreased to 1.7 mL/h (HRT of 9.8 days) on day 246. This improved sulphate reduction, and sulphate and sulphide concentrations stabilized at 812 ± 23 mg/L and 129 ± 9 mg/L, respectively, resulting in a sulphate removal efficiency of 62 ± 1% between days 309 and 345. On day 345, the bioreactor flow was decreased again, to 1.3 mL/h (HRT of 12.8 days), and the SRB activity improved to an even higher efficiency. The sulphate removal rate between days 357 and 380 (when the experiment ended) was 75 ± 2%, with sulphate and sulphide concentrations of 456 ± 41 mg/L and 246 ± 9 mg/L, respectively. This corresponds to 1.31 mol of sulphate removed per day per m3 of support bed media.
The comparison of different studies performed with different, or even the same, organic substrates is difficult because of different durations and/or different ratios of AMD and organics in the reactive mixture used in each study. Nev-ertheless, it is known that anaerobic degradation of complex organics to simpler molecules by microorganisms influences the rate at which nutrients become available to SRB; that is, complex molecules require longer HRTs than the simple compounds that are directly usable by SRB (Neculita et al. 2007; Sheoran et al. 2010). In a review paper, Hao et al. (2014) published a table summarizing sulphate reduction rates, HRTs, and benefits/drawbacks of using different elec-tron donors, in which they reported a wide range of HRTs (1–480 h). The HRT of 12.8 days (≈307 h) optimized at the end of the current experiment (see Fig. 5) is in the range of the HRTs reported in that review. For example, the HRT reported for benzene and benzoate was 264 h and for cheese whey and animal manure was 192 h and 216 h, respectively.
Metal and phenol removal efficiencies: Focusing on the period with high SRB activity after the first HRT increase on day 246 (with limestone added to the bio-reactor packed bed; see Fig. 5), the following was observed (Fig. 6b, c): (1) Fe, Al, and Cu, which were largely removed in the neutralization step, remained at similar concentrations after passing through the biore-actor; (2) Zn, which was still present at relatively high concentrations in the nsAMD exiting the neutralization tank, was largely removed in the bioreactor (to 0.3 mg/L,
98% average removal); (3) Mn, the other metal with high inflow concentration in the nsAMD, was not as efficiently removed (70% removal), but did decrease (to 3.1 mg/L; Table 5).
The removal of Zn in the bioreactor can be attributed to the formation of ZnS precipitates. Lewis (2010) has published a graph showing the pH dependence of metal sulphide solubilities. At neutral pH, such as in the bio-reactor under optimized conditions (pH = 7.0 ± 0.3 from day 246 to end), the theoretical solubility of zinc sulphide is ≈ 0.0001 mg/L Zn (Lewis 2010). In fact, batch studies (Pinto da Costa et al. 2012) and flow-through tests (Vitor et al. 2015) previously carried out using lactate and etha-nol as carbon sources/electron donors have shown that sulphide generated by SRB is able to remove Zn, yielding nanosized ZnS precipitates. On the other hand, the solu-bility of manganese sulphide at neutral pH is ≈ 10 mg/L Mn (Lewis 2010), which explains its incomplete removal in the bioreactor. Another possible Mn removal mecha-nism is ion exchange with Ca in the limestone, causing the formation of MnCO3 and the release of Ca2+.
The concentration of total phenols in the bioreactor outlet during the experiment was not influenced by sul-phate reduction. The changes in total phenol concentra-tions over time was mainly due to dilution (see Figs. 5, 6). In addition, some removal of total phenols was observed, but to a lesser extent than in the batch experiments (80–90% removal). Under the most favourable conditions for sulphate reduction in the bioreactor (20% OMWW and 80% nAMD), total phenol concentrations in the outlet (55 ± 4 mg/L) decreased by ≈50% (Table 5).
Potential Utility of the System
Directive 2000/60/EC, amended by water policy directives 2008/105/EC and 2013/39/EU of the European Parliament and of the Council, describes environmental quality stand-ards (EQS) for pollutants classified as priority substances at community level and leaves it to the discretion of the mem-ber states to establish (if necessary) rules for other pollutants at the national level. The major metals present in the AMD studied in this work are not included in these directives. However, in Annex II to Directive 2010/75/EU concerning integrated pollution prevention and control, “Metals and their compounds” are in the “List of polluting substances relevant for fixing emission limit values,” and must be con-sidered by member countries. For example, the limits for metals in this work (as well as for sulphate, sulphide, and total phenols) in wastewater discharges and waters used for irrigation in Portugal, are set in Decree-law no. 236/98 (Table 6).
On the other hand, although phenols are a major difficulty in OMWW detoxification, at the same time they can be a source of valuable products, such as phenolic compounds with antioxidant activity (Obied et al. 2005). Thus, the future management strategy of OMWW treatment should be combining detoxification with production of valuable phe-nolic by-products. However, at present, such solutions for OMWW treatment require the use of sophisticated technical processes that most of the small, geographically-scattered olive mills cannot afford.
The system tested in this work combined a passive chemi-cal step comprised of a limestone-filled tank with a biologi-cal step that is basibiologi-cally a SRB-enriched compost bioreactor that is permanently (or routinely) fed with OMWW as a source of carbon and electron donors instead of having the Table 5 Efficiency of treatment
in the bioreactor since day 246, when SRB activity started to recover after addition of limestone to the bioreactor packed bed, with optimized 20% (v/v) OMWW dose and HRT adjusted to 9.8 and to 12.8 days
a For the period after the first increase of bioreactor HRT (to 9.8 days) on day 246 b For the period after the second increase of bioreactor HRT (to 12.8 days) on day 345 c Cu detection limit
Parameter Inlet (80% nsAMD + 20% OMWW)
Outlet (effluent) Removal average Units Removal %
Average St. Dev Average St. Dev
pHa 5.16 7.0 0.3 – s.u – – Ehb 210 − 352 27 – mV – – Mna 10.4 3.1 0.9 7.3 mg/L 70 9 Cua < 0.4c < 0.4c – – mg/L – – Zna 17.6 0.3 0.6 17.3 mg/L 98 3 Fea 0.56 0.7 0.3 – mg/L – – Ala 0.32 0.2 0.1 – mg/L – – SO42−b 1,791 456 41 1,335 mg/L 75 2 S2−b – 246 9 – mg/L – – Total phenolsa 122 55 4 67 mg/L 55 3
organic substrates added at the time of construction. This type of semi-passive treatment system is relatively easy and inexpensive to construct and maintain. Moreover, as an added benefit, it may also produce valuable by-products: bioremediated OMWW is an excellent fertilizer (Cereti et al. 2004; Mekki et al. 2006) and can serve as a substrate for nitrogen-fixing bacteria or for polymer production (Balis et al. 1996).
The tested system produces an effluent in compliance with the emission limit values (ELVs) of wastewaters dis-charges for all studied compounds except Mn, S2−, and total
phenols. For irrigation waters, the effluent does comply with the maximum recommended values (MRVs) for all com-pounds except Mn and possibly Cu (the detection limit of 0.4 mg/L is higher than the MRV of 0.2 mg/L) and com-plies with the maximum admissible values (MAVs) for all compounds. Therefore, if the objective of such a process for the co-treatment of AMD and OMWW is to discharge the treated effluent in surface waters, further research is needed to optimize the removal of Mn, phenols, and S2− (or the
evaporating H2S—vapor pressure ≈ 13 mm Hg at 21 °C).
If the objective is to produce water for irrigation (phenol concentration is not regulated for irrigation waters), this
depends on the tolerance of the target plants to the final phenol content, and other potential effects have to be con-sidered: that of OMWW phenol degradation on irrigated soils vs. transport of OMWW phenols to waterbodies and their effects on those ecosystems. In any case, since harm to ecological systems and public heath by H2S has driven
the control and abatement of this gas at its source, it will be important to evaluate and include systems for H2S removal (e.g. biofiltration (Vikrant et al. 2018) or adsorption (Bam-dad et al. 2018)). For example, the use of iron oxide rich materials (steel wool, iron filings, scrap iron, etc.), one of the oldest methods still in practice, is a simple and low-cost way to remove H2S from gas streams by forming Fe2S3 (e.g. Choudhury et al. 2019). Future work could include testing the process in a one-step system comprised of a SRB-based bioreactor filled with limestone, or limestone mixed with another material, which would generate less metal oxide sludge and higher amounts of more stable metal sulphide precipitates, as well as an effluent with a lower sulphide concentration.
Bacterial Communities
Although DNA extraction, library preparation, and sequenc-ing were successful for the four samples, the concentration of purified DNA and the final number of 16S rRNA reads obtained was relatively low for sample AR (batch test with-out marble powder; Table 7). The most likely explanation for the low number of reads was less biological mass in that sample compared with the other three, probably due to slower bacterial growth caused by the initial acidity of the medium in that batch test. However, because the study was focused on the most common taxonomic groups (> 10% rela-tive abundance) and not on the rarer taxa, the lower number of reads are less of a concern. The 20 most abundant bacteria estimated by the 16S rRNA reads obtained for the four sam-ples are shown in Table 8 and in circular graphs available in the Online Resource (Fig. OR8).
As expected, the primary communities in the enriched seeding culture used as an inoculum was composed of SRB able to oxidize lactate, the carbon source and electron donor present in the growth medium (Postgate B), and consists of species from two genera: Desulfomicrobium (38.8%) and Table 6 Allowable limits in wastewater discharges and waters used
for irrigation in Portugal for pollutants studied in this work ( adapted from Decree-Law No 236/98) and effluent concentrations for the opti-mized period (see Table 5)
ELVs Emission Limit Values, MRVs Maximum Recommended
Val-ues, MAVs Maximum Admissible Values No established limits
(mg/L) Wastewaters
discharges Irrigation waters Effluent (bioreactor outlet)
ELVs MRVs MAVs Aver. ± Stand. Dev
Al 10 5 20 0.2 ± 0.1 Fe 2 5 – 0.7 ± 0.3 Zn – 2 10 0.3 ± 0.6 Cu – 0.2 5 < 0.4 Mn 2 0.2 10 3.1 ± 0.9 SO42− 2000 575 – 456 ± 41 S2− 1 – – 246 ± 9 Total phenols 0.5 – – 55 ± 4
Table 7 DNA sample concentrations and number of reads after sequencing
Sample DNA (ng/µL) Library (ng/µL) Number of
16S rRNA reads
Inoculum—(SRB enriched culture) 3.8 5.4 90,822
AR—batch test without marble powder 0.1 8.1 6843
Y—batch test with marble powder 3.0 16.4 94,106
Desulfovibrio (22.9%), with the other detected OTUs having percentages < 4%. Desulfomicrobium spp. use simple organic molecules as electron donors for sulphate respiration (such as hydrogen, formate, ethanol, pyruvate, and lactate) and can also be fermentative using other simple organic compounds (such as fumarate, malate, and pyruvate), although they can-not ferment carbohydrates (Genthner and Devereux 2015). Desulfovibrio spp. can also conduct respiratory metabolism with sulphate as the terminal electron acceptor in the oxida-tion of simple organic compounds or a fermentative metabo-lism (Kuever et al. 2015).
The results from samples collected at the end of both batch experiments with 75% (v/v) AMD, 20% (v/v) OMWW, and 5% (v/v) of an SRB-enriched inoculum, one without marble powder and the other with 10% (w/v) marble powder, reveal different bacterial communities. The main difference is that in the culture without marble powder, SRB bacteria from the genus Desulfovibrio (59.5% relative abundancy) are dominant, whereas in the culture with marble powder, this genus represents a smaller proportion (15% relative abun-dancy) of the community, and bacteria from the genus Sul-furospirillum are dominant (70% relative abundancy). This may seem to contradict the fact that sulphate reduction was less efficient in the culture without marble powder than in the culture with it, yet most probably is a consequence of
that fact. In the culture without marble powder, the acidity of the medium at the beginning may have prevented rapid pro-liferation of bacteria from Desulfovibrio genus, but after a week, the pH became neutral and promoted bacterial growth, as indicated by the gradual decrease in sulphate concen-tration during that period. In contrast, in the culture with marble powder, the proliferation of Desulfovibrio bacteria was faster because sulphate was almost completely reduced to sulphide after just 2 weeks, during which time this genus likely became the dominant population. After that time, due to limited sulphate, the bacterial community likely switched to Sulfurospirillum as the dominant genus and Desulfovibrio became the second most common genus. Typical electron acceptors for Sulfurospirillum species are toxic constituents such as arsenate, selenite, nitrate, and sulphur compounds (Goris and Diekert 2016). In the final part of the experi-ment with marble powder, some of the sulphide previously released by the SRB was likely converted to elemental sul-phur, which could then be used by Sulfurospirillum bac-teria. In previous work, elemental sulphur was one of the compounds detected in precipitates collected from an SRB-enriched bioreactor used to test wine wastes as a carbon source to treat AMD (Costa et al. 2009).
In addition to the groups of bacteria referred above, the Deferribacteraceae family was also prominent in the batch
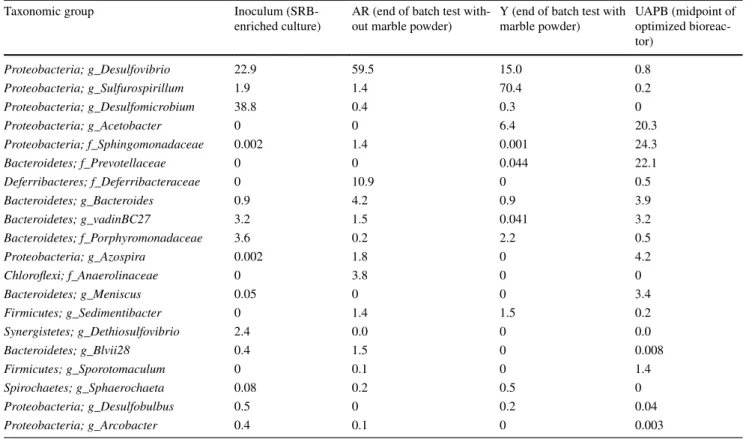
Table 8 The 20 most abundant bacteria in all samples; each bacteria group shows both the classification for the Phylum and the genus (g_) or the family (f_) if genus assignment was not possible
Relative abundances are expressed as a percentage (%)
Taxonomic group Inoculum (SRB-
enriched culture) AR (end of batch test with-out marble powder) Y (end of batch test with marble powder) UAPB (midpoint of optimized bioreac-tor) Proteobacteria; g_Desulfovibrio 22.9 59.5 15.0 0.8 Proteobacteria; g_Sulfurospirillum 1.9 1.4 70.4 0.2 Proteobacteria; g_Desulfomicrobium 38.8 0.4 0.3 0 Proteobacteria; g_Acetobacter 0 0 6.4 20.3 Proteobacteria; f_Sphingomonadaceae 0.002 1.4 0.001 24.3 Bacteroidetes; f_Prevotellaceae 0 0 0.044 22.1 Deferribacteres; f_Deferribacteraceae 0 10.9 0 0.5 Bacteroidetes; g_Bacteroides 0.9 4.2 0.9 3.9 Bacteroidetes; g_vadinBC27 3.2 1.5 0.041 3.2 Bacteroidetes; f_Porphyromonadaceae 3.6 0.2 2.2 0.5 Proteobacteria; g_Azospira 0.002 1.8 0 4.2 Chloroflexi; f_Anaerolinaceae 0 3.8 0 0 Bacteroidetes; g_Meniscus 0.05 0 0 3.4 Firmicutes; g_Sedimentibacter 0 1.4 1.5 0.2 Synergistetes; g_Dethiosulfovibrio 2.4 0.0 0 0.0 Bacteroidetes; g_Blvii28 0.4 1.5 0 0.008 Firmicutes; g_Sporotomaculum 0 0.1 0 1.4 Spirochaetes; g_Sphaerochaeta 0.08 0.2 0.5 0 Proteobacteria; g_Desulfobulbus 0.5 0 0.2 0.04 Proteobacteria; g_Arcobacter 0.4 0.1 0 0.003