Effect of Levabon
®Aquagrow E on the growth
performance and immune response of European seabass
(Dicentrarchus labrax) under stress conditions
Ricardo Miguel Henriques Passos
iii
Effect of Levabon
®Aquagrow E on the growth
performance and immune response of European seabass
(Dicentrarchus labrax) under stress conditions
Ricardo Miguel Henriques Passos
Dissertação para obtenção do Grau de Mestre em Aquacultura
Projeto de Mestrado realizado sob a orientação da Especialista Teresa Baptista,
do Doutor Marco Lemos e da Doutora Sara Novais
v
Effect of Levabon
®Aquagrow E on the growth performance and immune
response of European seabass (Dicentrarchus labrax) under stress
conditions
Copyright © Ricardo Miguel Henriques Passos
Escola Superior de Turismo e Tecnologia do Mar – Peniche
Instituto Politécnico de Leiria
2017
A Escola Superior de Turismo e Tecnologia do Mar e o Instituto Politécnico de Leiria têm o direito, perpétuo e sem limites geográficos, de arquivar e publicar esta dissertação através de exemplares impressos reproduzidos em papel ou de forma digital, ou por qualquer outro meio conhecido ou que venha a ser inventado, e de a divulgar através de repositórios científicos e de admitir a sua cópia e distribuição com objetivos educacionais ou de investigação, não comerciais, desde que seja dado crédito ao autor.
vii
Resumo
A intensificação dos métodos de cultivo em aquacultura está a levar a um abuso dos tratamentos com antibióticos. Isto é motivo para preocupação porque: 1) ocorre o desenvolvimento de bactérias resistentes aos antibióticos; 2) potencia a presença de resíduos de antibióticos na alimentação humana; 3) destrói as populações microbianas nos sistemas de aquacultura; 4) causa imunossupressão nos organismos. Esforços para criar alternativas aos antibióticos e que não sejam danosos para o ambiente resultaram na aplicação de pre- e probióticos. Neste trabalho vão ser avaliados os efeitos do prebiótico comercialmente disponível, Levabon® Aquagrow E (Biomin®, Áustria), no crescimento de
robalos juvenis sob condições de stress, bem como a resposta dos peixes a diferentes agentes causadores de stress.
Para este trabalho, os peixes foram expostos a stress por aumento de densidade, stress por hipoxia ou mantidos em condições controlo (não expostos a stress). Os peixes de cada condição foram submetidos a duas dietas distintas: ração comercial para aquacultura sem suplementação ou a mesma ração, mas com o suplemento de Levabon®
a 6 g Kg-1. Para se atingirem os objetivos propostos foram feitas três amostragens, nas
quais os peixes foram medidos e pesados e amostras de sangue foram obtidas, para avaliação do hematócrito, níveis de cortisol, glicose, fosfatase alcalina (ALP) e atividade bactericida, da lisozima e da peroxidase. Na última amostragem, o fígado e tecido muscular foram extraídos para a avaliação do stress oxidativo.
Peixes alimentados com o prebiótico atingiram melhor crescimento, maiores níveis de glicose e lidaram melhor com os danos do stress oxidativo. O efeito estimulante dos mananoligossacarídeos (MOS) nas bactérias benéficas Bifidobacteria e Lactobacilli poderá ter resultado numa melhor digestão e assimilação dos nutrientes, potenciando o melhor crescimento. O nível de glicose, um bom indicador de stress crónico, apresentou uma tendência para aumentar em peixes alimentados com o suplemento ao longo da experiência, permitindo que possuíssem mais energia para responder às alterações metabólicas causadas pelo stress. O prebiótico também reduziu os danos oxidativos nos lípidos do fígado, causados pelo stress de densidade, bem como os danos no ADN no músculo causados pelo stress de hipoxia. Sendo que este produto atuou positivamente nos pontos-chave de um cultivo aquícola bem-sucedido (melhores taxas de crescimento, melhoria do sistema imune e menos problemas relacionados com o stress), pode-se
viii afirmar que o Levabon® Aquagrow E tem potencial para ser lucrativo quando adicionado
consistentemente à ração.
Palavras-chave: Aquacultura, Densidade elevada, Hipoxia, Mananoligossacarídeo, Prebiótico, Stress oxidativo
ix
Abstract
The intensification of rearing methods in aquaculture, lead to an overuse of antibiotic therapies. This is potentially concerning in several ways: 1) development of antibiotic-resistant bacteria; 2) presence of antibiotic residues in seafood; 3) destruction of microbial populations in aquaculture environments; 4) suppression of the organism’s immune system. Efforts to create an environmental friendly replacement for the antibiotics resulted in the application of pre- and probiotics. This work will evaluate the effects of the commercial prebiotic Levabon® Aquagrow E (Biomin®, Austria) on juvenile European seabass growth
under stressful conditions, and how fish respond to different stressors.
For this work, fish were either exposed to no stress (Control), to stress by crowding or to stress by hypoxia. Each condition had two different diets: commercial aquaculture feed with no supplementation or the same feed with Levabon® supplementation of 6 g Kg-1. To
achieve the proposed objectives, three samplings were performed, on which the fish were measured and weighed, and blood samples were taken for hematocrit, cortisol, glucose, alkaline phosphatase (ALP), and lysozyme, peroxidase and bactericidal activity. At the final sample, liver and muscle tissue were also collected for oxidative stress biomarkers evaluation.
Fish fed with the prebiotic achieved better growth rates, had higher glucose levels and coped better with oxidative stress damages. The stimulatory effect of mannan-oligosaccharide (MOS) on the beneficial Bifidobacteria and Lactobacilli may have resulted in better digestion and assimilation, ultimately causing increased growth. Glucose levels, a good chronic stress indicator, presented an increasing tendency in fish fed with the supplemented diet by the end of the experiment, meaning they possessed more energy to help them respond to the metabolic changes caused by stress. The prebiotic also reduced the liver lipidic oxidative damages caused by the crowding stress as well as the muscle DNA damages caused by the hypoxia stress. Since this product acted positively in the major aspects of a successful aquaculture rearing process (better growth rates, boosted immune status, and less stress-related issues) it can be said that Levabon® Aquagrow E has the
potential to be profitable when added consistently to the fish feed.
Keywords: Aquaculture, Crowding, Hypoxia, Mannan-oligosaccharide, Oxidative stress, Prebiotic
xi
Table of Contents
1. Introduction ... 1
Aquaculture panorama ... 1
Current production status and tendencies ... 1
Intensification of the rearing methods ... 3
Rearing-related stress and its indicators ... 4
Crowding and hypoxia ... 4
Cortisol, glucose, and alkaline phosphatase (ALP) ... 5
Oxidative stress parameters ... 7
Immune response parameters (Lysozyme, peroxidase, and complement factors) ... 7
Prebiotics in aquaculture ... 9
Examples of prebiotics ... 9
Dicentrarchus labrax as biological model ...10
Aims of the study ...11
2. Materials and Methods ...13
Experimental setup...13
Sampling procedures ...14
Calculations of growth performance ...14
Plasmatic parameters ...15
Cortisol, glucose, and alkaline phosphatase (ALP) ...15
Immunity parameters ...15
Oxidative stress biomarkers ...16
Protein quantification ...17
Lipid peroxidation (LPO) ...17
DNA damage ...18
Catalase (CAT) ...19
Superoxide dismutase (SOD) ...19
Statistical analysis ...19
3. Results ...21
Growth performance ...21
Plasmatic parameters ...23
Immunity parameters ...24
Oxidative stress biomarkers ...26
4. Discussion ...29
5. Conclusions ...35
xiii
Table of Figures
Figure 1. Seafood production from 1950 to 2014, divided by wild catches and aquaculture. Adapted from The State of World Fisheries and Aquaculture, FAO (2016). ... 2 Figure 2. European seabass hematocrit variation throughout the experiment. CT - control; CT + LEV - Control fed with Levabon®; CR - crowding stress; CR + LEV - crowding stress fed with Levabon®; HYP - hypoxia stress; HYP + LEV – hypoxia stress fed with Levabon®. Values displayed as means ± SD (n = 30). Different letters stand for significant differences between treatments for the same time (two-way ANOVA, LSD test, p ≤ 0.05). ...21 Figure 3. European seabass weight (A) and total length (B) variation throughout the experiment. CT - control; CT + LEV - Control fed with Levabon®; CR - crowding stress; CR
+ LEV - crowding stress fed with Levabon®; HYP - hypoxia stress; HYP + LEV – hypoxia
stress fed with Levabon®. Values displayed as means ± SD (n = 30). Different letters stand
for significant differences between treatments for the same time (two-way ANOVA, LSD test, p ≤ 0.05). ...22 Figure 4. European seabass condition index variation throughout the experiment. CT - control; CT + LEV - Control fed with Levabon®; CR - crowding stress; CR + LEV - crowding stress fed with Levabon®; HYP - hypoxia stress; HYP + LEV – hypoxia stress fed with Levabon®. Values displayed as means ± SD (n = 30). Different letters stand for significant differences between treatments for the same time (two-way ANOVA, LSD test, p ≤ 0.05). ...22 Figure 5. European seabass plasma cortisol (A) and glucose (B) variation throughout the experiment. CT - control; CT + LEV - Control fed with Levabon®; CR - crowding stress; CR
+ LEV - crowding stress fed with Levabon®; HYP - hypoxia stress; HYP + LEV – hypoxia
stress fed with Levabon®. Values displayed as means ± SD (n = 30). Different letters stand
for significant differences between treatments for the same time (two-way ANOVA, LSD test, p ≤ 0.05). ...24 Figure 6. European seabass alkaline phosphatase variation throughout the experiment. CT - control; CT + LEV - Control fed with Levabon®; CR - crowding stress; CR + LEV - crowding
stress fed with Levabon®; HYP - hypoxia stress; HYP + LEV – hypoxia stress fed with
Levabon®. Values displayed as means ± SD (n = 30). Different letters stand for significant
differences between treatments for the same time (two-way ANOVA, LSD test, p ≤ 0.05). ...24 Figure 7. European seabass plasma peroxidase (A) and lysozyme (B) activities throughout the experiment. CT - control; CT + LEV - Control fed with Levabon®; CR - crowding stress;
CR + LEV - crowding stress fed with Levabon®; HYP - hypoxia stress; HYP + LEV – hypoxia
stress fed with Levabon®. Values displayed as means ± SD (n = 30). Different letters stand
for significant differences between treatments for the same time (two-way ANOVA, LSD test, p ≤ 0.05). ...25 Figure 8. European seabass plasma bactericidal activity throughout the experiment. CT - control; CT + LEV - Control fed with Levabon®; CR - crowding stress; CR + LEV - crowding
xiv Levabon®. Values displayed as means ± SD (n = 30). Different letters stand for significant
differences between treatments for the same time (two-way ANOVA, LSD test, p ≤ 0.05). ... 26 Figure 9. European seabass liver (A) and muscle (B) lipid peroxidation (LPO) levels after the 10th week experiment. Values displayed as means ± SD (n = 15). Different letters stand
for significant differences between treatments (one-way ANOVA, Tukey test, p ≤ 0.05). . 26 Figure 10. European seabass liver (A) and muscle (B) DNA damaged after the 10th week
experiment. Values displayed as means ± SD (n = 15). Different letters stand for significant differences between treatments (one-way ANOVA, Tukey test, p ≤ 0.05). ... 27 Figure 11. European seabass superoxide dismutase - SOD (A) and catalase (B) activities after the 10th week experiment. Values displayed as means ± SD (n = 15). Different letters
stand for significant differences between treatments (one-way ANOVA, Tukey test, p ≤ 0.05). ... 27
xv
Table of Tables
Table I. Growth performance parameters (DGI – daily growth index; FCR – feed conversion ratio; VFI – Voluntary feed intake; ICF – Initial condition factor; FCF – Final condition factor) of European seabass. Values displayed as means ± SD (n = 30). p-values from one-way ANOVA, multiple comparisons test (p ≤ 0.05). Different letters stand for significant differences between treatments. ... 23
xvii
Table of Abbreviations
ALP – Alkaline phosphatase BW – Body weight
CAT – Catalase CF – Condition factor DGI – Daily growth index EU – European Union
FAO – Food and Agriculture Organization of the United Nations FCR – Feed conversion ratio
FEAP – Federation of European Aquaculture Producers FOS – Fructo-oligosaccharide
GPx – Glutathione peroxidase GSH – Glutathione
LPO – Lipid peroxidation
LSD – Least Significant Difference MDA – Malondialdehyde
MOS – Mannan-oligosaccharides OD – Optic density
PMS – Post-mitochondrial supernatant ROS – Reactive oxygen species SDS – Sodium dodecyl sulfate SOD – Superoxide dismutase TBA – Thiobarbituric acid TCA – Trichloroacetic acid TL – Total length
TOS – Transgalacto-oligosaccharide VFI – Voluntary feed intake
1
1. Introduction
Aquaculture panorama
Current production status and tendencies
It is estimated that by 2050 world population have grown to the 9 billion people mark (FAO, 2016), and in a context of social, economic and environmental uncertainty, it will be of major importance to have a steady income of quality protein to feed the increasing population. The seafood consumption is rising all around the globe, from 9.9 kg per capita in the 1960 decade to 16.7 kg in the 2000’s (Teletchea and Fontaine, 2014) and it is seen as a healthy choice to include in people’s diets. Furthermore, the inclusion of fish in the diet over other animal products has its advantages, due to the low levels of saturated fatty acids and cholesterol and their high content in polyunsaturated fatty acids, fish products may help reduce public health issues that are on the rise, such as cardiovascular diseases and obesity (Raatz et al., 2013).
However, even though most of the seafood consumed comes from the fisheries industry, the volumes landed have stagnated since the end of the 1980’s decade (Teletchea and Fontaine, 2014; FAO, 2016). This fact represented an opportunity for the development of the aquaculture industry. Since the 1970’s, aquaculture has provided an ever-increasing quantity of the global seafood production (Figure 1). In 2013 and 2014, more than half of the seafood produced was originated by aquaculture. Finfish harvested from aquaculture in 2014 reached 49.8 million tons (FAO, 2016). These data suggest that the aquaculture production rates have yet plenty of capacity to increase, as they are apparently far from stagnating, which makes this industry one of the most promising ways to feed the human population in the near future.
2 Figure 1. Seafood production from 1950 to 2014, divided by wild catches and aquaculture. Adapted
from The State of World Fisheries and Aquaculture, FAO (2016).
Despite the fact that global aquaculture production has been growing around 7% per year, Europe’s overall production has been very constant since 2000 (Alexander et al., 2015). Hofherr et al. (2015) concluded that in the EU, freshwater and mollusks production is stagnating and marine aquaculture is growing at a much lower rate than in the rest of the world (4%). Same authors claim that in 2011 Europe only produced 1.5% of the global aquaculture production and that Europe could only produce 35% of its seafood demand, whereas the other 65% is imported.
There are several known constraints for this lack of large-scale growth in European aquaculture such as shortage of areas with optimal conditions and ecological concerns on the already occupied sites (Kaiser and Stead, 2002; Simard et al., 2008; Alexander et al., 2015). Additionally, most of the finfish species produced in the EU are carnivorous. The top six most cultured fish species in Europe are Atlantic salmon (Salmo salar), rainbow trout (Oncorhynchus mykiss), gilthead seabream (Sparus aurata), European seabass (Dicentrarchus labrax), common carp (Cyprinus carpio), and turbot (Scophtalmus maximus) (Janssen et al., 2016). Of all these species, only the common carp is exclusively herbivore. The rest, due to their diets, have a much higher production cost than many species produced in other continents such as higher volumes of carp, Pangasius, and tilapia. A possible solution to improve Europe’s aquaculture production volumes could be a diversification of the species reared, including some from a lower trophic chain level (Mylonas and Robles, 2014). However, the main obstacle to this modification might very well be the acceptance from the consumers, who might take some time to get accustomed to this new seafood offer.
3 The areas around the Mediterranean Sea are some of the most explored for aquaculture production in Europe, as more than 15 euryhaline marine fish species are currently reared in this basin (Arechavala-Lopez et al., 2013). A large part of the European finfish production consists of European seabass and gilthead seabream (Vendramin et al., 2016). In 2014, the Mediterranean countries produced a total of 148,367 tons of seabass and 146,467 tons of seabream (FEAP, 2015; Vendramin et al., 2016).
In order to import less seafood and strengthen European economy and aquaculture industry it is imperative to improve the aquaculture-produced volumes in the EU, however the lack of usable space might force the intensification of the currently explored locals. The effects of the intensive practices in the surrounding areas to the installations are yet to be fully documented (Farmaki et al., 2014), opposing to the issues concerning the intensive rearing practices, which are much more recognized and dealt with, following the technological developments.
Intensification of the rearing methods
The human population increment puts pressure on the food primary industry, forcing it to keep up with the increasing demand. In aquaculture, the intensification of the rearing methods is deemed to produce higher volumes of seafood. This means that not only the biomass cultured needs to be higher, but also the culture procedures need to be adapted in order to maintain the animal’s growth and well-being under such conditions. Since aquaculture expansion is restrained by spatial requirements, intensive systems aim to produce fish at densities as high as 30 kg.m-3 (Hu et al., 2014).
In intensive cultures, fish are exposed to a series of situations and interactions that are abnormal comparing to what they would encounter in the wild. Temperature changes, manipulation of the photoperiod, salinity, transport, handling, crowding, and hypoxia are environmental or man-made factors that cause stress and induce immune suppression (Sommerset et al., 2005), which could prevent the treatments of some diseases since immune suppression is a limiting factor for a vaccine (Bly et al., 1997). Animal health-related issues are still one of the main obstacles for the aquaculture industry and its profitability. Environmental conditions that induce stress can be the cause of some negative effects in a variety of physiological functions of teleost fishes, such as the immune responses related to the neuroendocrine system (Faisal et al., 1989; Vazzana et al., 2002). Furthermore, the increased density promotes the proximity and contact between the
4 animals, which will favor the potential disease outbreaks and propagation of the pathogenic agent throughout the rearing area.
Bostock et al. (2010) defended that the tendency towards enhanced intensive systems will remain in the near future and that it will help in the supply of animal food for human consumption. Consequently, industry and science are challenged to find new ways to optimize the intensive aquaculture, reducing the risks and increasing the profits. The development of new products and mechanisms or the improvement of already existing technologies may be key factors to increase the production volumes. Nutrition is also a component that requires special attention, since higher quality diets containing fish meal and fish oil are required for most intensive fish aquaculture (Bostock et al., 2010).
Rearing-related stress and its indicators
Crowding and hypoxia
In aquaculture industry, the need to intensify farm’s production leads to a series of challenges that will interfere with the animals reared well-being. High density or crowding is considered a common fish stressor in intensive aquaculture, and it may cause poor growth and food efficiency, which translates into unhealthy fish (Salati et al., 2016). In the case of hypoxia, its effects are dependent of the status of the affected fish (e.g.: type of swimming, digestion, other stressors), which will determine the need for oxygen (Bardon-Albaret and Saillant, 2016). Agents of stress like the ones mentioned, weaken the immune system and cause the appropriate environment to disease proliferation.
To obtain the biomass required to run an intensive aquaculture, it is guaranteed that crowding stress is ought to occur, either simply due to the high densities or to other farming procedures that include condensing the animals in a single area, such as fishing. Crowding may have more harmful consequences than the ones previously mentioned. In tilapia Oreochromis niloticus, short-term high density has been shown to enhance utilization of organisms’ serum glucose, triglyceride and cholesterol, causing liver damage, and increasing serum cortisol, which leads to physiological imbalances (Jun et al., 2013). Also, in other studies crowding have shown the capacity to cause immunosuppression in gilthead seabream S. aurata (Sunyer et al., 1995; Tort et al., 1996), when submitted to constant and repeated acute stress.
5 Another particularity of intensive systems, is that the average air supply in these cases may not be effective to aerate the water at the same time that the fish are consuming the oxygen. Since water can only contain a few milligrams of oxygen per liter, it can be very quickly depleted by aerobic organisms, particularly in environments rich in nutrients with large microbial biomass or in areas with weak currents and low vertical mixing (Domenici et al., 2013). In marine environments, 2.8 mg dissolved oxygen (DO) L-1 is considered to be
the benchmark for hypoxic conditions (Wu, 2002). However, hypoxia may be better characterized by the oxygen saturation level, since the availability of oxygen is dependent of other parameters, such as water temperature and salinity (Chabot and Claireaux, 2008).
As for crowding stress, low oxygen levels are also limiting for the growth rate, feed efficiency, and fish metabolism (Pichavant et al., 2000). Lumpfish Cyclopterus lumpus, showed reduced appetite and growth rate under hypoxic conditions, along with indications of stress induction given by the elevated plasma cortisol levels registered (Jørgensen et al., 2017). However, due to their different life styles and metabolisms, not every species experience the same effects of lack of oxygen, as for instance turbot (Scophthalmus maximus) exposed to moderate hypoxia, which showed no signs of stress (Pichavant et al., 2000).
Cortisol, glucose, and alkaline phosphatase (ALP)
Stress is a condition in which the dynamic balance of homeostasis is disturbed, because of intrinsic or extrinsic stimuli, defined as stressors (Chrousos and Gold, 1992; Sjoerd and Bonga, 1997). Consequently, it has a deep effect on the fish’s physiological states and it is responsible for, among others, low growth rates and mortality. In aquaculture, this may cause a serious negative impact on the income and therefore, in order to reduce these losses, the acknowledgment of the stressors, the stress levels and fitness outcomes are of utmost importance (Husen and Sharma, 2014).
The main stress indicator in teleosts is the cortisol level, usually providing some information about the severity and duration of the stress response (Tsalafouta et al., 2015). Cortisol is produced as a result of the fish primary response to the stressor, regulated through the activation of the hypothalamic-pituitary-interrenal axis (Tsalafouta et al., 2015). A few minutes after the exposure to an acute stress, plasma cortisol levels quickly reach their peak, returning to normal concentrations after several hours, whereas if the stress is chronical, this hormone plasma level may remain high, although well below its peak
6 concentration (Sjoerd and Bonga, 1997). Even though cortisol takes a role in the hydromineral balance and in energy metabolism, it also reduces the growth rate and suppresses the reproductive and immune functions (Sjoerd and Bonga, 1997), which means that stressed fish populations are not at all desirable in culture systems.
The cortisol response, however, can have large divergences between individuals of the same species (Wang et al., 2004; Hori et al., 2012). This may implicate that not every specimen copes with stress the same way or that there are other factors exerting influence on the basal cortisol levels of each individual. For example, in rainbow trout O. mykiss, cortisol responsiveness has shown moderate to high heritability (Vallejo et al., 2009; Samaras et al., 2016). Also, behavioral differences, animal performance and fitness are associated with the intra and interspecific variation of the intensity and consistency of the cortisol response (Samaras et al., 2016).
The release of cortisol and other stress-related hormones increases the glucose production in fish through gluconeogenesis. Being glucose an important energy substrate, it is defended that glucose production has the aim to assist the fish to cope metabolically with the increased energy demand caused by the stress (Wu et al., 2016). Also, according to Barton and Iwama (1991), high glucose levels may prevent the effects of stress, increasing the concentration of energy and oxygen available to the tissues and brain.
Alkaline phosphatase (ALP) is a hydrolytic zinc-containing metalloenzyme that intervenes in the phosphorus metabolism (Gupta et al., 2014). Increments in ALP activity under stressful situations have been associated to the hydrolysis of high-energy phosphate bonds in order to liberate phosphate ions to combat the stress condition or higher metabolic rate (Gupta et al., 2014). Sadhu et al. (2014) reported that the increased alkaline phosphatase activity in Asian seabass Lates calcarifer, held in high density could be caused by the lysosomal labilisation triggered by stress. High levels of ALP activity post-stress period in Atlantic cod subjected to short-term crowding were also recorded (Caipang et al., 2009). Even though ALP has been classified as a potential stress indicator, defending against pathogens and acting in the healing of superficial wounds in fish (Ross et al., 2000), its role in the metabolic stress response is still unclear.
7
Oxidative stress parameters
Every aerobic organism is confronted with reactive oxygen species (ROS), which are free radicals associated with the oxygen atom. ROS are naturally forming by-products of the oxygen metabolism, playing a part in cell signaling and homeostasis (Toyokuni, 1999; Vinagre et al., 2012). Normally, ROS production is even with the antioxidant response, however, if there is a disruption of the metabolism homeostasis the antioxidant response may be affected, causing a dramatic increase and accumulation of ROS. In a context of fish farming, aquaculture practices might induce long-term stressful conditions, resulting in the chronic increase of plasma cortisol level, and subsequently in the induction of a large amount of secondary physiological responses, such as the antioxidant metabolism (Jia et al., 2016). When the formation of ROS is greater than the antioxidant activity, oxidative stress occurs (Mittler, 2002).
The imbalance between pro-oxidant and antioxidant status and its consequences such as DNA damage, lipid peroxidation (LPO), and enzyme inhibition can be assessed through biomarkers that represent early signs of environmental disturbance (Regoli et al., 2004). Changes in antioxidant defenses and oxidative damage are used as biomarkers of oxidative stress (Livingstone, 2001). In fish, as in all other aerobic organisms, antioxidant enzymes (superoxide dismutase - SOD, glutathione peroxidase - GPx and catalase - CAT) and nonenzymatic antioxidant components like glutathione (GSH) are some of the strongest defensive mechanisms against ROS (Jia et al., 2016). Specifically, in aquaculture context, coping with long-term oxidative stress will compromise the growth performance (Leal et al., 2011), due to the relocation of the energetic necessities, as well as animal welfare and causing a negative impact on the profit (Peixoto et al., 2016). As oxidative stress biomarkers can be detected earlier than other noticeable disorders, such as disease or mortality, being a warning to the stressors impact (Ameur et al., 2012), they could be used as tools to keep the reared populations healthy, and ultimately, increasing the revenues.
Immune response parameters (Lysozyme, peroxidase, and complement factors)
The innate immune system is phylogenetically older than the adaptive immune system and is present in all multicellular organisms (Saurabh and Sahoo, 2008). This type of immunity is the host’s first line of defense against a broad spectrum of pathogens, while the adaptive immune system is more specific to reoccurring infections by a previous invasive pathogen (Saurabh and Sahoo, 2008).
8 Fish and other aquatic animals rely more on the innate immune system to defend themselves against pathogenic agents than other vertebrates, since they possess a more complex innate immune system which has different mechanisms that act against several pathogens (Yarahmadi et al., 2015). This is due to the constant interaction between fish and microorganisms in the aquatic environments, which demonstrated that the fish’s defense mechanisms evolved to ensure their survival (Subramanian et al., 2007). Also, due to its earliest evolution, fish depend mostly on the innate immune system (Saurabh and Sahoo, 2008).
When there is a bacterial infection on the organism, which is common in aquaculture, the immune response is triggered. This is characterized by an influx of phagocytic cells to the infection site that will produce bactericidal substances such as lysozyme, complement factors, and anti-protease compounds (Ellis, 2001; Machado et al., 2015). However, under stressful conditions, specific and nonspecific immunity is affected, exposing the fish to a range of opportunistic pathogens (Yarahmadi et al., 2015). So, the innate immune responses can be used to monitor fish health condition, analyzing lysozyme, peroxidase, and complement systems (Peixoto et al., 2016), that protect fish against several pathogenic agents (Sunyer & Tort, 1995; Tort et al., 1996).
Lysozyme is, most likely, the strongest bacteriolytic protein, due to its ability to cleave the bactericidal peptidoglycan (Guardiola et al., 2014). Lysozyme’s activity differs from species to species, defending the hypothesis of differential fish resistance to bacteria, as well as the bacterial abundance and diversity in each species environment (Guardiola et al., 2014). Stress can also be a factor that influences this enzyme activity, following different parameters such as the degree of stress, its intensity and duration as well as the type of stressors (Yildiz, 2006; Saurabh and Sahoo, 2008). Some research has been done regarding lysozyme activity in stressed fish, however the results are not very consistent. The plasma lysozyme activity of Nile tilapia (Oreochromis niloticus) subjected to stress by social pressure was lower than for unstressed individuals (Caruso and Lazard, 1999), however, in rainbow trout, lysozyme activity was significantly increased in fish subjected to handling (Demers and Bayne, 1997; Saurabh and Sahoo, 2008). These examples strengthen the idea that different stressors with different origins and different intensities will not affect fish in the same way.
9 Peroxidase is an enzyme, mostly produced by the azurophilic granules of neutrophils, that uses oxidative radicals to produce hypochlorous acid, in order to neutralize pathogens (Nayak, 2010). In previous studies, this enzyme showed a significant increase in S. aurata (Cuesta et al., 2006) and Diplodus puntazzo (Muñoz et al., 2007) acutely exposed to the parasite Enteromyxum leei, however in S. aurata the peroxidase levels decreased when the exposure became chronical (Cuesta et al, 2006; Sitjà-Bobadilla et al., 2008; Alvarez-Pellitero, 2008).
Prebiotics in aquaculture
Some studies suggest that prebiotics and probiotics are the leading candidates for environmental friendly feed additives in the aquaculture industry, which may serve several purposes, such as to control potential pathogens, have a beneficial effect on immune status, gut microbiota, feed efficiency, growth performance, and protecting general fish health (Nogami and Maeda, 1992; Gaggia et al., 2010; Carbone and Faggio, 2016). Gibson and Roberfroid (1995) defined prebiotics as “non- digestible food ingredients that beneficially affect the host by selectively stimulating the growth and/or activity of a limited number of bacterial species already resident in the colon and thus attempt to improve host health”.
Prebiotics administration is one of the leading techniques to replace the antibiotic usage in aquaculture, due to its potential development of antibiotic-resistant bacteria, the presence of antibiotic residues in seafood, destruction of microbial populations in aquaculture environments, and the suppression of the animal’s immune system (Ringø et al., 2010).
When beneficial bacteria, present in the gastrointestinal tract, ferment prebiotics, the by-products of the reaction will be used to improve the host health (Choque-Delgado et al., 2011). So, applying prebiotics that modify the gastrointestinal conditions in order to favor certain bacterial species that may enhance growth efficiency and reduce the susceptibility to pathogens of the host organism seems to be a very promising way to develop the industry (Ringø et al., 2010).
Examples of prebiotics
Among all the substances that may be considered prebiotics according to the aforementioned definition, some of the more common are fructo-oligosaccharide (FOS),
10 transgalacto-oligosaccharide (TOS), inulin (Burr et al., 2005), and mannan-oligosaccharides (MOS) (Merrifield et al., 2010).
MOS are glucomannoprotein-complexes existent in Saccharomyces cerevisae cell wall whose application is not very well documented, since it has only been used for around a decade (Merrifield et al., 2010). However, studies by Staykov et al. (2007) were able to show an improvement in the growth performance and in immune parameters, as well as a decrease in mortality of rainbow trout fed with MOS as supplement. Similar results were obtained by Rodriguez-Estrada et al. (2009) including an increase in survival rates when the fish were challenged with Vibrio anguillarum.
An example of commercial MOS is the product Levabon® Aquagrow E, which is
produced using a standardized autolytic degradation of the yeast cell (S. cerevisae) and spray drying. It is rich in bioactive components and nutrients as essential amino acids, peptides, cell wall carbohydrates, nucleotides, and B vitamins. This product, also considered an immunomodulator, is described by the company (Biomin®, Austria) as a
promising substance to improve disease resistance by regulating the host defense mechanisms against opportunistic pathogens.
Up until this moment there are not many published studies analyzing Levabon®
Aquagrow E efficiency as a feed additive for intensive rearing farms. Batista et al. (2016) evaluated the effect of feeds with high plant ingredient content supplemented with Levabon®
Aquagrow E in the growth performance, innate immune response, intestine morphology, and microbiota diversity in Senegalese sole (Solea senegalensis), concluding that it is possible to manipulate the gastrointestinal tract microbiota of sole even when Vibrio sp. are the predominant bacteria. Diets with the autolyzed yeast cell reduced the Vibrio amount. However, fish growth performance was reduced and there were no clear health benefits associated with the addition of the prebiotic. Therefore, it is important to perform further studies to clearly assess the effects of this product on growth performance and in the well-being of fish.
Dicentrarchus labrax as biological model
The biological model for this work is the European seabass (D. labrax), which is a euryhaline (0 ppt to hypersaline condition) and eurythermal (5 to 28°C) teleost fish (Alix et
11 al., 2017). Its distribution is mainly in the Eastern Atlantic Ocean, from Norway to Morocco, and is also present in the Mediterranean and Black seas (Kottelat and Freyhof, 1972).
This species is one of the most exploited for aquaculture purposes in southern Europe (Lamari et al., 2016), making up to 20% of the total fish farmed in the Mediterranean (Carbone and Faggio, 2016). However, the seabass is very susceptible to stressors and pathogens, which occasionally causes some great losses (Izquierdo, 2005).
This sensitivity might be related to the cortisol levels in this species plasma, since this hormone is naturally present in high concentrations, in contrast with other teleost such as gilthead seabream, red seabream, red porgy, rainbow trout, and tilapia (Fatira et al., 2014). Plus, it is sensitive to drastic abiotic variations in its environment, for instance a decrease in the oxygen levels. During the seabass rearing, dissolved oxygen could be an issue, as oxygen concentrations below 3.5 mg. L-1 reduces growth and causes mortality
(Besson et al., 2016).
Even so, some measures may be taken to compensate or avoid the bottlenecks and constraints of this species rearing processes, such as the supplementation of the feeds with prebiotics and immunostimulants. European seabass has been proven to have boosted resistance against stress and disease when fed with high MOS inclusion levels, and the phagocytic activity of head kidney macrophages against Vibrio alginolyticus was also improved (Torrecillas et al., 2011).
Aims of the study
This work has the purpose to evaluate the effect of the commercial prebiotic Levabon® Aquagrow E (Biomin®, Austria) on the juvenile European seabass under
aquaculture rearing methods conditions. This objective can be separated into two different approaches: 1) to assess fish growth under stress conditions when fed with the prebiotic; and 2) to investigate the capacity of the organisms to respond when confronted with different stressors, with and without the prebiotic supplementation.
To complete these objectives different parameters were analyzed, namely the hematocrit, glucose, cortisol, and alkaline phosphatase plasma levels, as well as the measurement of oxidative stress biomarkers. The immune status was evaluated by the
12 activity of the plasma enzymes, lysozyme, and peroxidase, and the bactericidal activity of the plasma.
With both approaches combined, this work aims to provide some concrete indications on the actual effectiveness of the commercial prebiotic Levabon® Aquagrow E
as a feed supplement to be introduced in fish farms, and to evaluate its potential to help surpass some of the major issues of the current aquaculture industry.
13
2. Materials and Methods
The current study was conducted under the supervision of an accredited expert in laboratory animal science by the Portuguese Veterinary Authority (following FELASA category C recommendations), according to the guidelines on the protection of animals used for scientific purposes from the European Directive 2010/63/EU.
Experimental setup
The experiment took place at the CETEMARES building (Peniche, Portugal). Fish were obtained from a commercial fish farm (MARESA, Spain) and transported to the research center. After two weeks of acclimation, fish were randomly distributed into eighteen aquaria of 60 L, organized in six systems of three replicate aquaria: Treatment 1 – Control; Treatment 2 – Control and feed supplemented with Levabon®; Treatment 3 –
Crowding stress; Treatment 4 - Crowding and feed supplemented with Levabon®;
Treatment 5 – Hypoxia stress; Treatment 6 – Hypoxia and feed supplemented with Levabon®. Each system was supplied by a recirculation system with UV light. The
supplement concentration was 6 g Kg-1 of feed. Fish were daily hand-fed three meals (9:00
am, 1:00 pm, and 4:00 pm) to apparent satiety based on visual observation of acceptance. The experiment lasted for ten weeks and three samplings were performed during this period (first day, fifth week, and last day).
Fish were reared at a density of 4.83 kg m-2 (25 fish per aquarium with a mean initial
body weight of 11.67 ± 2.96 g), with the following conditions monitored throughout the experiment: salinity (34 ± 2 PSU), temperature (19.6 ± 0.4°C), ammonia (≤ 0.5 mg. L-1),
nitrites (≤ 3 mg. L-1), dissolved oxygen (7.01 ± 0.17 mg. L-1) above 90% saturation level, pH
(7.5 ± 0.3), photoperiod (12h light/12h dark), and flow rate (6.6 L. min-1).
The stress challenges were applied three times a week, on the required treatments. Crowding consisted of brief crowding of fish in one of the aquarium sides (60 seconds). A rectangular-shaped division with 5 mm holes, to allow water to flow through, was used in order to reduce the available volume to half of it. For the hypoxia challenge, aeration on the system was removed and dissolved oxygen was monitored until reaching a value of ≈ 3.5 mg O2 L-1 (no more than 60 minutes in total). After achieving the oxygen target value,
14 Organisms were not given the last feeding time (4:00 pm) in the day prior to the challenges and also the first feeding time (9:00 am) in the challenge days.
Sampling procedures
The fish were fasten for 24 h before each sampling and then anaesthetized before being manipulated, with a dose of 2-phenoxyethanol (0.5 ml. L-1). All fish were individually
weighed and measured at day 1, at the 5th week and at the end of the experiment (10th week) in order to determine growth performance.
Fifteen fish from the initial stock at day 1 and 10 fish from each aquarium in the middle and final sampling were blood sampled with heparinized syringes. The blood was centrifuged at 3000 x g for 7 min at 4°C to collect the plasma. Prior to plasma extraction, a sub-sample of blood was placed into a micro hematocrit capillary tube (75 mm Super Rior, Germany). The samples were then spun in a centrifuge at 10000 x g for 10 min for hematocrit determination.
Plasma was stored at -20°C for cortisol, alkaline phosphatase, glucose levels, and humoral innate immune parameters (lysozyme, peroxidase and bactericidal plasma activities). At the end of the experiment, five fish per aquarium were also sacrificed for organ extraction to evaluate the oxidative stress biomarkers in liver and muscle tissues. The tissues were kept at -80°C until further analysis.
Calculations of growth performance
Body weight (BW) and total length (TL) were measured in order to obtain, the following parameters:
1) Condition factor (CF), calculated as: 𝐶𝐹 = 𝐵𝑊 (𝑔)
𝑇𝐿3(𝑐𝑚) × 100
2) Feed conversion ratio (FCR) calculated as: 𝐹𝐶𝑅 = 𝑑𝑟𝑦 𝑓𝑒𝑒𝑑 𝑖𝑛𝑡𝑎𝑘𝑒 (𝑔)
𝑤𝑒𝑡 𝑤𝑒𝑖𝑔ℎ𝑡 𝑔𝑎𝑖𝑛 (𝑔)
15 𝐷𝐺𝐼 = [(𝑊113) − (𝑊0 1 3) ] 𝑑𝑎𝑦𝑠 × 100
Where W0 and W1 are the initial and the final fish mean weights in grams and days is the trial duration.
4) Voluntary feed intake (VFI) (% BW day-1) was calculated as:
𝑑𝑟𝑦 𝑓𝑒𝑒𝑑 𝑖𝑛𝑡𝑎𝑘𝑒 (𝑔) 𝑎𝑣𝑒𝑟𝑎𝑔𝑒 𝐵𝑊 (𝑔)
𝑑𝑎𝑦𝑠 × 100 Where average BW was calculated as:
𝑊1 + 𝑊0 2
Plasmatic parameters
Cortisol, glucose and alkaline phosphatase (ALP)
All blood biochemical analyses were carried in duplicate. Plasma cortisol was measured by IBL INTERNATIONAL (Hamburg, Germany) ELISA kit (Ref. RE52061). Plasma glucose was assayed using the commercially available QCA (Spain) glucose kit (Ref. 998660) based on the sequential reactions from glucose oxidase (GOD) and peroxidase (POD). All measurements were taken using a microplate reader Synergy H1 Hybrid Reader (Biotek; Winooski, USA). ALP was determined using a clinical diagnostic Spinreact kit (Ref. 200041246) and read in Thermo Fisher Scientific (Waltham, USA) Evolution 201 UV-Visible Spectrophotometer.
Immunity parameters
These analyses were performed at CIIMAR facilities (Matosinhos, Portugal). All measurements were done in triplicates. Plasma lysozyme activity (EU. mL-1) was
determined using a turbidimetric assay described by Costas et al. (2011). Briefly, a suspension of Micrococcus lysodeikticus (0.5 mg. mL-1, 0.005 M sodium phosphate buffer,
pH 6.2) was prepared. In a microplate, 15 µL of plasma and 250 µL of the bacterial suspension were added. The reaction occurred at 25°C and the absorbance was measured at 450 nm, after 0.5 and 4.5 min in a Synergy HT (BioTek; Winooski, USA) microplate reader. The standard curve was performed using lyophilized hen egg white lysozyme (Sigma, USA) serially diluted in sodium phosphate buffer (0.05 M, pH 6.2). The lysozyme present in the sample was calculated using the formula of the standard curve.
16 Plasma peroxidase activity was determined using the procedure described by Quade and Roth (1997). In short, 15 µL of plasma were diluted in 135 µL of HBSS without Ca+2 and Mg+2 in flat-bottomed 96-well plates. After that, 50 µL of 20 mM
3,3’,5,5’-tetramethylbenzidine hydrochloride (TMB; Sigma, USA) were added. The color-change reaction was stopped after 2 min by adding 50 µL of 2 M sulfuric acid and the absorbance was measured at 450 nm in a Synergy HT (BioTek; Winooski, USA) microplate reader. Wells without plasma were used as blanks. Peroxidase activity (units. mL-1 plasma) was
calculated by defining one unit of peroxidase as the amount needed to produce an absorbance change of 1 OD (optical density).
To assess the plasma’s bactericidal activity, Photobacterium damselae subsp. piscicida (Phdp) strain PP3 were cultured at 22°C in tryptic soy broth (TSB) supplemented with NaCl to a final concentration of 1% (w/v). Stocked bacteria were cultured overnight at 22°C, with continuous shaking (100 rpm). Exponentially growing bacteria were collected by centrifugation at 3500 x g for 30 min, resuspended in sterile HBSS and adjusted to 1 x 10⁶
colony forming units (cfu). mL-1 according to Costas et al. (2013). Plasma bactericidal
activity was then determined following the method of Graham et al. (1988) with some modifications (Machado et al., 2015).
Briefly, 20 µL of plasma were added to the wells of a U-shaped 96-well plate. HBSS was added to some wells instead of plasma to work as positive control. 20 µl of Phdp (1 x 10⁶ cfu. mL-1) were added to each well and the plate was incubated for 2.5 h at
25 °C. Afterwards, 25 µl of 3-(4,5-dimethyl-2-yl)-2,5-diphenyl tetrazolium bromide (1 mg. mL-1; Sigma, USA) were added to each well and incubated for 10 min at 25°C to allow the
formation of formazan. Plates were then centrifuged at 2000 x g for 10 min and the precipitate was dissolved in 200 µl of dimethyl sulfoxide (Sigma; St. Lois, USA). The absorbance of the dissolved precipitate was measured at 560 nm in a Synergy HT (BioTek; Winooski, USA) microplate reader. Bactericidal activity is expressed as percentage calculated from the difference between bacteria surviving compared to the number of bacteria from positive control (100%).
Oxidative stress biomarkers
The oxidative stress related parameters were measured in samples of homogenized liver or muscle extracted from the seabass at the end of the experiment. The tissues were
17 homogenized in a proportion of 1:10 (m:v) of K-Phosphate 0.1 M, pH 7.4 (KH2PO4 0.1 M
and K2HPO4 0.1 M) buffer. Two aliquots of liver homogenate were made: 1) 150 µL plus 2.5
µL of butylated hydroxytoluene (BHT) for lipid peroxidation measurement; 2) 50 µL for DNA damage measurement. The rest of the homogenate was centrifuged at 10000 x g for 20 minutes (4°C) and the post-mitochondrial supernatant (PMS) was also divided in aliquots of 300 µL for CAT and SOD measurements and 50 µL for protein quantification. The muscle homogenate was solely divided in aliquots for lipid peroxidation and DNA damage measurements, similarly to liver tissue. Every microtube was kept at -80°C until further analysis. All measurements were done in triplicates, except for DNA damage, which was performed in quadruplicates. For all oxidative stress parameters, reaction blanks were performed adding K-Phosphate buffer 0.1M (pH 7.4) instead of the sample.
Protein quantification
For the protein quantification, the Bradford’s (1976) method was followed, set up in a 96-well flat bottom plate. A standard curve was obtained from four different γ-globulin dilutions with a stock concentration of 1 mg. mL-1. The dilutions were 0 mg. mL-1,
0.2 mg. mL-1, 0.5 mg. mL-1 and 1 mg. mL-1.
For the measurements, 10 µL of either the standard curve dilutions or the samples, from liver and muscle, were added to the wells, and then 290 µL Biorad (Hercules, USA) Bradford Protein Assay diluted with ultra-pure water (1:5) were added. The plate was incubated for 15 minutes and then the absorbance was read at 600 nm in an EPOCH 2 (BioTek; Winooski, USA) microplate reader. The optimal sample dilution was obtained performing several sample dilutions and evaluating which one was within the absorbance read in the standard curve.
Lipid peroxidation (LPO)
LPO was measured following the principle that, under oxidative stress in the cellular environment, unstable lipid hydroperoxides derived from polyunsaturated fatty acids decompose. This results in the formation of malondialdehyde (MDA), which can be quantified through its controlled reaction with thiobarbituric acid (TBA) under high temperatures and acidic conditions.
18 To the 150 µL muscle homogenate, 250 µL of cold trichloroacetic acid (TCA) 12 % were added, along with 200 µL of Tris-HCl 60 mM with DTPA 0.1 mM and 250 µL of TBA 0.73%. For the 150 µL liver samples, the solutions’ volumes were doubled.
Samples were then placed at 100°C for 60 minutes, centrifuged for 5 minutes at 12000 x g (25°C) (Eppendorf 5415 R; Hamburg, Germany) and 200 µL of supernatant were transferred to a microplate (in triplicates). The absorbance was read at 535 nm in an EPOCH 2 (BioTek; Winooski, USA) microplate reader. LPO levels were calculated and expressed in nmol TBARS per g of ww using the TBA molar extinction coefficient at 535 nm of 1.56 × 10⁵ M.cm-1.
DNA damage
Damages inflicted to the DNA strands were measured using the alkaline precipitation assay, described by Olive (1988). This method is based on the assumption that the sodium dodecyl sulfate (SDS) associated nucleoproteins and genomic DNA precipitation, leaves the damaged DNA in the supernatant. Damaged DNA can then be labelled with a fluorescent dye and the fluorescence measured using 360:460 nm to excitation/emission wavelength filters.
In sum, to the 50 µL of homogenized muscle were added 250 µL of SDS (2 %) containing 50 mM of NaOH, 10 mM of Tris and 10 mM of EDTA, and 250 µL of KCl (0.12 M). Samples were incubated for 10 minutes at 60 °C, and after that cooled on ice for 15 minutes. The samples were then centrifuged for 5 minutes at 8000 x g (4 °C) (Eppendorf 5415 R; Hamburg, Germany). In a microplate suited for fluorescence readings, 50 µL of either DNA standard (0, 5, 10 and 20 µg. mL-1), blanks or sample supernatants
were added, along with 200 µL of Hoesch dye solution (1 µg. mL-1). The plate was shaken
for 1 minute away from light and the fluorescence was then read using excitation/emission wavelengths of 360/460 nm in a Synergy H1 (BioTek; Winooski, USA) microplate reader. For the liver samples, the process was the same except for the volumes of SDS and KCl added to the sample, which were doubled. Results were expressed as µg of DNA per mg of ww, using calf thymus DNA (Sigma-Aldrich, USA) as standard.
19
Catalase (CAT)
Catalase activity was measured following the consumption of the substrate (H2O2) seen by a decrease in absorbance at 240 nm, as described by Clairborne
(1985), and adapted to a microplate.
In a microplate suited for UV light, 50 µL of liver sample PMS (diluted 100x) was added, along with 100 µL of K-Phosphate 0.05 M, pH 7.4 and 150 µL of H2O2 0.03 M. The
absorbance was read at 240 nm for 1 minute in an EPOCH 2 (BioTek; Winooski, USA) microplate reader. Catalase activity was expressed in µmol/min/mg of protein, using the H2O2 molar extinction coefficient at 240 nm of 40 M.cm-1.
Superoxide dismutase (SOD)
Superoxide dismutase catalyzes the dismutation of the superoxide radical (O2-) into
H2O2 and O2, acting as a defense mechanism against the toxicity of the superoxide radical.
This method is based on the ability of SOD to inhibit the reduction of cytochrome c by the superoxide anion. As it was described by McCord and Fridovich (1969), the superoxide radical is produced enzymatically by the reaction catalyzed by xanthine oxidase (XOD). The oxidized cytochrome c is reduced by the superoxide radical and the rate of reduction is followed spectrophotometrically at 550 nm. Finally, SOD will inhibit the cytochrome C reduction by competing for the superoxide radical.
A SOD standard curve was prepared from a 30 U. mL-1 stock solution with
concentrations of 0, 0.25, 0.5, 0.75, 1, 1.25 and 1.5 U. mL-1. To each well, 50 µL of either
SOD standard solutions or sample (diluted between 100x and 200x) were added, along with 100 µL of K-phosphate 0.05 M (pH 7.4), 50 µL of xanthine 0.14 mM, 50 µL of cytochrome C 0.06 M and 50 µL of XOD 0.01 U.ml-1. The absorbance was followed at 550 nm for 3
minutes in an EPOCH 2 (BioTek; Winooski, USA) microplate reader. SOD activity was expressed in U. mg-1 of protein, where 1 U represents the amount of enzyme capable of
inhibiting 50% of cytochrome C reduction.
Statistical analysis
Growth performance data, blood and plasma parameters, immune-related enzymes activities and oxidative stress parameters are expressed as means of three replicates ± standard deviation. Data associated to the growth performance experiment, blood and
20 plasma parameters and immune-related enzymes activities were tested for significant differences using a two-way analysis of variance, with sampling time and treatment as factors, followed by multiple comparison using Fisher's Least Significant Difference (LSD) test. Differences in oxidative stress parameters between treatments were assessed by a one-way analysis of variance, whenever assumptions of normality and homogeneity of variance were met. In case of rejection of these assumptions, a Kruskal-Wallis test was performed. For the multiple comparisons, a Tukey’s test was applied. Statistical significance was tested at P < 0.05. All statistical tests were performed using the SPSS software (v21, IBM, USA).
21
3. Results
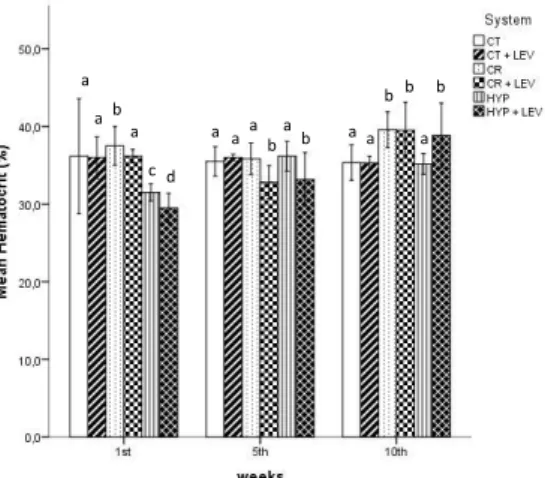
No mortality or signs of disease were observed during the experiment including the acclimation period. The hematocrit showed differences between treatments at all samplings (Figure 2), however a clear pattern was not observed.
Figure 2. European seabass hematocrit variation throughout the experiment. CT - control; CT + LEV - Control fed with Levabon®; CR - crowding stress; CR + LEV - crowding stress fed with
Levabon®; HYP - hypoxia stress; HYP + LEV – hypoxia stress fed with Levabon®. Values displayed as means ± SD (n = 30). Different letters stand for significant differences between
treatments for the same time (two-way ANOVA, LSD test, p ≤ 0.05).
Growth performance
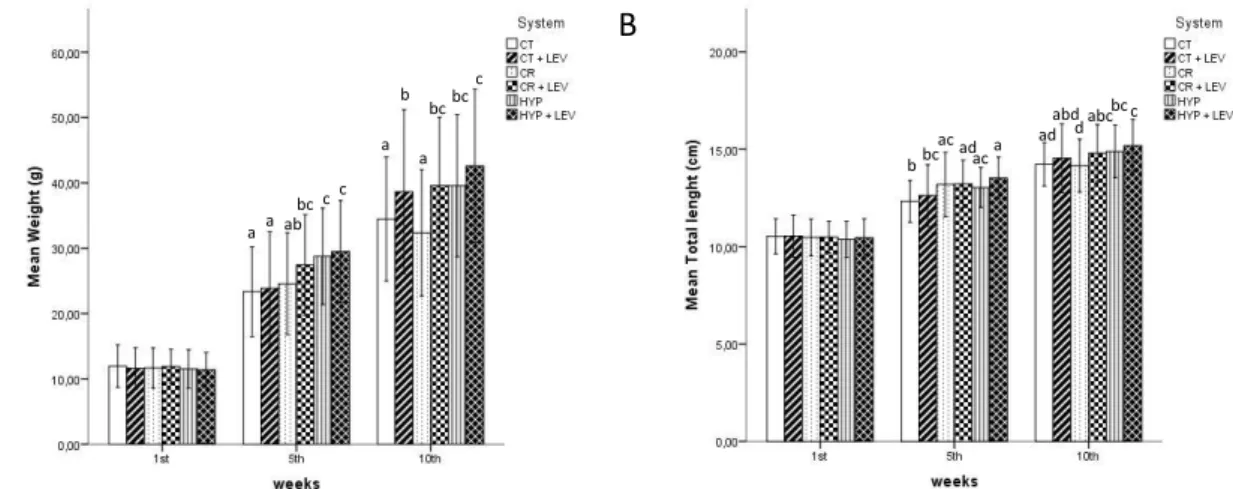
Even though stressed fish presented, in general, a higher weight and total length increment, after the 5th week, a tendency for higher growth is visible for groups fed with the
prebiotic in comparison to the groups fed without supplementation. This can be clearly seen in the 10th week results of Figure 3A, on which control fed with Levabon® fish were heavier
than the control without supplement (p = 0.015) and the same for both crowding treatments (p = 0.000). a a a b c a d a a a b a a a b b b b
22
A
B
Figure 3. European seabass weight (A) and total length (B) variation throughout the experiment. CT - control; CT + LEV - Control fed with Levabon®; CR - crowding stress; CR + LEV - crowding stress
fed with Levabon®; HYP - hypoxia stress; HYP + LEV – hypoxia stress fed with Levabon®. Values
displayed as means ± SD (n = 30). Different letters stand for significant differences between treatments for the same time (two-way ANOVA, LSD test, p ≤ 0.05).
Crowding stress significantly reduced the condition index starting from the 5thweek
and prolonging until the 10th week (Figure 4). Yet, when fish were fed with the supplement,
this parameter was not affected. Both crowding treatments were the only ones to maintain the pattern throughout the experiment. At the final sample, Crowding was significantly lower than all other treatments, including Crowding + Levabon® (p = 0.005).
Figure 4.European seabass condition index variation throughout the experiment. CT - control; CT + LEV - Control fed with Levabon®; CR - crowding stress; CR + LEV - crowding stress fed with
Levabon®; HYP - hypoxia stress; HYP + LEV – hypoxia stress fed with Levabon®. Values displayed as means ± SD (n = 30). Different letters stand for significant differences between
treatments for the same time (two-way ANOVA, LSD test, p ≤ 0.05).
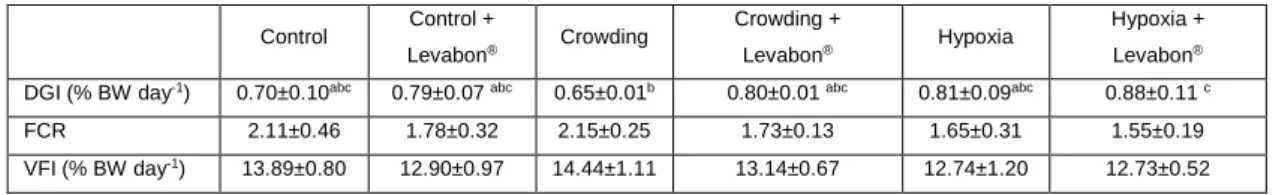
As the previous graphical representations indicated (Figure 2), the growth parameter (DGI) had statistically significant differences, in this case, between Crowding and Hypoxia + Levabon® (Table I), and there is a visible tendency for major growth on treatments that
ab a a c c bc a a b bc bc c a b ac bc ad ac ad abc bc d c abd ad ab d c b b b a a a a a
23 involved the prebiotic application as opposed to their non-prebiotic counterparts. As for the feeding parameters (FCR and VFI), no significant differences were observed.
Table I. Growth performance parameters (DGI – daily growth index; FCR – feed conversion ratio; VFI – Voluntary feed intake; ICF – Initial condition factor; FCF – Final condition factor) of European
seabass. Values displayed as means ± SD (n = 30). Different letters stand for significant differences between treatments for the same time (two-way ANOVA, LSD test, p ≤ 0.05).
Control Control + Levabon® Crowding Crowding + Levabon® Hypoxia Hypoxia + Levabon®
DGI (% BW day-1) 0.70±0.10abc 0.79±0.07 abc 0.65±0.01b 0.80±0.01 abc 0.81±0.09abc 0.88±0.11 c
FCR 2.11±0.46 1.78±0.32 2.15±0.25 1.73±0.13 1.65±0.31 1.55±0.19 VFI (% BW day-1) 13.89±0.80 12.90±0.97 14.44±1.11 13.14±0.67 12.74±1.20 12.73±0.52
Plasmatic parameters
Cortisol, glucose and alkaline phosphatase (ALP)
By the end of the experiment, fish subjected to the hypoxia challenges showed higher plasma cortisol concentration (Figure 5A). Glucose (Figure 5B) also increased during the trial, reaching values close to 150 mg. dL-1 at the 10th week, against the basal
concentrations below 100 mg. dL-1. In the middle of the experiment, treatments subjected
to the prebiotic showed, in general, lower glucose concentration than the treatments fed without the supplement. Control + Levabon® and Crowding + Levabon® were significantly
lower than control (p = 0.000) and crowding (p = 0.001) without the prebiotic administration, respectively. At the final sampling, the control treatments showed the same pattern as in the 5th week, whereas the crowding treatments were no longer statistically different and
organisms in Hypoxia + Levabon® treatment presented higher glucose levels than in
24
A
B
Figure 5. European seabass plasma cortisol (A) and glucose (B) variation throughout the experiment. CT - control; CT + LEV - Control fed with Levabon®; CR - crowding stress; CR + LEV -
crowding stress fed with Levabon®; HYP - hypoxia stress; HYP + LEV – hypoxia stress fed with
Levabon®. Values displayed as means ± SD (n = 30). Different letters stand for significant
differences between treatments for the same time (two-way ANOVA, LSD test, p ≤ 0.05). Alkaline phosphatase concentration (Figure 6) showed irregularities throughout the experiment, reaching its highest levels in almost all conditions at the 5th week. Crowding +
Levabon® maintained the same ALP levels from 5th to 10th week, and by the end of the
experiment control treatments were significantly lower than the treatments subjected to stresses.
Figure 6. European seabass alkaline phosphatase variation throughout the experiment. CT - control; CT + LEV - Control fed with Levabon®; CR - crowding stress; CR + LEV - crowding stress
fed with Levabon®; HYP - hypoxia stress; HYP + LEV – hypoxia stress fed with Levabon®. Values
displayed as means ± SD (n = 30). Different letters stand for significant differences between treatments for the same time (two-way ANOVA, LSD test, p ≤ 0.05).
Immunity parameters
Plasma peroxidase levels (Figure 7A) decreased throughout the course of the experiment and its amount was quite irregular between treatments. At the 10th week, even
a c c c c a b a a ac b b bc a a a a ab b a b cd ac d a b a bc ac c a d e b c c a b bd c d e a c c a b b a a b b c d
25 though without significant differences, there was a tendency for lower peroxidase levels in the treatments that included the prebiotic comparing to their counterparts. Plus, Crowding had significantly more peroxidase than Control + Levabon® (p = 0.040) and both Hypoxia
(p = 0.038) and Hypoxia + Levabon® (p = 0.018). Lysozyme (Figure 7B) did not show
significant differences at any sampling time, although, at 5th and 10th weeks, a tendency for
higher lysozyme in the treatments with Levabon® is observed.
A
B
Figure 7. European seabass plasma peroxidase (A) and lysozyme (B) activities throughout the experiment. CT - control; CT + LEV - Control fed with Levabon®; CR - crowding stress; CR + LEV -
crowding stress fed with Levabon®; HYP - hypoxia stress; HYP + LEV – hypoxia stress fed with
Levabon®. Values displayed as means ± SD (n = 30). Different letters stand for significant
differences between treatments for the same time (two-way ANOVA, LSD test, p ≤ 0.05). Plasma bactericidal activity (Figure 8) had an overall decrease from 5th week to the
last sampling time, and the crowding treatment showed a significantly higher antibacterial activity than all the other treatments.
a cd ad b c c b ab b a ab b b ab ab ab a ab
26 Figure 8. European seabass plasma bactericidal activity throughout the experiment. CT - control; CT + LEV - Control fed with Levabon®; CR - crowding stress; CR + LEV - crowding stress fed with
Levabon®; HYP - hypoxia stress; HYP + LEV – hypoxia stress fed with Levabon®. Values displayed
as means ± SD (n = 30). Different letters stand for significant differences between treatments for the same time (two-way ANOVA, LSD test, p ≤ 0.05).
Oxidative stress biomarkers
Liver lipid peroxidation (Figure 9A) was lower on both hypoxia treatment and Crowding + Levabon®. The supplementation of the diet on fish subjected to crowding
resulted in a significant reduction of the lipid peroxidation comparing to the fish fed with a not supplemented diet subjected to the same stress (p = 0.011). However, there were no significant differences on muscle LPO (Figure 9B) between all treatments. Also, liver presented higher levels of lipid peroxidation than muscle.
A B
Figure 9. European seabass liver (A) and muscle (B) lipid peroxidation (LPO) levels after the 10th
week experiment. Values displayed as means ± SD (n = 15). Different letters stand for significant differences between treatments (one-way ANOVA, Tukey test,p ≤ 0.05).
Although there were no statistically significant differences on the amount of damaged liver DNA between treatments (Figure 10A), differences in muscle DNA damage
a a a a a b
27 were observed (Figure 10B), being the DNA from fish of the treatment Hypoxia + Levabon®
significantly more intact than in most of the other treatments.
A B
Figure 10. European seabass liver (A) and muscle (B) DNA damaged after the 10th week
experiment. Values displayed as means ± SD (n = 15). Different letters stand for significant differences between treatments (one-way ANOVA, Tukey test, p ≤ 0.05).
Superoxide dismutase (Figure 11A) showed no significant differences on its activity between treatments. On the contrary, CAT activity (Figure 11B) was significantly reduced in all treatments, which is a tendency pattern also observed for SOD.
A B
Figure 11. European seabass superoxide dismutase - SOD (A) and catalase (B) activities after the 10th week experiment. Values displayed as means ± SD (n = 15). Different letters stand for