Vol. 10, Nº. 1 (May-October 2019), pp. 112-124
THE INVESTMENT OF SPANISH COMPANIES IN LATIN AMERICA, PATTERNS AND DETERMINING FEATURES
Gonzalo Solana González
gsolana@nebrija.es Holder of a Bachelor Degree in Economics and Business Sciences, Universidad Autónoma de Madrid. Holder of a Bachelor in Law, Universidad Nebrija. Holder of a Ph.D. in Economic Sciences, Universidad Castilla-La Mancha. Director of the Nebrija Santander Global Chair in internationalization of companies, Universidad Nebrija (Spain)
Rafael Myro Sánchez
rmyrosan@ucm.es Holder of a Bachelor Degree in Economics and Business Administration, Universidad Complutense, Madrid. Holder of a Ph.D. in Economic Sciences, Universidad Complutense. Full Professor of Applied Economics, Universidad Complutense (Spain).
Abstract
The objective of this paper is to analyse the recent evolution of Spain’s Foreign Direct Investment in Latin America and the internationalization patterns of Spanish companies in these countries. To this end, statistics on investment flows have been studied and the main work of the authors in the business field have been reviewed. As a result, investment interest in Latin America has not decreased despite the crisis that began in 2008, due to its dynamism, the growth of its middle classes and the need to improve basic infrastructure. The interest in Latin America for the opportunities these countries offer to address third markets and improve competitive capacity is also noteworthy..
Keywords
Foreign investment; Companies; Spain; Latin America
How to cite this article
González, GS; Sánchez, RM (2019). "The investment of Spanish companies in Latin America, patterns and determining features". JANUS.NET e-journal of International Relations, Vol. 10, N.º 1, May-October 2019. Consulted [online] on the date of the last visit, https://doi.org/10.26619/1647-7251.10.1.8
THE INVESTMENT OF SPANISH COMPANIES IN LATIN AMERICA, PATTERNS
AND DETERMINING FEATURES12
Gonzalo Solana González
Rafael Myro Sánchez
Introduction
The globalization phenomenon has been driven by the progressive liberalization of capital movements on a world scale, leading to a remarkable dynamism in the flows and stock of foreign direct investment (FDI) in the last three decades, Fouquin and Hugot (2016). In 2016, according to data from the United Nations Conference on Trade and Development (UNCTAD), (2017), the world stock of FDI amounted to 26,7 billion dollars, representing 35,5% of the world GDP, compared to the 2,2 billion dollars of 1990 (10,1% of the world GDP).
Spanish companies have participated in this growth in a very active way. Between 1993 and 20163, the flows of Spain’s gross FDI abroad totalled 691.000 million euros, an annual average of 28.790 million euros. As a result, in 2015 the Spanish economy maintained a stock of investment abroad exceeding 433.000 million euros.
Spain’s investment profile in global markets has varied substantially according to the national and international situation, with the period 2003-2007 being the most dynamic, with annual average flows close to 50.000 million euros. Since then, investments abroad have been characterized by a more moderate evolutionary profile.
In order to analyse the patterns of business internationalization towards Latin American countries, the evolution of Spanish FDI in Latin America is examined first, and then the main patterns of the internationalization processes in these destinations are presented.
1 The translation of this article was funded by national funds through FCT - Fundação para a Ciência e a Tecnologia - as part of OBSERVARE project with the reference UID/CPO/04155/2019, with the aim of publishing Janus.net. Text translated by Carolina Peralta.
2 This work originated in the interest to know what the investment trajectory of Spanish companies in Latin America in the 21st century has been, in order to know its dynamics and the potential impact of the crisis that started in Spain in 2008 on the aggregate investment behaviour of the country. The article combines research with reflection on this subject. This research is part of the activities conducted in collaboration between the Nebrija Santander Global Chair in the internationalization of companies and the Complutense University of Madrid.
3 Data obtained from Spain’s Registry of Foreign Investments Registro de Inversiones Exteriores (Ministry of Industry, Trade and Tourism).
114
1. Spanish investment in Latin America: characteristics and evolution
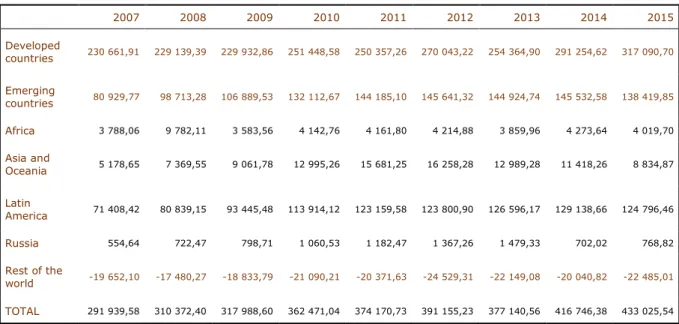
Latin America has gradually become the second priority destination of the investing efforts of Spanish companies abroad, after the group of developed countries4 (in particular, the European Union). Specifically, in 2015, 28,8% of Spain's FDI stock was concentrated in the Latin American region, as shown in Table 1.Table 1. Stock of Spanish gross FDI abroad: investment position (millions of euros)
2007 2008 2009 2010 2011 2012 2013 2014 2015 Developed countries 230 661,91 229 139,39 229 932,86 251 448,58 250 357,26 270 043,22 254 364,90 291 254,62 317 090,70 Emerging countries 80 929,77 98 713,28 106 889,53 132 112,67 144 185,10 145 641,32 144 924,74 145 532,58 138 419,85 Africa 3 788,06 9 782,11 3 583,56 4 142,76 4 161,80 4 214,88 3 859,96 4 273,64 4 019,70 Asia and Oceania 5 178,65 7 369,55 9 061,78 12 995,26 15 681,25 16 258,28 12 989,28 11 418,26 8 834,87 Latin America 71 408,42 80 839,15 93 445,48 113 914,12 123 159,58 123 800,90 126 596,17 129 138,66 124 796,46 Russia 554,64 722,47 798,71 1 060,53 1 182,47 1 367,26 1 479,33 702,02 768,82 Rest of the world -19 652,10 -17 480,27 -18 833,79 -21 090,21 -20 371,63 -24 529,31 -22 149,08 -20 040,82 -22 485,01 TOTAL 291 939,58 310 372,40 317 988,60 362 471,04 374 170,73 391 155,23 377 140,56 416 746,38 433 025,54
Note: the negative sign in terms of stock means losses associated with the investments. Source: Ministry of Industry, Trade and Tourism.
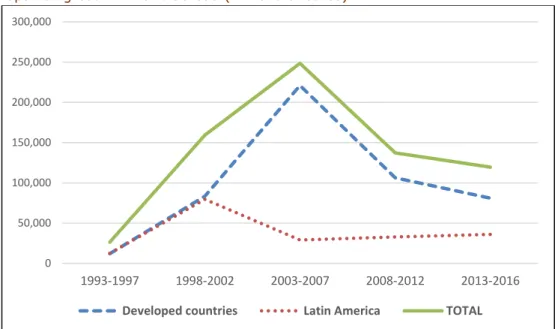
The Spanish investment trajectory, however, has been unequal over time, as can be seen in Chart
Chart 1. The nineties were characterized by the leading role of Latin America among destinations, with some FDI flows directed to this area higher than those sent to developed countries (9.590 million euros compared to 7.001 million euros in the annual average between 1993 and 2000). Behind this dynamic were the liberalization and privatization processes in certain sectors in Latin America, the attractiveness of the size of its markets, the incipient international vocation of the large Spanish companies and, of course, the existence of strong cultural links.
4 According to the United Nations’ criterion of country classification in economic terms: http://unctadstat.unctad.org/EN/Classifications.html
Chart 1. Spanish gross FDI flows abroad (millions of euros)
Source: Ministry of Industry, Trade and Tourism.
In the early stages of the 21st century, there was a turning point, with a gradual loss of the relative strength of Spanish FDI in Latin America, although this area remained in the second position as an investment destination, as shown in Table 2. The progress in the process of economic and monetary integration within the European Union, together with certain instabilities and uncertainties in the world scenario, to a large extent may explain this behaviour.
Table 2. Spanish gross FDI flows abroad (millions of euros)
1993-1997 1998-2002 2003-2007 2008-2012 2013-2016 Total 1993-2016
Developed countries 12 089,9 83 542,9 221 034,3 106 210,9 81 068,7 503 946,7
Emerging countries 6 737,4 80 936,8 33 103,7 45 514,3 41 781,4 208 073,5
Africa 190,7 1 272,7 3 726,5 2 224,1 629,3 8 043,3
Asia and Oceania 150,8 2 140,6 2 513,6 5 477,8 2 659,3 12 942,0
Latin America 12 504,1 79 707,6 29 004,6 32 975,8 35 945,3 190 137,4
Russia 28,8 73,5 854,9 639,3 339,3 1 935,7
Rest of the world 7 653,7 -5 195,8 -5 548,5 -14 521,3 -3 440,4 -21 052,3
TOTAL 26 481,0 159 283,9 248 589,5 137 204,0 119 409,7 690 968,0
Note: the negative sign in ends of flow reveals divestment dynamics. Source: Ministry of Industry, Trade and Tourism.
0 50,000 100,000 150,000 200,000 250,000 300,000 1993-1997 1998-2002 2003-2007 2008-2012 2013-2016
116
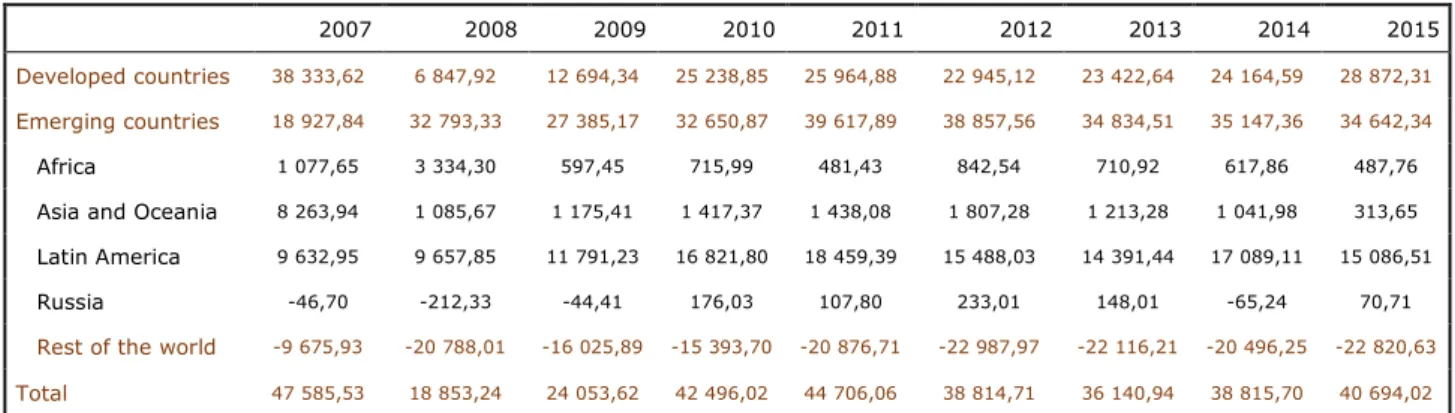
However, in the 2013-2016 period, Spanish FDI in Latin America increased again, in contrast to its downward trend in other areas5, reaching an annual average flow of around 8.986 million euros (higher than 5.801 million euros and the 6.595 million euros recorded in the annual average in the 2003-2007 and 2008-2012 periods, respectively). This recovery also took place in a context of sustained reduction of the flows of foreign investment from the rest of the world to Latin America (of 16% in 2016), as indicated by UNCTAD (2017). Thus, even in this scenario, the Spanish companies trusted the economy of the area, by consolidating and increasing their presence in a sustained manner. This is an adequate response of the companies to the important economic results obtained from their investment operations in the area. In fact, as Table 3 shows, the results obtained by Spanish companies linked to their investments in the area were about 15.000 million euros in 2015. On the other hand, investments in developed countries were also prominent in terms of results, totalling 28,872.3 million euros in that year.
Table 3. Results of Spanish gross FDI abroad (millions of euros)
2007 2008 2009 2010 2011 2012 2013 2014 2015
Developed countries 38 333,62 6 847,92 12 694,34 25 238,85 25 964,88 22 945,12 23 422,64 24 164,59 28 872,31
Emerging countries 18 927,84 32 793,33 27 385,17 32 650,87 39 617,89 38 857,56 34 834,51 35 147,36 34 642,34
Africa 1 077,65 3 334,30 597,45 715,99 481,43 842,54 710,92 617,86 487,76
Asia and Oceania 8 263,94 1 085,67 1 175,41 1 417,37 1 438,08 1 807,28 1 213,28 1 041,98 313,65
Latin America 9 632,95 9 657,85 11 791,23 16 821,80 18 459,39 15 488,03 14 391,44 17 089,11 15 086,51
Russia -46,70 -212,33 -44,41 176,03 107,80 233,01 148,01 -65,24 70,71
Rest of the world -9 675,93 -20 788,01 -16 025,89 -15 393,70 -20 876,71 -22 987,97 -22 116,21 -20 496,25 -22 820,63
Total 47 585,53 18 853,24 24 053,62 42 496,02 44 706,06 38 814,71 36 140,94 38 815,70 40 694,02
Note: the negative sign in terms of stock means losses associated with the investments. Source: Ministry of Industry, Trade and Tourism.
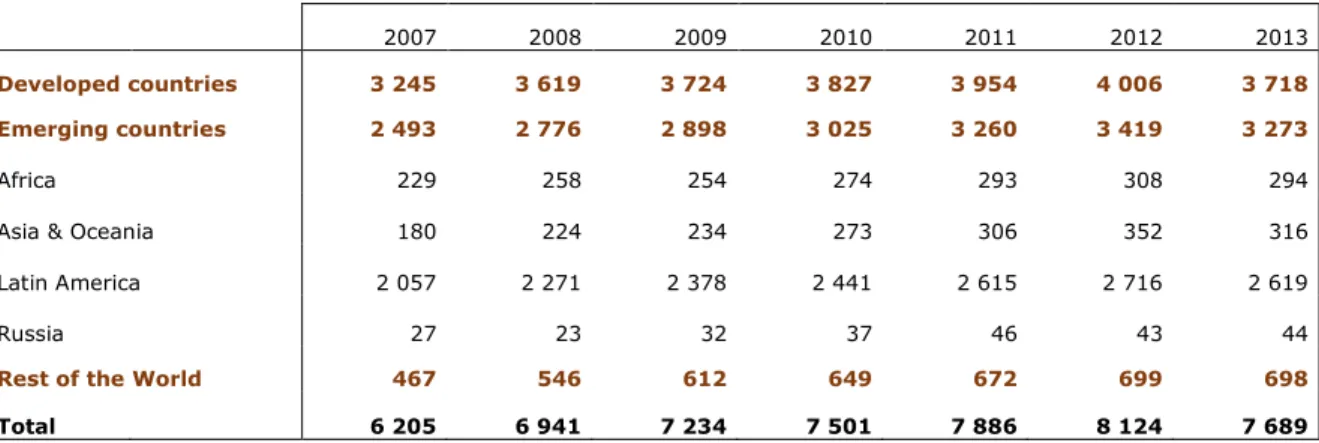
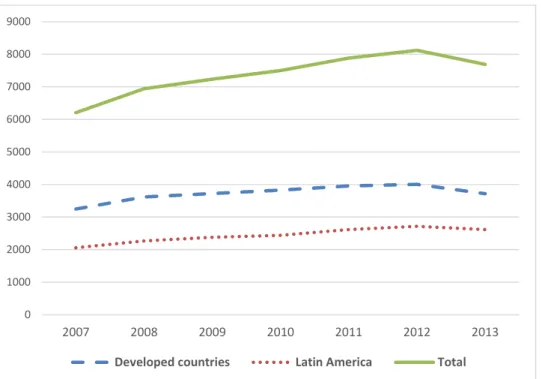
The higher nominal value of Spanish investments in Latin America was accompanied by a growing number of companies established there, as the information in Table 4 and Chart 2 shows. In 2013, 2.619 Spanish companies had investments in Latin America, which represents an increase of 27,3% compared to 2007, higher than that experienced by the number of Spanish companies located in developed countries and around the world (increases of 14,6% and 23,9%, respectively).
The geographical concentration is the dominant trend in Spain’s investing relations in Latin America, with the group formed by Brazil, Mexico, Venezuela, Chile and Argentina being the undisputed protagonist. These five countries concentrated 87,3% of the stock
5 It should be noted that Spain’s decrease in aggregate investment figures abroad does not mean that the investment does not remain positive. On the contrary, during the years of economic crisis, the gross investment of Spanish companies abroad continued to grow, albeit at a more moderate pace than in the previous period, of intense boom. So did the net investment, although in a more limited way. The effect of the economic crisis was felt in the increase in divestment, especially from medium and large companies, which needed to obtain funds to rebalance their sheets and sold shares in their foreign subsidiaries.
of Spanish FDI in Latin America in 2015. The interpretation is similar if the analysis is made in terms of the average flows sent to the area since 1993: these five countries totalled more than 85% of Spain’s FDI flow to Latin America in the 1993-2014 period. During the crisis period, specifically from 2007 to 2014, the stock of Spain’s FDI in Brazil and Venezuela grew very considerably, almost doubling; the same applied in the case of Chile, although to a lesser extent. The stock of Spanish FDI in Mexico remained unchanged and, on the other hand, in Argentina it decreased, as underlined by Álvarez, Myro and Vega (2016)6.
From the point of view of the number of companies present in the different Latin American countries in 2013 (last available year), again Mexico (523 Spanish investment companies), Brazil (432), Argentina (359) and Chile (313) stood out as the most relevant focal points for Spanish business.
In terms of comparison with the other areas, Latin America has also experienced a notable increase in the number of Spanish investment companies. The advance since 2007 of the Spanish investment fabric there has been the highest in absolute terms, despite the fact that Spanish investments in developed countries continue to maintain their relative importance. This dynamic is probably the result of greater investment propensity in recent years towards less mature destinations for the Spanish companies (both from the rest of the world and from emerging countries, especially Latin America), in line with the intense process of internationalization of the business fabric since 2008.
Table 4. Spanish investment companies abroad (number)
2007 2008 2009 2010 2011 2012 2013 Developed countries 3 245 3 619 3 724 3 827 3 954 4 006 3 718 Emerging countries 2 493 2 776 2 898 3 025 3 260 3 419 3 273 Africa 229 258 254 274 293 308 294
Asia & Oceania 180 224 234 273 306 352 316
Latin America 2 057 2 271 2 378 2 441 2 615 2 716 2 619
Russia 27 23 32 37 46 43 44
Rest of the World 467 546 612 649 672 699 698
Total 6 205 6 941 7 234 7 501 7 886 8 124 7 689
Source: Ministry of Industry, Trade and Tourism.
6 One should keep in mind that the evolution of the stock is not only a consequence of the net investment, but also of changes in the value of the shares and changes in the exchange rate.
118
Chart 2. Spanish investment companies abroad (number)
Source: Ministry of Industry, Trade and Tourism.
In addition to this quantitative approach, it is interesting to analyse the relative importance of Spanish investment in each Latin American country, as per information provided in Table 5. In this sense, the stock of Spanish FDI accounted for 83,3% of the total world FDI received by Venezuela in 2015, 13,1% of that received by Bolivia, 9,8% by Ecuador, 8,3% by Brazil, 7,6% by Argentina, and 7,5% by Chile. Spanish FDI has, therefore, played a very important role in the productive structure of certain Latin American economies during the second decade of the 21st century.
Table 5. Spain’s investment position in Latin America - main investment countries - Year 2015
Spanish FDI stock (mill. eur) % total Spanish FID in Latin America % of FDI stock received from the country
ARGENTINA 5 824,6 4,7% 7,6% BOLIVIA 1 375,7 1,1% 13,1% BRAZIL 35 138,0 28,2% 8,3% CHILE 15 031,9 12,0% 7,5% COLOMBIA 3 969,5 3,2% 3,0% COSTA RICA 468,7 0,4% 1,7% ECUADOR 1 387,2 1,1% 9,8% EL SALVADOR 104,0 0,1% 1,3% GUATEMALA 317,2 0,3% 2,7% GUIANA 22,9 0,0% 0,9% HONDURAS 35,6 0,0% 0,3% MEXICO 31 662,5 25,4% 6,9% NICARAGUA 17,6 0,0% 0,2% PANAMA 1 783,3 1,4% 5,0% PARAGUAY 237,5 0,2% 6,0% PERU 3 543,6 2,8% 4,6% DOMINICAN REPUBLIC 926,2 0,7% 3,4% URUGUAY 1 279,8 1,0% 6,5% VENEZUELA 21 313,9 17,1% 83,3%
TOTAL LATIN AMERICA 124 796,5 100,0% 8,0%
Source: Ministry of Industry, Trade and Tourism and UNCTAD (2017). 0 1000 2000 3000 4000 5000 6000 7000 8000 9000 2007 2008 2009 2010 2011 2012 2013
From the sectors’ point of view, as shown in Chart 3, the Spanish FDI in Latin America has been directed mainly to financial and insurance activities (40,3% of the total stock invested in the area in 2015), with an increase of the interest of Spanish investors in this sector since 2007 (when it represented 26,4% of the Spanish FDI stock in Latin America). It also highlights Spain’s investing presence in the supply of electricity, gas and others, (9,5%) and telecommunications (7,6%), although in both cases the share of all Spanish investments in the area declined. (14,3% and 19,6% in 2007, respectively).
Chart 3. Stock of Spanish FDI in Latin America by main branches of activity at the destination - Year 2015
Source: Ministry of Industry, Trade and Tourism
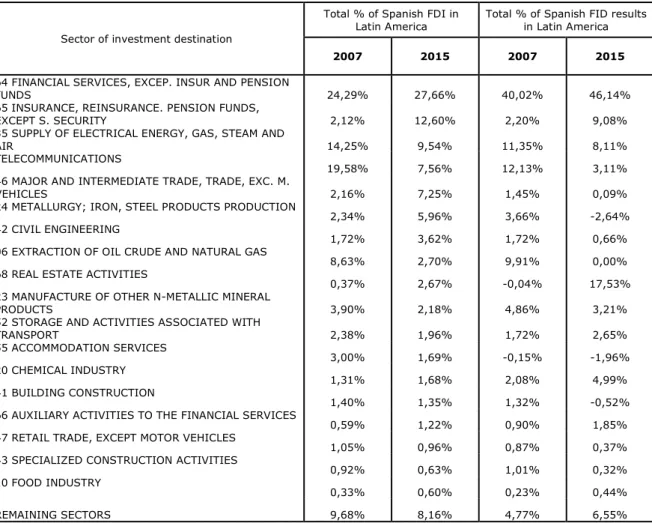
In terms of profitability, contained in Table 6, investments directed towards financial and insurance activities have been the most lucrative, concentrating 55,2% of the total results of Spanish FDI in Latin America in 2015. Conversely, other activities did not obtain positive results, although in general their relevance to Spain’s accumulated investment stock in the area was limited in relative terms.
By geographical areas, Spanish investments in financial and insurance activities have been located mostly in Mexico and Brazil; regarding information and communications, in Brazil; in the manufacturing industries, Brazil and Mexico; and in the energy supplies of Chile and Brazil, as indicated by Cerón et al. (2014).
FINANCIAL SERVICES, EXCEPT INSURANCE AND PENSION FUNDS ;
0.276550553
INSURANCE, REINSURANCE AND … SUPPLY OF ELECTRIC POWER,
GAS, STEAM AND AIR; 0.095428508 TELECOMMUNICATIONS ; 0.075584997 WHOLESALER AND INTERMEDIARIES; 0.072515038 METALLURGY: IRON AND STEEL PRODUCTS:
0.059608021 CIVIL ENGINEERING;
0.036 EXTRACTION OF OIL CRUDE AND NATURAL
GAS; 0.027
REAL ESTATE ACTIVITIES;
0.027 MANUFACTURE OF OTHER NON METALLIC
MINERAL PRODUCTS; 0.022
REMAINING SECTORS: 0.182526011
120
Table 6. Stock and results of Spanish FDI in Latin America. Main sectors of destination
Sector of investment destination
Total % of Spanish FDI in
Latin America Total % of Spanish FID results in Latin America
2007 2015 2007 2015
64 FINANCIAL SERVICES, EXCEP. INSUR AND PENSION
FUNDS 24,29% 27,66% 40,02% 46,14%
65 INSURANCE, REINSURANCE. PENSION FUNDS,
EXCEPT S. SECURITY 2,12% 12,60% 2,20% 9,08%
35 SUPPLY OF ELECTRICAL ENERGY, GAS, STEAM AND
AIR 14,25% 9,54% 11,35% 8,11%
TELECOMMUNICATIONS
19,58% 7,56% 12,13% 3,11%
46 MAJOR AND INTERMEDIATE TRADE, TRADE, EXC. M.
VEHICLES 2,16% 7,25% 1,45% 0,09%
24 METALLURGY; IRON, STEEL PRODUCTS PRODUCTION
2,34% 5,96% 3,66% -2,64%
42 CIVIL ENGINEERING
1,72% 3,62% 1,72% 0,66%
06 EXTRACTION OF OIL CRUDE AND NATURAL GAS
8,63% 2,70% 9,91% 0,00%
68 REAL ESTATE ACTIVITIES
0,37% 2,67% -0,04% 17,53%
23 MANUFACTURE OF OTHER N-METALLIC MINERAL
PRODUCTS 3,90% 2,18% 4,86% 3,21%
52 STORAGE AND ACTIVITIES ASSOCIATED WITH
TRANSPORT 2,38% 1,96% 1,72% 2,65% 55 ACCOMMODATION SERVICES 3,00% 1,69% -0,15% -1,96% 20 CHEMICAL INDUSTRY 1,31% 1,68% 2,08% 4,99% 41 BUILDING CONSTRUCTION 1,40% 1,35% 1,32% -0,52%
66 AUXILIARY ACTIVITIES TO THE FINANCIAL SERVICES
0,59% 1,22% 0,90% 1,85%
47 RETAIL TRADE, EXCEPT MOTOR VEHICLES
1,05% 0,96% 0,87% 0,37%
43 SPECIALIZED CONSTRUCTION ACTIVITIES
0,92% 0,63% 1,01% 0,32%
10 FOOD INDUSTRY
0,33% 0,60% 0,23% 0,44%
REMAINING SECTORS 9,68% 8,16% 4,77% 6,55%
Source: Ministry of Industry, Trade and Tourism.
2. Business patterns: main features, determinants and strategies
Several analyses have been carried out on the determinants of Spanish investments abroad, especially by Ramírez, Delgado and Espitia (2004), Ramírez, Delgado and Espitia (2006), Gordo and Tello (2008), Martínez Martín (2011), Martí, Alguacil and Orts (2013), Fariñas and Martín Marcos (2013). These studies highlight the role of the attractiveness of market location, with a distinction between developed and developing countries and, within them, Latin America. A comprehensive synthesis of these studies can be found in Myro (2014a) and Myro (2014b).
Their conclusions indicate that Spanish companies with greater advantages regarding size, profitability and productivity have led the rapid process accessing foreign markets through export and FDI. Larger companies, with their own technological assets, brand and more extensive export experience, have channeled their preferences to less developed markets that are larger, have growth possibilities and better surrounding markets, where they can expect higher benefits from their competitive advantages. Large companies have directed their investments to a greater number of countries and have reached the most distant and unknown markets.
It should be noted that in this process, Latin America has played a very prominent role. At present, almost one third of the FDI stock of Spanish companies abroad is located in Latin American countries and has been the most important destination in the recent investment boom by Spanish companies abroad. Thus, in the first biennium of heavy investments by Spanish companies abroad (1999-2000) in Latin America, over 56.000 million euros were invested there, which accounted for 61% of total Spanish FDI abroad and for 98,8% of the amount targeted to emerging market destinations. The protagonists of these investments were the large companies. Chile and Argentina, and to a lesser extent Mexico, were the first countries where the Spanish presence stood out.
Regarding the main determinants and strategies followed by Spanish companies in Latin America, this paper summarizes the results of the studies conducted by the Nebrija Santander Global Chair in the internationalization of companies7.
On this basis, the main reasons for Spanish companies to establish themselves in Latin American countries were related to the potential of the latter’s domestic markets (both in terms of size and economic dynamism). In particular, the growth of the middle classes, with the basic services they demand, and the need to improve their infrastructure opened up numerous business opportunities.
The factors associated with legal security and macroeconomic stability, aspects in which many Latin American countries have improved since the beginning of the 21st century, were also relevant, as in the rest of destinations, for Spanish companies to settle in Latin America.
In this sense, according to the study carried out by Solana (2017) on the location of Spanish companies abroad, the factors that determine their choice of location the most are related to the quest for company greater efficiency through internationalization, as well as having a secure institutional political framework and an appropriate business environment. In Latin America, these factors are very important, but in differential terms we can see that Latin America was the destination where, for Spanish companies, the factors associated with size and market potential stood out as the most relevant in these decisions.
On the other hand, cultural proximity has been a crucial aspect in the relevance of Latin America for the investments made by Spanish companies abroad. Having a common language has facilitated this process, especially for smaller companies. However, the studies show that, on numerous occasions, proximity is confused with cultural identity, which is a potential source of conflicts and problems.
Within Latin America, there are very diverse economic and political situations, which explain why the entry processes in these markets are very different. However, in most of them it has been usual, especially among the smaller companies, to resort to the figure of the local partner, at least in the first years of the development of their activity, and to the establishment of subsidiaries or acquisition of companies, instead of using more complex formulas, such as joint ventures, which have traditionally been less common. On numerous occasions, Spanish businessmen have reached an agreement with a local partner, which has allowed them to get to know local singularities better and more quickly and facilitated relations with different agents and institutions, although sometimes these
122
agreements have caused problems over time. For this reason, companies highlight the importance of evaluating with great care and time the profile of the local partner and their long-term business commitment.
Most of these investment operations have been financed by the companies' own resources. The implantation operations in other countries require a lot of maturation time and it is necessary to take up the existing sunk costs. That is why it is necessary to reduce, as far as possible, the financial costs.
Another significant aspect of the Spanish companies’ internationalization strategies in Latin America is the fairly widespread use of mixed and local structures in the organization of the different areas or departments of companies, in which, as the years go by, local personnel prevail over Spanish expatriates.
Regarding the main obstacles encountered by Spanish companies in their establishment process in Latin America, those related to the bureaucratic procedures or to the functioning of the corresponding Public Administration, the strong competition or the high economic power of certain local business groups, or the difficulty in finding qualified personnel for certain activities stand out. Undoubtedly, these are issues that can be very different in each country, and require a process of prior information and knowledge that can lead to tensions, delays or even suspend the FDI operation. Therefore, it is very important that all companies understand these obstacles and internalize them in their study strategy to settle in a Latin American country.
On the other hand, the results obtained by the majority of Spanish companies in Latin America have been satisfactory. The vast majority point out that thanks to their investments in Latin America, they have increased their sales, profits and market share. However, the most highlighted aspects by Spanish businessmen are the long-term component of these investments, with clear benefits in terms of improving business reputation and better future business prospects. For these companies, their presence in Latin America has increased their growth potential and the possibilities arising from using certain countries there as a platform for expansion to third markets. In particular, the interest in reaching strategic agreements between Spanish and Latin American companies for joint access to other markets is beginning to emerge, an aspect of special relevance to enter dynamic markets such as the Asian.
In short, Spanish companies in Latin America highlight their interest to stay in the area, their desire to be rooted in Latin American society and their firm commitment to its culture and customs.
Finally, it is worth noting the existence of efficient support institutions and appropriate commercial policies as relevant aspects of the Spanish companies’ internationalization process in Latin America, especially for smaller companies.
Conclusion
Latin America has been a priority destination for Spanish companies since the end of the 20th century. In fact, in spite of the moderation during the years of economic crisis experienced in Spain between the end of the last decade and the middle of the current one, and of the gloomy perspectives of the UNCTAD for the area, since 2010 the Spanish presence has experienced remarkable growth, both regarding investment volume and
the number of companies located there. Latin America continues to be a priority destination for the investments of Spanish companies, attesting their commitment to the development of this continent.
Recent Spanish FDI is significant in Latin America (with a particular presence in Brazil, Mexico, Venezuela, Chile, and Argentina) and in certain economic sectors. Some weaknesses of the Spanish FDI were related to their excessive concentration at sector, business and geographical levels.
From the point of view of the patterns and motivations for the establishment of Spanish companies in Latin America, one can see the attractiveness that these markets offer due to their dynamism, driven by the growth of the middle classes and the needs to improve their basic infrastructure. In addition, all this is driven by the relevance of cultural proximity to undertake investments there. It is also important to highlight the firm commitment to permanence and integration of Spanish companies in the context of the country in Latin America where they are located.
Spanish FDI in Latin America is characterized by its higher relative performance compared with that obtained in other parts of the world, something recognized and valued by companies. At the same time, Spanish companies have acquired an intangible knowledge and international experience that allow them to expand to other markets and improve their competitive capacity.
Faced with certain obstacles, Spanish companies interested in productive investment in Latin America must gather prior information and knowledge, contact partners at destination, and get closer to the support institutions and entities present in these countries, which can provide assistance and help with the bureaucracy.
Regarding future research, it would be interesting to analyze the divestment dynamics that could be occurring in some destinations, as the negative results of the investment stock show. For this purpose, the FDI sector dimension could be further studied, as well as the influence seen in other countries regarding the reversion of industrial relocation processes, with the possible return of foreign investment to the country of origin (linked to the influence of Industry 4.0).
Ultimately, the intense cultural and economic links between Latin America and Spain open up numerous opportunities for collaboration between companies from both areas to face the challenges of globalization and access to other markets, figuring as a priority in the political agendas of the governments on both sides of the Atlantic.
References
Álvarez, Elisa; Myro, Rafael and Vega, Josefa (2016). La inversión de las empresas españolas en el exterior ¿Se reinicia la gran ola expansiva? In: Papeles de Economía Española, No. 150, pp. 2-19.
Cerón, Juan Antonio; García, Sofía; Salas, Álvaro and Vicéns, José (2014). La aportación de las empresas españolas a las economías de Latinoamérica: un balance. In: Documentos Instituto Estudios Fiscales, No. 13/2014, pp. 1-162.
Fariñas, José Carlos and Martín Marcos, Ana (2012). Multinacionales españolas y extranjeras: algunos rasgos comparativos. In: Economistas, No. 130, pp.127-137.
124
Fouquin, Michel and Hugot, Jules (2016). Two centuries of bilateral trade and gravity data: 1827-2014. In: Working Papers CEPII research center, No. 2016-14, pp. 1-39. Gordo, Esther and Tello, Patrocinio (2008). Determinantes microeconómicos de la decisión de localización de la inversión directa en el exterior de las empresas españolas. In: Boletín Económico del Banco de España, No. 9, pp. 61-74.
Martí, Josep; Alguacil, Maite and Orts, Vicente (2013). Where do foreign affiliates of Spanish multinational firms locate in developing and transition economies? In: Department of Economics Working Paper, Universitat Jaume I, No. 2013/19, pp. 1-30. Martínez Martín, Jaime (2011). General equilibrium long-run determinants for Spanish FDI: a spatial panel data approach. In: Series, Vol. 2, pp. 305-333.
Ministry of Industry, Trade and Tourism of Spain - Ministerio de Industria, Comercio e Industria (2017). Registro de Inversiones Exteriores.
Myro, Rafael (2014a). Determinantes y efectos de la inversión directa española: una revisión de la literatura. In: Myro, Rafael (2914). España en la Inversión Directa Internacional. Capítulo 10. Madrid. Ed. Instituto Estudios Económicos, pp. 378-439. Myro, Rafael (2014b). España en la Inversión Directa Internacional. Madrid. Ed. Instituto de Estudios Económicos, 604p.
Ramírez, Marisa, Delgado, José Manuel and Espitia, Manuel (2004). Destino de las inversiones españolas: países industriales versus países en desarrollo. In: Revista de Economía Aplicada, Vol. XII, No. 34, pp. 127-140.
Ramírez, Marisa, Delgado, José Manuel and Espitia, Manuel (2006). La internacionalización de las empresas españolas, 1993-1999; un estudio de los factores de localización. In: Moneda y Crédito, segunda época, No. 222, pp. 167-214.
Solana, Gonzalo (2017). La inversión de las empresas españolas en el exterior. Una decidida apuesta por la internacionalización. Madrid. Mc Graw Hill, 148p.
UNCTAD - United Nations Conference on Trade and Development (2017). World Investment Report 2017. New York and Geneva. Ed. United Nations Publication, 232p.