____________________________________
1 Engo e Mestre em Engenharia Agrícola pela Universidade Estadual do Oeste do Paraná - UNIOESTE
2 Dr. em Irrigação e Drenagem, Prof. Associado, Universidade Estadual do Oeste do Paraná, Cascavel - PR, Líder do Grupo de Pesquisa em Recursos Hídricos e Saneamento Ambiental - RHESA, marcio.vilasboas@unioeste.br.
3 M.Sc. em Engenharia Agrícola, UNIOESTE-PR, marcelo@cootrade.com.br.
4 Engo Agrícola, Professor Adjunto, UTFPR - Câmpus Pato Branco, rhhe@utfpr.edu.br.
5 Profa. Dra., Recursos Hídricos e Saneamento Ambiental, Líder do Grupo Planejamento Ambiental no Sudoeste do Paraná. Recebido pelo Conselho Editorial em: 28-11-2010
Aprovado pelo Conselho Editorial em: 23-4-2012
IRRIGATION SET
ADILSON L. BORSSOI1, MARCIO A. VILAS BOAS2, MARCELO REISDÖRFER3, RICARDO H. HERNÁNDEZ4, FRANCIELE A. C. FOLLADOR5
ABSTRACT: The purpose of this study was to evaluate the uniformity of distribution coefficient (UDC) and coefficient of variation (CV) of a familiar set of irrigation, classifying it the ASAE standard. The irrigation and fertigation are determined by two methods the KELLER & KARMELI and DENÍCULI . The two experiments were subjected to varying pressures: 12, 14, 16 and 18 kPa, in a completely randomized design of twenty samples composed of flows with three replications. Urea, potassium chloride (KCl) and ammonium phosphate (MAP) were the elements used for fertigation. The system consisted of a 200 L tank, which supplied another container of 30 L, it was moved vertically to control the pressure. The data was statistically compared between treatments for each methodology. In fertigation the best pressure was 16 kPa and was classified as "excellent" for UDC (91.03%) and "marginal" for C.V. (7.47%). For the irrigation treatment, the best pressure was 16 kPa rated "excellent" for UDC (91.2%) and "marginal" for C.V. (7.68%). The DENÍCULI et al. (1980) methodology proved more reliable for the evaluation of drip systems. It was observed that this set has good uniformity of distribution, but with great variability in flows.
KEYWORDS: emitter, hydraulic performance, low head, drip irrigation.
UNIFORMIDADE DE APLICAÇÃO DE ÁGUA E FERTIRRIGAÇÃO EM UM CONJUNTO DE IRRIGAÇÃO POR GOTEJAMENTO
RESUMO: O objetivo deste trabalho foi avaliar o coeficiente de uniformidade de distribuição (CUD) e o coeficiente de variação (C.V.) de um conjunto de irrigação familiar, classificando-o pela norma ASAE (American Society of Agricultural Engineers), nos sistemas de irrigação e fertirrigação, sendo determinados por duas metodologias: a de KELLER & KARMELI, e a de DENÍCULI. Os dois experimentos foram submetidos a quatro pressões: 12; 14; 16 e 18 kPa, em um delineamento inteiramente casualizado de vinte coletas de vazões, com três repetições. Para a fertirrigação, foram utilizados ureia, cloreto de potássio (KCl) e fosfato monoamônico (MAP). O sistema era composto por um reservatório de 200 L, que abastecia outro recipiente de 30 L, este sendo deslocado verticalmente para o controle da pressão. Os dados foram comparados estatisticamente entre os tratamentos para cada metodologia. Na fertirrigação, a melhor pressão foi de 16 kPa, e classificou-se como “excelente” para CUD (91,03%) e “marginal” para C.V. (7,47%). Para o tratamento com irrigação, a melhor pressão foi de 16 kPa classificado como “excelente” para CUD (91,2%) e “marginal” para C.V. (7,68%). A metodologia de DENÍCULI et al. (1980) mostrou-se mais confiável para a avaliação de sistemas de gotejamento. Observou-se que este conjunto tem ótima uniformidade de distribuição, mas com grande variabilidade nas vazões.
INTRODUCTION
The large amount of water required for irrigation, the decreasing of availability and the high cost of energy required for its implementation have increased interest in rationalization so it is necessary to minimize the amount of water applied by irrigation without compromising the final yield using the localized irrigation (AZEVEDO et al., 1999).
LACERDA & OLIVEIRA (2007) have investigated irrigation systems in the Northeast Brazil and reported that the lack of technical guidance has been an obstacle to development and exacerbates environmental degradation by excessive or inappropriate use of agricultural techniques.
Family farming in Brazil has been responsible for 40% of the gross value of agricultural production and has corresponded to 10% of GNP consisting of 84% of rural properties. In addition, it has employed 70% of the field labor and has been responsible for 54% of the food for Brazilian families (BRASIL, 2006).
In Brazil, the lack or low transference of technology for the family farmer has been a factor that hinders their survival in rural areas (SILVA, 2006). According to NASCIMENTO (2006), alternatives should be developed for disseminating irrigation techiniques and reducing the rural exodus. Offering this technology, farmers will be able to increase food production for consumption, and also improve the quality of products, adding value for sales (SILVA, 2006).
SOUZA et al. (2005) report that in poor countries of Asia and Africa small sets of irrigation by gravity with receptacles installed a meter in height have been used and have promoted self-sustainable development of farmers with scarce water resources.
The uniformity of water distribution (UDC) is one of the main parameters for evaluation of drip irrigation and it is crucial for the planning and the operation of the system (BERNARDO et al., 2006). According to GIL et al. (2008), low uniformity of water distribution indicates that the irrigated area receives more water and fertilizer than others, resulting in an not uniform development of plants. The UDC is defined as a measure of water supply which relates to the fourth part of the total area which receives the least water, with the average water depth applied. It is represented by:
100 q
q UDC
med 25%
(1)
In which,
UDC - uniformity of distribution coefficient, %; q25% - average of 25% of the lowest flows, L h-1, and
qmed - average of all flows, L h-1.
According to standards of ASAE EP 458 (ASAE, 2001), the emitters may be classified as: Excellent (> 90%); Good (75-90%); Regular (62-75%); Bad (50-62%) and Unacceptable (<50%).
For having small dimensions, the irrigation by drippers show variations in flow due to construction failure. These variations present a normal distribution, allowing the use of statistical concepts for obtaining quantitative conclusions. The coefficient of variation (C.V.) is found according to the equation:
100
q
s
C.V.
med
(2)In which,
C.V. - coefficient of variation, %, and s - standard deviation, L h-1.
classified according to the C.V. as: Excellent (<5%), Medium (5-7%); Marginal (7-11%), Poor (11 15%) and Unacceptable (> 15%).
For the practice of fertigation, dripping is more usual by applying water in the vicinity of the plants roots, increasing the capacity of nutrients absorption. According to KANG & WAN (2005), this feature minimizes fluctuations in soil water potential allowing crops, such as radish, to develop under optimum conditions of productivity and quality.
This study aimed to evaluate the entire familiar irrigation from NetafimTM, which uses the action of gravity for pressurization, determining the height for the installation of the tank resulting in a more uniform application of water and fertigation. It was also compared the methods to evaluate the uniformity of water distribution proposed by KELLER & KARMELI (1975), and by DENÍCULI et al. (1980).
MATERIAL AND METHODS
The experiment was carried out in the Experimental Center of Agricultural Engineering (NEEA , Núcleo Experimental de Engenharia Agrícola), in Cascavel, state of Paraná, Brazil, in the period from September to December of 2007. The taken area was flattened to obtain the same slope in relation to the water tank.
The set for irrigation is manufactured by the company NetafimTM, model “Kif Net” - Kit of familiar irrigation, which was assembled in two parts for irrigation and fertigation, composed of four driplines with 50 emitters, divided into 15 m long and 0.50 m between the side lines. For the the water supply, a tank with capacity of 200 L was assembled and installed in a height of 3 m, supplying the two independent experiments. Each experiment was submitted to four different treatments ranging from 12, 14, 16 and 18 kPa of pressure. In order to facilitate assessments in each condition, a system was developed consisting of pulleys and a ratchet allowing to scroll vertically a container with a capacity of 30 L, suspended in a timber structure.
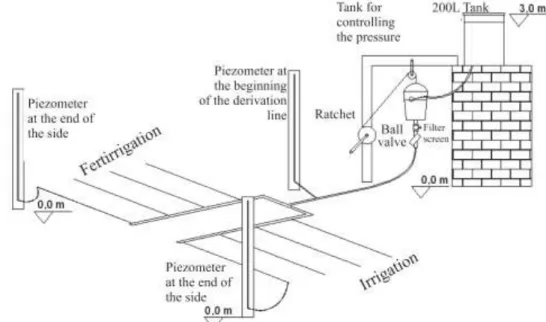
Figure 1 contains the assembly of the experimental system, consisting of a 200 L plastic tank, connected to the container of pressurization controlling, equipped with a float valve, in order to maintain a constant level, a ball valve and a netting filter, followed by the lines of derivation in polyethylene of 20 mm, and driplines. At the beginning of derivation line and at the end of the last side line, piezometers were installed for checking the pressure at the beginning and at the end of the system for monitoring the load drop and correcting possible entry of air into the driplines, which could affect the reading of flow.
The same configuration served the two experiments. However, the difference in assessments of fertigation was in the tank, which was filled with 200 L of water for manual dilution of the fertilizers. The fertilizers were prepared following the recommendations of RIBEIRO et al. (1999) for the bean crop, and they were managed according to procedures by BARRERA (1998).
In order to evaluate the drip irrigation system, two methods were used: by KELLER & KARMELI (1975), with 16 drippers, and by DENÍCULI et al. (1980), with 32 drippers, in a completely randomized design. Three collections with 20 replicates were made for the four treatments in both methods, resulting in 23,040 flow data.
The flow rates were determined by direct process, collecting the volume per 4 minutes controlled with a digital chronometer and at the end of three collections the volume was read in a beaker.
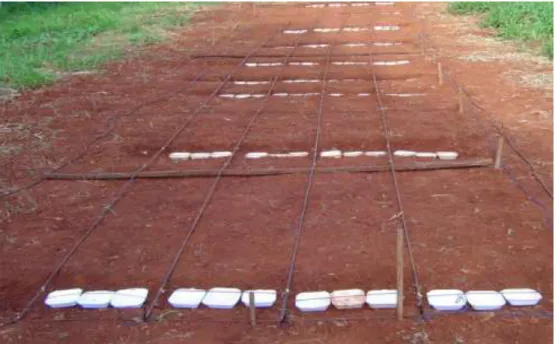
To facilitate the collection, three collectors were installed inside of furrows perpendicularly dug to the side lines, as shown in Figure 2. At the time of the collection, the irrigation system was shifted to drip into the collectors, for this, the tubes were attached to steel rebar (ø 5 mm), distributed along the side lines, attached to a guide wire that bordered the first side. With a small movement on the rope, made every collection, every dripper in assessment simultaneously slid for upon each collector.
FIGURE 2. Setting up the system to collect flow.
The collected data (mL) were recorded on field sheets, transformed into flow (L h-¹) and processed for determining the uniformity of distribution coefficient (eq.(1)), and the coefficient of variation (eq.(2)), along 20 repetitions.
Subsequently, the parameters were compared to determine the statistical differences between the methodologies, and whether the number of samples in each repetition was determinant for evaluating the irrigation systems in the completely randomized experimental design.
RESULTS AND DISCUSSION Irrigation experiments
TABLE 1. Mean values of Flows, UDC (uniformity of distribution coefficient) and CV (coefficient of variation), obtained from the four treatments according to KELLER & KARMELI (1975) for irrigation.
Methodology Treatament (kPa)
Average flow (L h-1)
UDC (%)
C.V. (%)
KELLER & KARMELI (1975)
12 0.588 85.84 - a 11.75 - a 14 0.642 87.72 - b 10.12 - b 16 0.690 89.38 - c 9.03 - c 18 0.738 89.96 - c 8.63 - c Note: Same letters indicate equality of 5%, by Tukey test.
Table 1 shows that treatment of 16 kPa and 18 kPa are statistically equal, indicating a better uniform distribution of water with less variability among the analyzed data, thus, treatment 16 kPa may be recommended, which reduces the amount of material needed to increase the tank, and to promote the economy of water when compensate the areas presenting deficit on irrigation.
According to the standard of classification ASAE EP 458 (2001), for UDC, all treatments fall under the category "good" and the treatment of 16 kPa was close to the category "excellent". Concerning the C.V., the treatments 16 kPa and 18 kPa were classified as "marginal" in accordance to the standard ASAE EP 405.1 (2003).
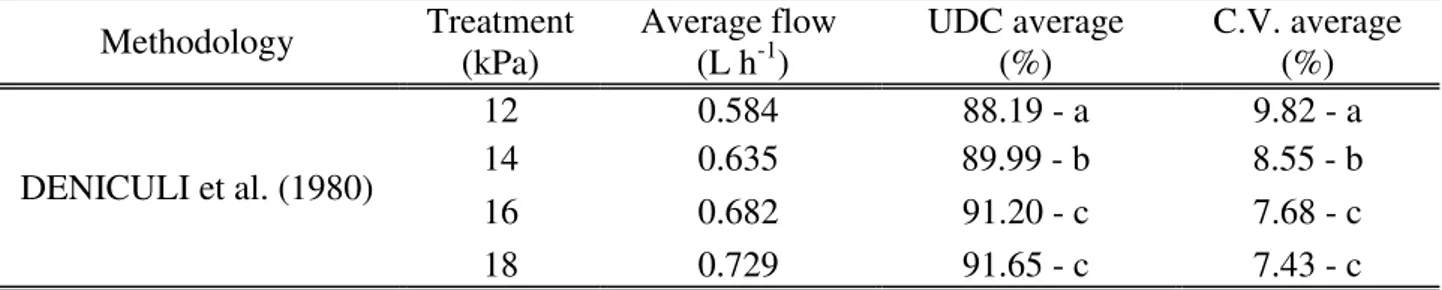
TABLE 1. Mean values of Flows, UDC (Uniformity of Distribution Coefficient) and C.V. (coefficient of variation), obtained from the four treatments according to DENÍCULI et al. (1980).
Methodology Treatment (kPa) Average flow (L h-1) UDC average (%) C.V. average (%)
DENICULI et al. (1980)
12 0.584 88.19 - a 9.82 - a 14 0.635 89.99 - b 8.55 - b 16 0.682 91.20 - c 7.68 - c 18 0.729 91.65 - c 7.43 - c Note: Same letters indicate equality of 5%, by Tukey test.
Table 2 shows that the treatments 16 kPa and 18 kPa are statistically equal for both UDC and for C.V., indicating a better distribution with less variability in these two treatments, falling under the category "excellent" for UDC. For C.V., the four category treatments are "marginal" (7-11%), nevertheless, the treatments 12 kPa and 14 kPa will not be utilized due to their larger C.V. and for being statistically different from the others, indicating an inconsistency in the application of water. This indicates that the change in hydraulic load, even with little variation, results in greater variability of the data.
Hypothesis tests were performed with Student's t test and p-value for assessing the equivalence between both methodologies; in order to do so, all values of UDC and C.V. of the irrigation experiment were compared, which are presented in Table 3.
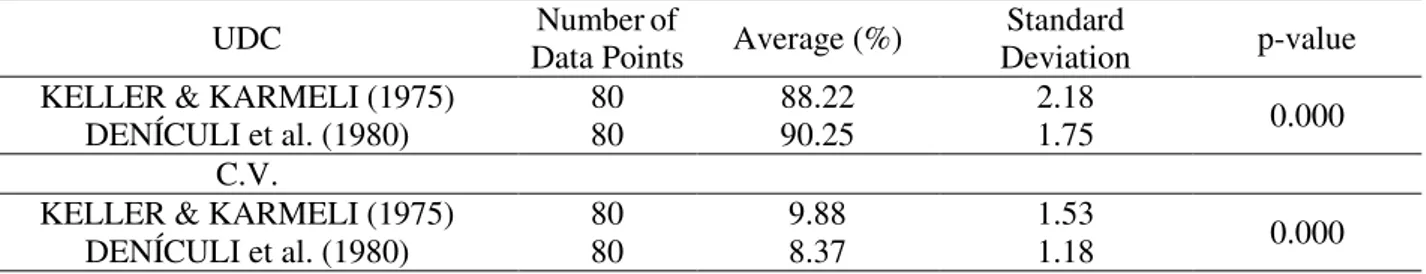
TABLE 2. Descriptive values and p-value for the comparison of the UDC (Uniformity of Distribution Coefficient) and C.V. (Coefficient of Variation) between KELLER & KARMELI (1975) and DENÍCULI et al. (1980) methods for irrigation.
UDC Data Points Numberof Average (%) Deviation Standard p-value
KELLER & KARMELI (1975) 80 88.22 2.18 0.000
DENÍCULI et al. (1980) 80 90.25 1.75
C.V.
KELLER & KARMELI (1975) 80 9.88 1.53
0.000
DENÍCULI et al. (1980) 80 8.37 1.18
Fertigation experiments
The data represented in Tables 4 and 5 correspond to the Mean Flow, UDC and CV of 20 repetitions of the fertigation experiment for the four treatments, after analysis of variance and multiple comparisons by Tukey test at 5% of significance level for the methodologies by KELLER & KARMELI (1975) and by DENÍCULI et al. (1980), respectively.
TABLE 4. Mean values of Flows, UDC (Uniformity of Distribution Coefficient) and C.V. (Coefficient of Variation), obtained from the four treatments according to KELLER & KARMELI (1975) method.
Methodology Treatment
(kPa)
Mean flow
(L h-1) UDC (%) (%) CV
KELLER & KARMELI (1975)
12 0.624 88.28 - a 10.10 - a
14 0.676 89.16 - a 9.55 - a
16 0.728 90.13 - a 8.78 - a
18 0.766 89.20 - a 9.61 - a
Note: Same letters indicate equality of 5%, by Tukey test.
Table 4 shows the quality indicators which are considered equal when the number of irrigation is assessed under this methodology, suffering no interference between the pressures applied in this study. Analyzing under the standards of ASAE (EP 458, 2001 and EP 405.1, 2003), only 16 kPa treatment is considered "excellent" for UDC, and for C.V., all of them fit under the "marginal" category.
TABLE 5. Mean values of Flows, UDC (Uniformity of Distribution Coefficient) and C.V. (Coefficient of Variation), obtained from the four treatments according to DENÍCULI et al. (1980) method.
Methodology Treatment
(kPa)
Mean Flow (L h-1)
UDC (%)
C.V. (%)
DENÍCULI et al. (1980)
12 0.624 89.60 - a 8.94 - a
14 0.671 90.48 - a 8.17 - ab
16 0.727 91.03 - a 7.47 - b
18 0.770 90.30 - a 8.74 - ab
Note: Same letters indicate equality of 5% by Tukey test.
Analyzing the UDC separately, any one of the pressures may be adopted to obtain an irrigation with quality. According to international standards of evaluation, the best treatments were 14; 16 and 18 kPa, which fit under the "excellent"category, with UDC greater than 90%.
different. As all of them have C.V. between 7 and 11%, they are classified as "marginal". Treatment 16 kPa stands out from the others, whose obtained C.V. was 7.47%.
Table 6 presents the hypothesis tests with Student’s t test and p-value, for comparing both methods, considering the fertigation. For this purpose, all the mean values of UDC and C.V. were compared.
TABELA 3. Descriptive values and p-value for the comparison of the UDC (Uniformity of Distribution Coefficient) and C.V. (Coefficient of Variation) between KELLER & KARMELI (1975) and DENÍCULI et al. (1980) for fertigation.
UDC Data Points Number of Average (%) Deviation Standard p-value
KELLER & KARMELI (1975) 80 89.19 2.49 0.001
DENÍCULI et al. (1980) 80 90.35 1.72
C.V.
KELLER & KARMELI (1975) 80 9.51 2.04
0.000
DENÍCULI et al. (1980) 80 8.33 1.65
With P-value lower than 0.050, the obtained results in both methods may not be considered equal, even when compared to the same system simultaneously. The sampling method by DENÍCULI has determined higher irrigation uniformity and lower coefficient of variation when compared to the sampling method by KELLER & KARMELI.
SILVA & SILVA (2005), and VIEIRA et al. (2003) compared both methods and found that in drip irrigation systems, the greater the number of drippers assessed, the more accurate will be the values of UDC, demonstrating that the method by DENÍCULI et al. (1980), despite being a bit more laborious, it has been more appropriate than that by KELLER & KARMELI (1975).
Hypothesis test among experiments of irrigation and fertigation
Hypothesis tests were conducted comparing the mean values among all collected flows in both experiments and for both methodologies of evaluation of irrigation systems, considering 5% of significance level. The tests were performed using the Student's statistical t and p-value, which are shown in Table 7, indicating that the flows are considered to be different for both methods, with 5% of significance level of the t test.
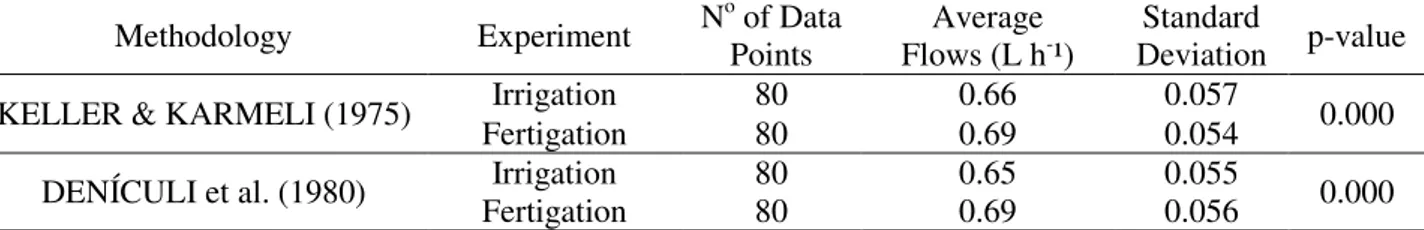
TABLE 4. Descriptive values and p-value for comparison of flow rates of irrigation and fertigation, by means of the methodologies by KELLER & KARMELI (1975) and by DENÍCULI et al. (1980).
Methodology Experiment NoPoints of Data Flows (L hAverage -¹) Deviation Standard p-value
KELLER & KARMELI (1975) Irrigation 80 0.66 0.057 0.000
Fertigation 80 0.69 0.054
DENÍCULI et al. (1980) Fertigation Irrigation 80 80 0.65 0.69 0.055 0.056 0.000
For both KELLER & KARMELI (1975) and DENÍCULI et al. (1980), the fertigation experiment showed higher flow rate, an increase of 4.54% and 6.15% respectively, when compared with the irrigation experiment. LIMA NETO (2006), working with fertilizer concentrated injectors, concluded that the higher the density of solution of fertilizer mixed with irrigation water, the lower will be the flow rates.
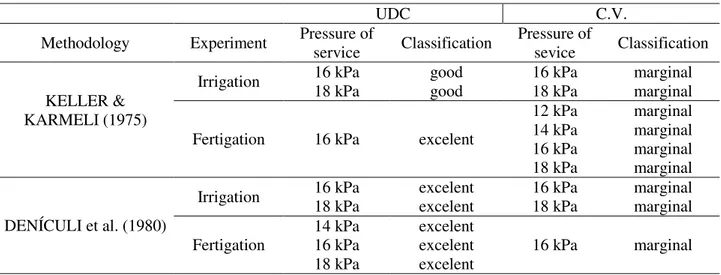
TABLE 5. Summary of the best classifications of UDC (Uniformity of Distribution Coefficient) and C.V. (Coefficient of Variation), among the treatments.
UDC C.V.
Methodology Experiment Pressure of service Classification Pressure of sevice Classification
KELLER & KARMELI (1975)
Irrigation 16 kPa 18 kPa
good good
16 kPa 18 kPa
marginal marginal
Fertigation 16 kPa excelent
12 kPa 14 kPa 16 kPa 18 kPa
marginal marginal marginal marginal
DENÍCULI et al. (1980)
Irrigation 16 kPa 18 kPa excelent excelent 16 kPa 18 kPa marginal marginal
Fertigation
14 kPa 16 kPa 18 kPa
excelent excelent excelent
16 kPa marginal
Table 8 shows that the treatments that had the best performances in irrigation experience occurred at pressures of 16 and 18 kPa, classified in the methodology by DENÍCULI et al. (1980) as and "excellent" coefficient of distribution. However, the coefficient of variation of the flow classified the system as "marginal”. Concerning the fertigation experiment, statistically, the higher values were obtained in the methodology by DENÍCULI et al. (1980), with "excellent" UDC in the pressures of 14, 16 and 18 kPa, and "marginal" C.V. in the pressure of 16 kPa.
CONCLUSIONS
The irrigation set was more uniform for the pressure of 16kPa.
The sampling method by DENÍCULI better classified the irrigation set.
The coefficient of variation classified the set of irrigation as "marginal" for irrigation and fertigation.
The manual dilution of fertilizers in the water has not affected the uniformity of distribution.
REFERENCES
ASAE. AMERICAN SOCIETY OF AGRICULTURAL ENGINEERS. Design and installation of microirrigation systems. St. Joseph: ASAE Standards engineering practices data: EP 405.1, 2003. ASAE. AMERICAN SOCIETY OF AGRICULTURAL ENGINEERS. Field evaluation of micro irrigation Systems. St. Joseph: ASAE Standard engineering practices data: EP 458, 2001. p.792-797.
AZEVEDO, H.J.; BERNARDO, S.; RAMOS, M.M.; SEDIYAMA, G.C.; CECON, P.R. Influência de elementos do clima e da pressão de operação do aspersor no desperdício de água, em um sistema de irrigação por alta pressão. Engenharia Agrícola, Jaboticabal, v.18, n.4, p.53-62, 1999.
BARRERA, L.M. Manual de fertirrigación. La Serena: Instituto de Investigaciones Agropecuarias. Centro Regional de Investigación, 1998.
BERNARDO, S.; SOARES, A.A.; MANTOVANI, E.C. Manual de irrigação. Viçosa, MG: UFV, 2006.
DENÍCULI, W.; BERNARDO, S.; THIÉBAUT, J.T.L.; SEDIYAMA, G.C. Uniformidade de distribuição de água, em condições de campo num sistema de irrigação por gotejamento. Revista Ceres, Viçosa-MG, v.27, n.150, p.155-162, 1980.
GIL, M.; RODRIGUEZ-SINOBAS, L.; JUANA, L.; SANCHEZ, R.; LOSADA, A. Emitter discharge variability of subsurface drip irrigation in uniform soils: effect on water-application uniformity. Irrigation Science, New York, v.26, n.6, p.451-458, 2008.
KANG, Y.; WAN, S. Effect of soil water potential on radish (Raphanus sativus L.) growth and water use under drip irrigation. Scientia Horticulturae, Amsterdam, v.106, p.275-292, 2005. KELLER, J.; KARMELI D. Trickle irrigation design. Glendora: Rain Bird Sprinkler
Manufacturing, 1975.
LACERDA, N.B.; OLIVEIRA, T.S. Agricultura irrigada e a qualidade de vida dos agricultores em perímetros do Estado do Ceará, Brasil. Ciência Agronômica, Jaboticabal, v.38, n.2, p.216-223, 2007.
LIMA NETO, I. E. Formulação adimensional do fluxo em injetores de fertilizantes. Revista Brasileira de Engenharia Agríola e Ambiental, Campina Grande, v.10 n.2, 2006.
NASCIMENTO, J.M.S. Desenvolvimento e avaliação hidráulica de um sistema de gotejamento por gravidade para pequenas propriedades. 2006. 79 f. Dissertação (Mestrado em Engenharia
Agrícola) - Universidade Federal de Lavras, Lavras. 2006.
PIZARRO CABELO, F. Riegos localizados de alta frecuencia: goteo, microaspersión, exudación. 3.ed. Madrid: Ediciones Mundi-Prensa, 1996. 513p.
RIBEIRO, A.C.; GUIMARÃES, P.T.G.; ALVAREZ, V.H. Comissão de fertilidade do solo no estado de Minas Gerais. Recomendações para o uso de corretivos e fertilizantes em Minas Gerais. 5ª Aproximação: Viçosa: CFSEMG, 1999.
SILVA, C.A.; SILVA, C.J. Avaliação de uniformidade em sistemas de irrigação localizada. Revista Científica Eletrônica de Agronomia, São Paulo, v.4, 2005.
SILVA, L.F.D. da. Avaliação de unidades produtivas da agricultura familiar no perímetro irrigado de Sumé, PB. 2006. Dissertação (Mestrado) - Universidade Federal de Campina Grande, Campina Grande, 2006.
SOUZA, I.H.; ANDRADE, E.M. ; SILVA, E.L. Artigo técnico: avaliação de um sistema de
irrigação localizada de baixa pressão, projetado pelo software “BUBBLER”. Engenharia Agrícola, Jaboticabal, v.25, n.1, p.264-271, 2005.