Vol. 10, No. 2, May/Aug., 2013 pp.339-356 ISSN online: 1807-1775
DOI: 10.4301/S1807-17752013000200009
_____________________________________________________________________________________ Manuscript first received/Recebido em 01/03/2012 Manuscript accepted/Aprovado em: 22/12/2012 Address for correspondence / Endereço para correspondência
Jose Marcelo Almeida Prado Cestari, Programa de Pós-graduação em Engenharia de Produção e Sistemas, PUCPR. Rua Imaculada Conceição, 1155. CEP: 80215901 - Curitiba, PR – Brasil. Doutorando em Engenharia de Produção e Sistemas (PUC-PR), mestre e bacharel em informática pela UFPR. Possui certificações PMP, Lead Auditor ISO-9001:2000, ITIL, COBIT, IBM, MCTS e ISF (ISO 27002). E- mail [email protected]
Arthur Maria do Valle, Programa de Pós-graduação em Engenharia de Produção e Sistemas, PUCPR. ISD Brasil – Av. Cidade Jardim, 400 – 7º andar – Edifício Dacon – CEP 01454-902 – São Paulo, SP. Brasil. Doutorando em Engenharia da Produção e Sistemas, PUCPR. Mestre em Informática Aplicada (PUCPR-2002) na área de Engenharia de Software. Formado em Ciência da Computação (PUCPR-1997) e Administração de Empresas (UFPR-2000)
Edson Pinheiro de Lima, Professor do Programa de Pós-graduação em Engenharia de Produção e Sistemas, PUCPR. Graduado em Engenharia Elétrica pela Universidade Tecnológica Federal do Paraná, Mestre também em Engenharia Elétrica na Universidade Estadual de Campinas, Doutor em 2001 pela Universidade Federal de Santa Catarina, na Área de Engenharia de Produção.
Eduardo Alves Portela Santos, Professor do Programa de Pós-graduação em Engenharia de Produção e Sistemas, PUCPR. Graduado em Engenharia Mecânica pela Universidade Federal da Bahia, Mestre em Engenharia Mecânica e Doutor em 2003 pela Universidade Federal de Santa Catarina.
ACHIEVING MATURITY (AND MEASURING PERFORMANCE)
THROUGH MODEL-BASED PROCESS IMPROVEMENT
Jose Marcelo Almeida Prado Cestari Arthur Maria do Valle
Edson Pinheiro de Lima Eduardo Alves Portela Santos
Pontifical Catholic University of Parana, Curitiba, Parana, Brazil
__________________________________________________________________
ABSTRACT
This paper presents the approach adopted by a software development unit in order to achieve the maturity level 3 of CMMI-DEV and therefore obtaining better performance. Through historical research and secondary data analysis of the organization, the paper intends to answer the following research question: "Could the adoption of maturity/best practices models bring better performance results to small and medium organizations?" Data and analysis conducted show that, besides the creation of indicator’s based management, there are some quantitative performance improvements in indicators such as: Schedule Deviation Rate, Effort Deviation Rate, Percent Late Delivery, Productivity Deviation and Internal Rework Rate
Keywords: performance management, CMMI, process improvement, quantitative
1. INTRODUCTION
There is a lot of doubt regarding the benefits of adopting a formal approach (model based) for software development projects. Researchers and academia, which defend the use of a software engineering approach, methodology, best practices, maturity models and so on, are usually criticized by companies and professionals because of the excess of work, process bureaucracy, lack of dedication (no time) of the employees for these kinds of activities (Rocha, 2005), resistance to changes (Fetzner, 2010) and lack of evidenced measures correlating a maturity process and the achievement of performance. In that way, this is a problem that deserves to be studied and verified, since companies are always looking for better productivity, quality, efficiency, etc.
People who are studying and contributing to this question are usually related to research institutes and/or practitioners around the world. Among then, it is possible to cite the Carnegie Mellon University (through one of its branches called SEI – Software Engineering Institute), the Project Management Institute (PMI), the ITSqc (IT Services Qualification Center) and others. They are releasing new models, courses, papers and best practices that help projects to achieve better results around the world, and consolidating the idea that it is a good thing to have an organized and formal process, managed in order to obtain performance (Goldenson and Gibson, 2003)(Gibson, Goldenson and Kost, 2006).
The main purpose of this paper is to investigate whether process maturity brings better operations performance results. In this sense, there is a brief history of the effort to implement the CMMI Level 3 maturity level and the results (in terms of performance measurement) founded in an organization that was formally assessed as CMMI Maturity Level 3. Note that a CMMI appraisal is performed by an authorized company and auditor, which can officially assess maturity levels, according to the rules and procedures created by SEI, and registered in the SCAMPI-Standard CMMI® Appraisal Method for Process Improvement (2011).
The remainder of this paper is as follows: section 2 presents the theoretical background regarding the main theme of our study. Section 3 presents the method and research protocol. Section 4 describes the organization and the organizational unit. Section 5 contains the process improvement history and approach, respectively. In section 6 the results are described and, in section 7, conclusion and future works are presented.
2. THEORETICAL BACKGROUND
In general ways, performance measurement can be basically divided into two periods (Gomes, Yasin, and Lisboa, 2004): the first period (known as the “traditional
been proposed. Among the most widely cited of these PMSs are: the SMART (Cross and Lynch, 1988-1989; Lynch and Cross, 1991), the performance measurement matrix (Keegan et al., 1989), the Balanced Scorecard (Kaplan and Norton, 1992), and the integrated dynamic PMS (Ghalayini et al., 1997).
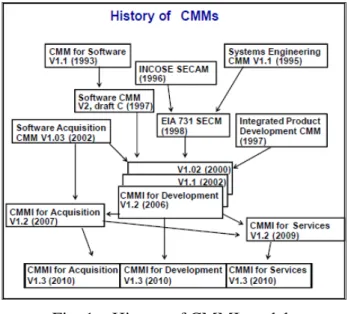
In order to create measurements to other than financial areas, especially because of the increasing IT aspects, some IT frameworks and models were created in the beginning of the 1990’s, and among them, there is the CMM (Capability Maturity Model) and its successor, the CMMI-DEV (Capability Maturity Model Integration for Development), focused on software/systems development. According to CMMI Product Team (2010), CMMI is a maturity model for process improvement and it is a composition of best practices that address development and maintenance activities for the product lifecycle, since its inception until its deployment and maintenance. The model was created basically because of a need from the DoD (Department of Defense – USA). The DoD was dealing with suppliers that were not providing quality (on time, and on budget) software projects and the DoD began a partnership and sponsorship with Carnegie Mellon University, located in Pittsburg. As a result of this collaboration, the Software Engineering Institute (SEI) was created in order to research and develop frameworks, models and good practices, based on the concepts of Crosby (1979), Juran (1988), Deming (1986) and Humphrey (1989). The idea was that the DoD suppliers could follow these practices and be adherent to the model, reducing the risks of poor quality of software development supplied to DoD. The following figure (Fig.1), extracted from CMMI Product Team (2010), illustrates the history of CMMI models:
Fig. 1 – History of CMMI models
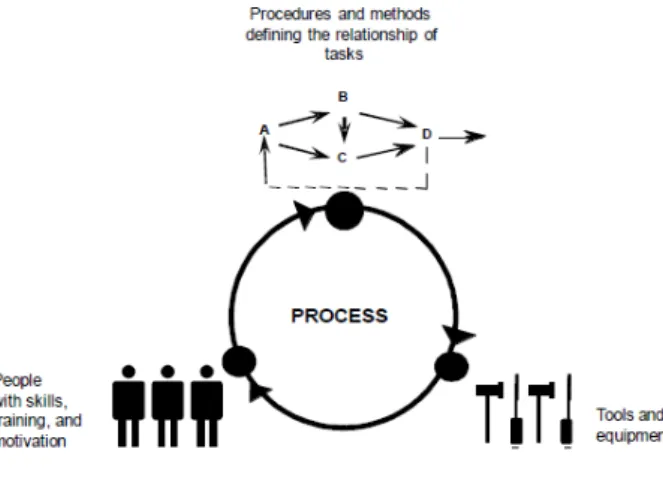
Fig. 2 – Dimensions of a process
The CMMI-DEV model is not a process, but it has a focus on the importance of having a structured process, once that the process is the item that holds everything
together. “Processes allow you to align the way you do business. They allow you to
address scalability and provide a way to incorporate knowledge of how to do things better. Processes allow you to leverage your resources and to achieve process maturity
and analyze business trends”, (CMMI Product Team, 2010).
In one of its representations (called staged), the CMMI-DEV model defines five
maturity levels, as it follows:
Level 1: Initial. Ad hoc and chaotic process. Usually the organization does not
have a stable environment and the success of the projects depends on the
“heroism” and competence of the employees. The organizations are hardly able to repeat the past success of projects.
Level 2: Managed. Requirements and the projects are managed. There are measurement analysis, control and planning of the activities. There is a process for managing projects, including the organization of the work products and its control. The management team has visibility about the status, and the stakeholders involved are also managed and there is a commitment established with them.
Level 3: Defined. Well understood, defined and formalized process for the organization. They are formally described and the use of patterns, procedures, tools and methods are institutionalized. Engineering processes are also enforced in this level.
Level 4: Quantitatively Managed. Some processes are chosen so they can be statistically and quantitatively controlled and managed. Special causes of variation in the process are identified and analyzed.
Level 5: Optimizing. The processes are continually improved through incremental actions and innovations. Quantitative objectives are established and reviewed for the process improvement. Focus on analysis of common causes of variation.
organization must be compliant with the PAs of Level 2 and Level 3. There are a total of 22 PAs (considering all maturity levels), distributed as following:
Level 2:
Requirements Management (REQM) Project Planning (PP)
Project Monitoring and Control (PMC) Supplier Agreement Management (SAM) Measurement and Analysis (MA)
Process and Product Quality Assurance (PPQA) Configuration Management (CM)
Level 3:
Decision Analysis and Resolution (DAR) Integrated Project Management (IPM) Organizational Process Definition (OPD) Organizational Process Focus (OPF) Organizational Training (OT) Product Integration (PI)
Requirements Development (RD) Risk Management (RSKM) Technical Solution (TS) Validation (VAL) Verification (VER)
Level 4:
Organizational Process Performance (OPP) Quantitative Project Management (QPM)
Level 5:
Organizational Performance Management (OPM) Causal Analysis and Resolution (CAR)
3. METHODOLOGY AND RESEARCH PROTOCOL
The following research question was defined: “Do the adoption of maturity/best
practices models bring better performance results to small and medium-sized
organizations?”
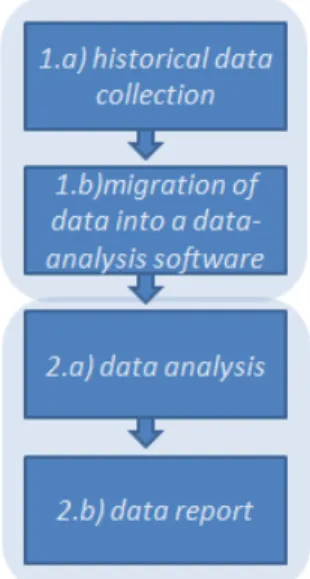
conducted. As a field study, this research has two phases, a) historical data collection and b) data analysis and report, and four activities, as can be seen in figure 3:
Fig. 3 – Research Methodology
Since the organization had a performance measurement repository, data collection was merely the gathering of historical data and migration of it into a data-analysis software tool. In terms of the data-analysis, as part of the organization´s performance measurement repository, there are measures that can also be used to measure the progress and benefits of the process improvement program. These measures were applied to legacy software development projects as well as to new projects that
used the organization’s CMMI-based processes and assets. In this sense, some project-based indicators were selected and analyzed via control charts – in terms of mean and variation improvement rates: Schedule Deviation Rate (%); Effort Deviation Rate (%); Productivity Deviation (%); %Late Delivery (%); and Internal Rework Rate (%).
4. CASE DESCRIPTION: ORGANIZATION (COMPANY) AND
ORGANIZATIONAL UNIT
Sofhar Gestão & Tecnologia S.A. is a Brazilian company located in Curitiba (capital city of Paraná state). Sofhar was founded in 1986 and since then it has helped its clients to achieve success in national and international markets. Sofhar is specialized in diagnosing and solving problems, seeking solutions through the application of best practices in technology and business management.
Sofhar has a complete structure to meet market needs and these demands are met by providing the following offers (through services and products): Consultancy, Software Development, Infrastructure, Training and Product Sales and Licensing.
senior manager, and operate under the same policies”(CMMI Product Team, 2010). In
this sense, the organization is the Software Development Area, not the entire company. Software Development Area is composed by 15 people, including the area manager and those individuals directly working with software development. Together they implement the roles and processes such as EPG-Engineering Process Group, CCB-Control Change Board, QA-Quality Assurance, organizational training, process improvement, and so on, according to the needs and requirement of each CMMI maturity level.
The organization unit implemented a balanced PMS (as shown in Fig. 4) in order to measure its processes and results during (and after) a software development project. The measures - for projects and for the organization - were created basically according to the structure, recommendations and relevance proposed in Neely at al. (1997), and also according to the (best) practices specified in the Measurement and Analysis PA of the Level 2:
Establish and maintain measurement objectives derived from identified information needs and objectives
Specify measures to address measurement objectives
Specify how measurement data are obtained and stored.
Specify how measurement data are analyzed and communicated.
Obtain specified measurement data.
Analyze and interpret measurement data.
Manage and store measurement data, measurement specification, and analysis results.
Communicate results of measurement and analysis activities to all relevant stakeholders.
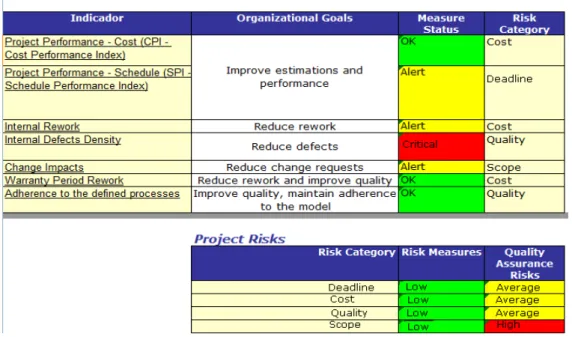
Fig. 4 – Project Measures Dashboard
In that dashboard it is possible to see, for each indicator, the related organizational goal, the measure status and associated risk category. The status is usually represented in colors, where green stands for “ok”, yellow for “alert” and red for “critical”. In case of a “red light”, some corrective actions are expected in the project.
All measures were defined and are managed according to a “measure framework”,
containing, among other items: name of the measure, goal, unity (e. g., days, hours), formula, procedures for analysis, those who measure, those who collect, frequency of measurement, frequency of analyses and so on.
All of these project measures are associated with a risk category (cost, deadline, quality, scope) in order to the management be able to have a general view regarding organizational risks and performance.
5. PROCESS IMPROVEMENT HISTORY AND PROGRAM APPROACH
In September 2008 the software development area began a CMMI-based process improvement program in order to enhance the quality of its software projects (and products), especially to achieve more predictability and improve indicators such as SPI (Schedule Performance Index) and CPI (Cost Performance Index). The SEI partner called ISD Brasil helped Sofhar to achieve its goals, as a consultancy company in the program.
As part of the program approach, the partnership with ISD brought agility to Sofhar, especially because it was agreed between both companies that effort and schedule dedicated to process definition phase (writing processes, creating templates
and putting all together) should be minimized. One of Sofhar’s business goals was to
In order to help Sofhar with this goal, ISD proposed a new approach called “ISD CMMI PME”, where PME stands for small and medium-sized business, in Portuguese.
After a (initial) SCAMPI C event (where a gap analysis was made and data about the Organizational Unit was raised) ISD took its historical information about processes (common indicators, common workflows and so on) and tailored (together with Sofhar) its set of organizational process assets considering Sofhar´s context and needs.
These assets are based on ISD´s processes descriptions and templates that cover all CMMI level 3 process areas and were specially designed for micro and small organizations. After few interactions between the companies, the process definition phase was declared finished and Sofhar was ready to use its new organizational processes and assets for software development projects. Some pilot projects were conducted and, in the sequence, another number of projects were conducted using the processes. Meanwhile, ISD provided consultancy in order to verify Sofhar’s progress towards CMMI ML 3 compliance. In this sense, some events, including a preparatory SCAMPI class B, were conducted.
Concerning to continuous improvement activities and culture, Sofhar´s assets have naturally evolved (organizational unit is using the sixteenth baseline of its process). In fact, Sofhar had an enormous gain of time, effort and knowledge using the processes and templates delivered by ISD.
6. RESULTS AND BENEFITS
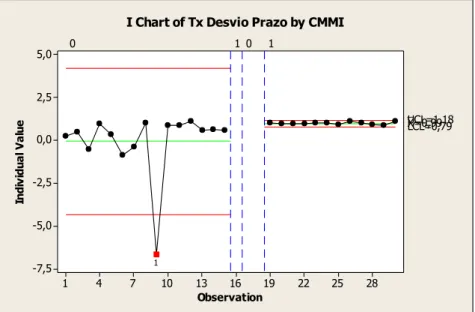
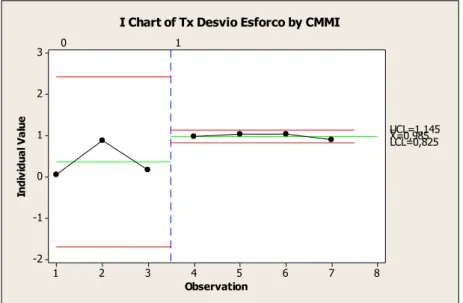
As stated before, in order to address our research question, comparisons of mean (green line in graphics from Fig. 5 to 14) and variation (distance between red lines in each segment in graphics from Fig. 5 to 14) improvement rates in the following two scenarios were performed:
Scenario a) all completed development projects before (09 projects) and after (21 projects) CMMI-based process institutionalization and
Scenario b) .Net completed development projects before (3 projects) and after (5 projects) institutionalization of CMMI-based process in the organization, including also projects conducted after being formally assessed as CMMI Level 3.
Although the “before/after” effects are not statistically proven yet, due to small
sampling, there are some measurable benefits related to these indicators. Note that each dot represents a project and projects were plotted in chronological order.
Observation In d iv id u a l V a lu e 28 25 22 19 16 13 10 7 4 1 5,0 2,5 0,0 -2,5 -5,0 -7,5 _ X=0,99 UCL=1,18 LCL=0,79
0 1 0 1
1
I Chart of Tx Desvio Prazo by CMMI
Fig. 5 – Schedule Deviation Rate for scenario a)
Observation In d iv id u a l V a lu e 28 25 22 19 16 13 10 7 4 1 2,5 2,0 1,5 1,0 0,5 0,0 -0,5 -1,0 _ X=1,001 UCL=1,181 LCL=0,821
0 1 0 1
I Chart of Tx Desvio Esforco by CMMI
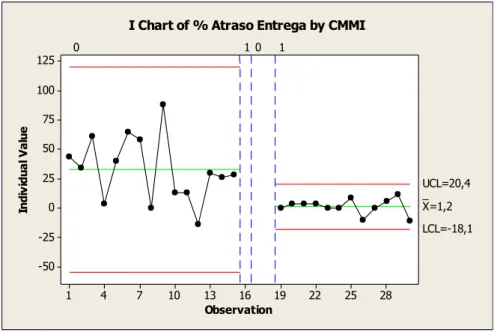
Observation In d iv id u a l V a lu e 28 25 22 19 16 13 10 7 4 1 125 100 75 50 25 0 -25 -50 _ X=1,2 UCL=20,4 LCL=-18,1
0 1 0 1
I Chart of % Atraso Entrega by CMMI
Fig. 7 – %Late Delivery for scenario a)
Observation In d iv id u a l V a lu e 28 25 22 19 16 13 10 7 4 1 1,5 1,0 0,5 0,0 -0,5 -1,0 _ X=0,006 UCL=0,254 LCL=-0,242 0 1
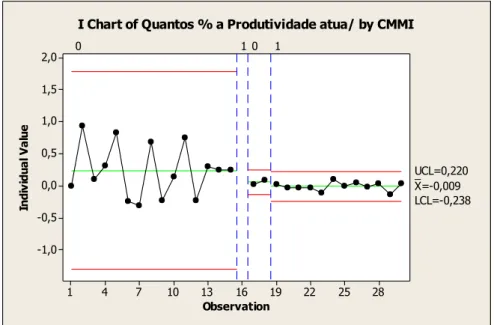
Observation In d iv id u a l V a lu e 28 25 22 19 16 13 10 7 4 1 2,0 1,5 1,0 0,5 0,0 -0,5 -1,0 _ X=-0,009 UCL=0,220 LCL=-0,238
0 1 0 1
I Chart of Quantos % a Produtividade atua/ by CMMI
Fig. 8 – Productivity Deviation for scenario a)
Observation In d iv id u a l V a lu e 28 25 22 19 16 13 10 7 4 1 60 50 40 30 20 10 0 -10 -20 -30 _ X=6,27 UCL=24,79 LCL=-12,25
0 1 0 1
1
I Chart of % Retrabalho Interno by CMMI
Fig. 9 – Internal Rework Rate for scenario a)
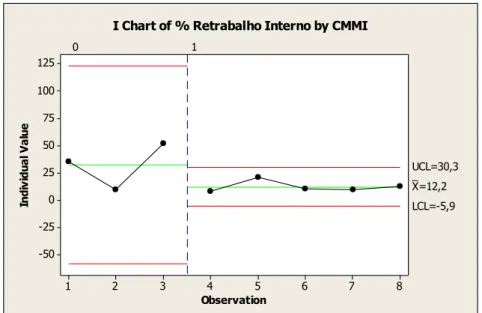
Observation In d iv id u a l V a lu e 8 7 6 5 4 3 2 1 125 100 75 50 25 0 -25 -50 _ X=12,2 UCL=30,3 LCL=-5,9 0 1
I Chart of % Retrabalho Interno by CMMI
Fig. 10 – Internal Rework Rate for scenario b)
Observation In d iv id u a l V a lu e 8 7 6 5 4 3 2 1 3 2 1 0 -1 -2 -3 _ X=0,788 UCL=1,593 LCL=-0,017 0 1 1
I Chart of Tx Desvio Prazo by CMMI
Observation In d iv id u a l V a lu e 8 7 6 5 4 3 2 1 3 2 1 0 -1 -2 _ X=0,985 UCL=1,145 LCL=0,825 0 1
I Chart of Tx Desvio Esforco by CMMI
Fig. 12 – Effort Deviation Rate for scenario b)
Observation In d iv id u a l V a lu e 8 7 6 5 4 3 2 1 125 100 75 50 25 0 -25 -50 _ X=9,5 UCL=51,9 LCL=-32,9 0 1 1
I Chart of % Atraso Entrega by CMMI
Observation
In
d
iv
id
u
a
l
V
a
lu
e
8 7 6 5 4 3 2 1 3
2
1
0
-1
-2
_ X=0,019 UCL=0,186 LCL=-0,148
0 1
I Chart of Quantos % a Produtividade atua/ by CMMI
Fig. 14 – Productivity Deviation for scenario b)
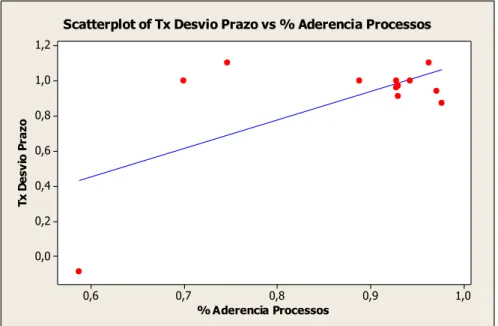
In addition to the analysis above, it was also investigated some correlation between performance measures and the process adherence indicator, which measures the percentage of process items that were followed by the project. In this analysis, the following correlation was obtained (Fig. 15):
% Aderencia Processos
T
x
D
e
s
v
io
P
ra
z
o
1,0 0,9
0,8 0,7
0,6 1,2
1,0
0,8
0,6
0,4
0,2
0,0
Scatterplot of Tx Desvio Prazo vs % Aderencia Processos
Fig. 15 – Effort Deviation Rate x Process Adherence correlation
7. CONCLUSION, LIMITATIONS AND FUTURE WORK
In summary, this paper considered the following theoretical elements and guidelines in order to achieve the research project purposes:
First measurement systems were focused basically on costs management.
After the 1980’s, measurement systems became more multidisciplinary,
considering other issues in addition to financial aspects.
IT solutions became more available.
In order to address other areas besides the financial one, some quality and maturity models were created and became a reference for measuring other operational areas such as software development and software engineering. One of these models was the CMM (later evolved to CMMI).
The implementation of processes that complies with the CMMI model can give a certain level of maturity to an organization.
Maturity levels can bring better performance results to an organization.
Based on the improvement rates of mean and variation of each selected measure in table 1 – where for the majority of indicators an improvement rate range of 20 to 100% was achieved – it is possible to conclude that, at least for Sofhar, a more mature process, with disciplined and managed activities, and compliant with CMMI-DEV Level 3, reveals an improvement of software development project performance results, such as quality, effort, rework, productivity and schedule. Additionally, a relevant correlation between one of the performance results and adherence to the defined processes was also obtained, which corroborates the idea of having (and following) a good process which drives you to a good performance.
Tab. 01 – improvement rates of mean and variation
Apart from the quantitative benefits obtained, there are, among others, at least the following limitations in this research:
Only one organization was studied, so it is not possible to do a generalization of benefits and results.
The number of projects assessed is not so high.
No cost measures were available.
The company didn’t measure (at that time) human factor variables.
(Hazzan and Tomayko, 2004). So, it is also important to mention that there are other variables (especially regarding to human factors) that can influence performance, and these variables must be (when possible) analyzed together with more technical issues. Unfortunately, as mentioned before, the organization didn’t have measurements or
indicators regarding human factors, so it was not possible to check this kind of influence in the correlation analysis.
For future work, a deeper analysis on the performance measure database (also including human factors variables) could be conducted in order to discover, quantify and prove cause-effect relationships that will be a basis to create and use process performance models to better estimate and quantitatively manage development projects as well as organizational performance.
REFERENCES
CMMI Product Team. (2010), “CMMI® for Development, Version 1.3”. Technical
Report – Software Engineering Institute (SEI). Retrieved from
http://www.sei.cmu.edu/library/abstracts/reports/10tr033.cfm
Crosby, Philip B. (1979), “Quality Is Free: The Art of Making Quality Certain”. New
York: McGraw-Hill.
Cross, K.F. and Lynch, R.L. (1988-1989), “The SMART way to define and sustain
success”, National Productivity Review, Vol. 9 No. 1, pp. 23-33.
Deming, W. Edwards. (1986), “Out of the Crisis”. Cambridge, MA: MIT Center for
Advanced Engineering.
Fetzner, M. A. M. (2010), “Mudança, Afetividade e Resistência: uma perspectiva no
âmbito individual para compreender a implementação de Sistemas de Informação nas organizações". PhD thesis. UFRGS.
Ghalayini, A.M., Noble, J.S. and Crowe, T.J. (1997), “An integrated dynamic
performance measurement system for improving manufacturing competitiveness”,
International Journal of Production Economics, Vol. 48 No. 3, pp. 207-25.
Gibson, D. L., Goldenson , D. R., Kost, K., (2006), “Performance Results of CMMI® -
Based Process Improvement”, Carnegie Mellon University: Software Engineering Institute.
Goldenson , D. R., Gibson, D. L. (2003), “Demonstrating the Impact and Benefits of
CMMI®: An Update and Preliminary Results”, Carnegie Mellon University: Software
Engineering Institute.
Gomes, C. F., Yasin, M. M., and Lisboa, J. V. (2004), “A literature review of manufacturing performance measures and measurement in an organizational context: a
framework and direction for future research”, Journal of Manufacturing Technology
Management, Vol. 15, No. 6, pp. 511-530.
Hazzan, O., Tomayko, J. (2004), "Human Aspects of Software Engineering: The Case of Extreme Programming". LNCS, 2004, Volume 3092/2004, pp. 303-311.
Humphrey, Watts S. (1989), “Managing the Software Process”. Reading, MA: Addison -Wesley.
Kaplan, R.S. and Norton, D.P. (1992), “The balanced scorecard: measures that drive performance”, Harvard Business Review, Vol. 70 No. 1, pp. 71-9.
Keegan, D.P., Eiler, R.G. and Jones, C.R. (1989), “Are your performance measures
obsolete?”, Management Accounting, Vol. 71, pp. 45-50.
Lynch, R.L. and Cross, K.F. (1991), Measure up: The Essential Guide to Measuring
Business Performance, Mandarin, London.
Neely, A., Richards, H., Mills, J., Platts, K. and Bourne, M. (1997), “Designing
performance measures: a structured approach”, International Journal of Operations &
Production Management, Vol. 17 No. 11, pp. 1131-1152.
Robbins, S. P. (2005), "Comportamento Organizacional". São Paulo: Prentice Hall.
Rocha, A. R. et al. (2005), “Fatores de Sucesso e Dificuldades na Implementação de Processos de Software Utilizando o MR-MPS e o CMMI”, Pro Quality. Retrieved from
http://www.cos.ufrj.br/~savio/Arquivos/W2MPSBR/rocha_et_al_2005.pdf.
Standard CMMI Appraisal Method for Process Improvement (SCAMPI) A, Version 1.3 (2011): Method Definition Document. Retrieved from