Heating, Ventilating and Air Conditioning Systems Control
Based in the Predicted Mean Vote Index
Eusébio Z. E. Conceição*. Mª Manuela J. R. Lúcio**
*Faculty of Sciences and Technology, University of Algarve, Gambelas Campus, 8005-139 Faro, Portugal (Tel: 00351 289800900; e-mail: [email protected]).
**Vertical Grouping of Schools Professor Paula Nogueira, Rua da Comunidade Lusíada, 8700-248 Olhão, Portugal (e-mail: [email protected])
Abstract: In this work a numerical model, which simulates the buildings thermal response and evaluates
the indoor environment comfort, in transient conditions, is used in the application of Heating, Ventilating and Air Conditioning (HVAC) systems control, based in the Predicted Mean Vote (PMV) index, in the energy and thermal comfort performance in a kindergarten school building, in the South of Portugal, in Winter conditions. In the control the PMV index, based in the mean air temperature, the mean air velocity, the mean air relative humidity, the mean radiant temperature, the clothing level and the activity level, are used. In the numerical simulation of the kindergarten, the 25 compartments, the 498 building main bodies and the 42 windows glasses, as well as two schools and three residential surrounding main buildings, are considered.
Keywords: HVAC Systems, Control strategies, PMV index, Thermal-physiology, Thermal comfort.
1. INTRODUCTION
In the Algarve region, in the South of Portugal, with Mediterranean characteristics, in Summer conditions, the external air temperature values are very high and the solar radiation is also very high, while in Winter conditions the external air temperature values are relatively low and the solar radiation is relatively high. During Spring and Autumn conditions the external air temperature values and the solar radiation are moderate. In general, during Summer conditions the air conditioning system is used, during Winter conditions the heating system is used, while during Spring and Autumn conditions the ventilating system is used.
In general, in the HVAC systems control the internal air temperature is used, however in other systems more environmental variables, like simultaneously internal air temperature and relative humidity, are used. The recent HVAC systems, in order to improve the occupant’s thermal comforts levels and reduce the energy consumption level, include the control of more environmental variables. In this work, made in Winter conditions, the heating system control, based in the PMV index, is evaluated using the internal air temperature, velocity and relative humidity and mean radiant temperature, clothing level and activity level. This control methodology, simulated by a numerical model that forecasts the building thermal behaviour, is applied in a kindergarten in a work day with a real occupation cycle and with a ventilation philosophy with natural renovation by infiltrations.
In order to evaluate the thermal comfort level in moderate environments equipped with air-conditioning systems, either in cold or in warm climates, during Winter or Summer conditions, the PMV (Predicted Mean Vote) and the PPD (Predicted Percentage of Dissatisfied) indexes are used (Fanger, 1970 or ISO 7730, 2005). For acceptable thermal comfort conditions, the ISO 7730 (2005) defines three comfort categories (A, B and C), establishing limits for PMV and PPD indexes. This classification allows the selection a priori of one thermal environment according to the required demands.
This kind of building thermal numerical model has been developed in the last years by several authors. In the numerical study of buildings thermal behaviour, for example, Ozeki et al. (1992), Cammarata et al. (1994), Mendes and Santos (2001) and Strand et al. (2001), present some studies applied to similar complex situations than the one here presented in this paper.
2. NUMERICAL MODEL
The multi-nodal buildings thermal behaviour model (see details in Conceição (2003), Conceição et al. (2004) and Conceição et al. (2006)), that works in transient conditions, is based in energy and mass balance integral equations. The energy balance integral equations are developed for the air (inside the several compartments and ducts system), the different windows glasses, the interior bodies (located inside the several spaces) and the different layers of the building main bodies and ducts system, while the mass balance integral equations are developed for the water vapour (inside
the several spaces, ducts system and in the interior surfaces) and air contaminants (inside the several spaces and ducts system). In the resolution of this equations system the Runge-Kutta-Fehlberg method with error control is used. The model considers the conductive, convective, radiative and mass transfer phenomena. The conduction is verified in the building's main bodies (doors, ceiling, ground, walls, etc.) and ducts system (fluid transport) layers. In the convection the natural, forced and mixed phenomena are considered, while in the radiation, verified inside and outside the building, the short-wave (the real distribution of direct solar radiation in external and internal surfaces) and long-wave (heat exchanges between the building’s external surfaces and the surrounding surfaces and among the internal surfaces of each space) phenomena are considered. In the radiative calculus the shading effect caused by the surrounding surfaces and by the internal surfaces is considered.
3. SIMPLIFIED BUILDING GEOMETRY
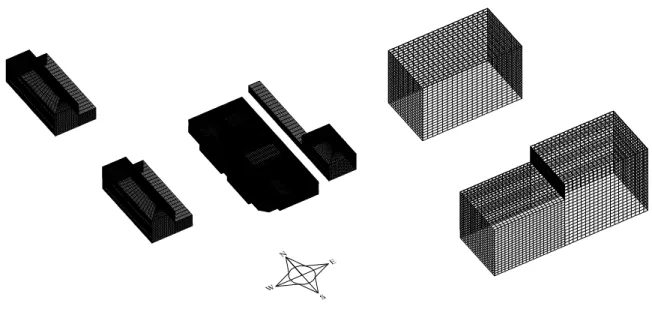
In the analyzed kindergarten building (see Figure 1), divided in 24 compartments (see identification in figure 2), 498 building main bodies and 42 windows glasses are considered. This building, located in Olhão, has three classrooms, for 3, 4 and 5 years old children, and other spaces for offices, administrative, WC, teachers and non-teachers staff and meeting room.
In Figures 1 the grid generation used in the numerical simulation of the kindergarten school building is presented. This numerical grid, used in the internal and external direct solar radiation determination, was spaced 30 cm in both directions.
Fig. 1. Grid generation in the kindergarten building and surrounding buildings.
Fig. 2. Identification of the indoor compartment of the kindergarten building.
4. HEATING SYSTEM CONTROL
In the control of the heating system the PMV index is used. This control methodology is based in the calculation of the internal air temperature, air velocity, air relative humidity and mean radiant temperature values, to a predefined human clothing and activity levels.
The heating system is connected at PMV values less than 0 and gets disconnected at PMV values higher than 0. The linear variation of the heating power, used in this work, change between the zero value, for PMV equal to 0, and the maximum values, for PMV equal to -3.
Using this methodology it is possible to guarantee acceptable thermal comfort conditions with low energy consumption level. Nevertheless, other control methodology, with different strategies, can be applied.
5. RESULTS AND DISCUSSION
In this study, the numerical software that simulates the building thermal response, with complex topology, in transient conditions, and evaluates the indoor thermal comfort and indoor air quality levels is used. This software was validated in Winter conditions (Conceição et al., 2004) and Summer conditions (Conceição and Lúcio, 2006), in school buildings with complex topology. Nevertheless, in this work, before the evaluation of occupants’ thermal comfort conditions, the software is also validated, in the present kindergarten building, with surrounding buildings presence.
In this numerical model simulation the doors and windows were closed, the indoor curtains were open, the air-conditioning systems were on, the occupation is not considered and the indoor radiative heat exchanges were also not considered. The air mean renovation values inside each compartment by infiltration were experimentally obtained, in several compartments, using the tracer gas concentration method. In the school buildings numerical simulation, in order to evaluate the real building’s thermal inertia, the previous 5 days were also simulated.
The input data in the software are:
- the buildings geometry (introduced in a three-dimensional design software);
- the boundary conditions;
- the materials thermal proprieties;
- the outdoor environmental and geographical conditions;
- the initial conditions;
- the occupation cycle;
- the occupant’s clothing level;
- the occupant’s activity level;
- the air ventilation topologies.
The input data, associated to the building’s geometry, were numerically used by the model in the development of an energy and mass integral equations system.
The external environmental variables used as input data, namely the air temperature and air relative humidity, were experimentally measured in a Winter typical day, in 21st December 2007. This experimental test was made in a day without external wind.
The considered clothing and the activity level in Winter conditions are, respectively, 1 Clo. and 1.2 Met.
The occupation cycle, that each space is subjected (numbers 3, 13 and 16, for classrooms, number 10 for playground, number 7 for office and number 18 for kitchen), is simulated between the 8h00 to the 18h00, while the heating system is on between the 7h00 and the 18h00. The classroom number 3 has 27 occupants, between the 9h00 and 12h00 and between
the 13h00 and 15h00, while the other classrooms number 13 and 16 has 22 occupants between the 9h00 and 12h00 and between the 13h00 and 15h00. The playground number 10 has 30 occupants between the 8h00 and 9h00, 68 occupants between the 12h00 and 13h00 and 20 occupants between the 15h00 and the 18h00. The office number 7 has 2 occupants between the 9h00 and 12h00 and 4 occupants between the 15h00 and 16h30. The kitchen number 18 has 2 occupants between the 8h00 and 13h00 and 1 occupant between the 13h00 and the 18h00.
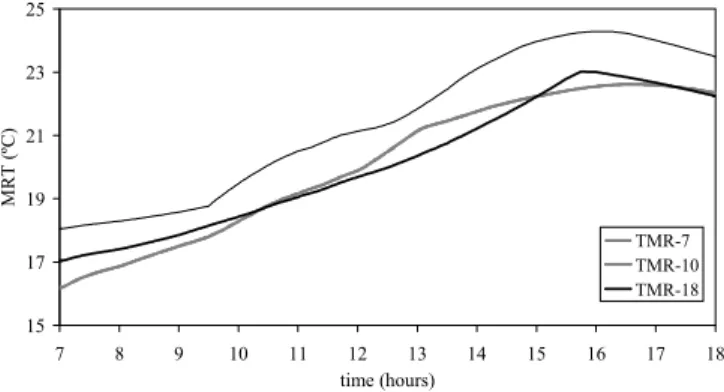
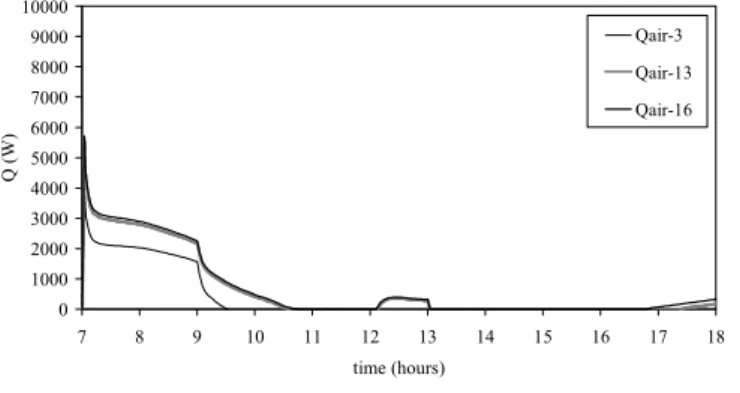
In figures 3 and 4 the evolution of air temperature is presented, in figures 5 and 6 the evolution of air velocity is presented, in figures 7 and 8 the evolution of air relative humidity is presented, in figures 9 and 10 the evolution of air mean radiant temperature is presented, in figures 11 and 12 the evolution of heating power is presented, in figures 13 and 14 the PMV index is presented and in figures 15 and 16 the evolution of PPD is presented. The figures 3, 5, 7, 9, 11, 13 and 15 are associated to the classroom spaces, while the figures 4, 6, 8, 10, 12, 14 and 16 are associated to other spaces. 18 19 20 21 22 23 24 25 26 27 28 7 8 9 10 11 12 13 14 15 16 17 18 time (hours) T ( ºC) Tair-3 Tair-13 Tair-16
Fig. 3. Evolution of air temperature, T, inside the classrooms.
18 19 20 21 22 23 24 25 26 27 28 7 8 9 10 11 12 13 14 15 16 17 18 time (hours) T ( ºC) Tair-7 Tair-10 Tair-18
Fig. 4. Evolution of air temperature, T, inside other occupied spaces.
In accord to the previous results is possible to verify that the internal air temperature increases with the heating system, the occupants presence and the solar radiation incidence. The air velocity is high when the heating system is connected due to
the recirculation airflow. The air relative humidity decreases when the air temperature increases and increases when the air temperature decreases. The mean radiant temperature, in general, increases (more than 6 ºC) during the simulation day.
0,02 0,04 0,06 0,08 0,1 0,12 7 8 9 10 11 12 13 14 15 16 17 18 time (hours) V (m/ s) Vair-3 Vair-13 Vair-16
Fig. 5. Evolution of air velocity, V, inside the classrooms.
0,02 0,04 0,06 0,08 0,10 0,12 7 8 9 10 11 12 13 14 15 16 17 18 time (hours) V (m/ s) Vair-7 Vair-10 Vair-18
Fig. 6. Evolution of air velocity, V, inside other occupied spaces. 35 40 45 50 55 60 65 70 75 7 8 9 10 11 12 13 14 15 16 17 18 time (hours) RH ( % ) RHair-3 RHair-13 RHair-16
Fig. 7. Evolution of air relative humidity, RH, inside the classrooms. 35 40 45 50 55 60 65 70 75 7 8 9 10 11 12 13 14 15 16 17 18 time (hours) RH ( % ) RHair-7 RHair-10 RHair-18
Fig. 8. Evolution of air relative humidity, RH, inside other occupied spaces. 15 17 19 21 23 25 7 8 9 10 11 12 13 14 15 16 17 18 time (hours) MR T ( ºC) TMR-3 TMR-13 TMR-16
Fig. 9. Evolution of mean radiant temperature, MRT, inside the classrooms. 15 17 19 21 23 25 7 8 9 10 11 12 13 14 15 16 17 18 time (hours) MR T ( ºC) TMR-7 TMR-10 TMR-18
Fig. 10. Evolution of mean radiant temperature, MRT, inside other occupied spaces.
The heating power, in general is highest in the morning and decrease until the beginning of the afternoon. The highest heating power is verified in the playground, while the lowest heating power is verified in the office and the kitchen.
The PMV, in general, during the occupation time, changes between the -0.7 and the 0.7 (recommended variation interval by ISO 7730 (2005) for the category C): in the morning, when the heating system is on, by negative PMV, and in the afternoon, when the heating system is off, by positive PMV. The occupants of the classroom number 3, facing South, due the incident direct solar radiation and the occupation level, mainly in the beginning of the afternoon, are subjected to uncomfortable conditions, by positive PMV values, with higher values than the acceptable comfort recommendations proposed by the ISO 7730 (2005), for the category C (PPD <15 %). 0 1000 2000 3000 4000 5000 6000 7000 8000 9000 10000 7 8 9 10 11 12 13 14 15 16 17 18 time (hours) Q ( W ) Qair-3 Qair-13 Qair-16
Fig. 11. Evolution of heating power, Q, in the classrooms.
0 1000 2000 3000 4000 5000 6000 7000 8000 9000 10000 7 8 9 10 11 12 13 14 15 16 17 18 time (hours) Q ( W ) Qair-7 Qair-10 Qair-18
Fig. 12. Evolution of heating power, Q, in the other occupied spaces. -1,4 -0,7 0 0,7 1,4 7 8 9 10 11 12 13 14 15 16 17 18 time (hours) PMV PMV-3 PMV-13 PMV-16
Fig. 13. Evolution of PMV index in the classrooms.
-1,4 -0,7 0 0,7 1,4 7 8 9 10 11 12 13 14 15 16 17 18 time (hours) PM V PMV-7 PMV-10 PMV-18
Fig. 14. Evolution of PMV index in the other occupied spaces. 0 5 10 15 20 25 30 7 8 9 10 11 12 13 14 15 16 17 18 time (hours) PPD ( % ) PPD-3 PPD-13 PPD-16
Fig. 15. Evolution of PPD in the classrooms.
0 5 10 15 20 25 30 7 8 9 10 11 12 13 14 15 16 17 18 time (hours) PPD ( % ) PPD-7 PPD-10 PPD-18
Fig. 16. Evolution of PPD in the other occupied spaces.
6. CONCLUSIONS
In this work the application of Heating, Ventilating and Air Conditioning systems control, based in the Predicted Mean Vote (PMV) index, is made. A numerical model, which simulates the buildings thermal response and evaluates the indoor environment comfort, in transient conditions, is applied.
The control methodology, presented in this study, guarantees, in general, acceptable thermal comfort conditions in all occupied spaces. The heating system worked only for negative PMV values and the heating power increase when the negative PMV values increases.
7. ACKNOWLEDGMENTS
This research activity is being developed inside a project financed by the City Council of Olhão.
This research activity is being developed inside a project approved and sponsored by the Portuguese Foundation for Science and Technology, POCI 2010, sponsored also by the European Comunitary Fund FEDER.
REFERENCES
Cammarata, G., Fichera, A., Forgia, F., Marletta, L. and Muscato, G. (1994), Thermal Load Buildings General Models and Reduce Models. In proceedings of the Healthy Buildings, the 3rd Int. Conference, Budapest,
Hungary.
Conceição, E. Z. E. 2003. Numerical Simulation of Buildings Thermal Behaviour and Human Thermal Comfort Multi-node Models. In Proceedings of the 8th International IBPSA Conference - Building Simulation 2003.
Eindhoven, Vol. 1, pp. 227-234.
Conceição, E. Z. E. and Lúcio. M.ª M. J. R. 2006. Numerical Study of Thermal Response of School Buildings in Summer Conditions. In Proceedings of the Healthy Buildings 2006. Lisbon, Vol. 3, pp. 195-200.
Conceição, E. Z. E., Silva, A. and Lúcio. Mª M. J. R. 2004. Numerical Study of Thermal Response of School Buildings in Winter Conditions. In Proceedings of the 9th Conference on Air Distribution in Rooms - Roomvent 2004. Coimbra.
Fanger, P. O. 1970. Thermal Comfort. Copenhagen: Danish
Technical Press.
ISO 7730, 2005. Ergonomics of the Thermal Environments – Analytical Determination and Interpretation of Thermal Comfort using Calculation of the PMV and PPD Indices and Local Thermal Comfort Criteria. International Standard. Switzerland.
Mendes, N. and Santos, G. (2001), Dynamic Analysis of Building Hygrothermal Behavior. In Proceedings of the 7th International IBPSA Conference - Building Simulation 2001. Vol. 1, pp. 117-123.
Ozeki, Y., Yamamoto, M., Saito, T., Ohgaki, S. and Sonda, Y., (1992), Simulation on Temperature and Flow Field in the Atrium (Part 1. Computation of Solar Radiation, Radiative Heat Transfer, Air Flow, and Temperature). In proceedings of the RoomVent 1992 – 3rd Int. Conference on Air Distribution in Rooms, Aalborg,
Denmark.
Strand, R., Pedersen, C. and Crawley, D. (2001), Modularization and Simulation Techniques for Heat Balance Based Energy and Loads Calculation Programs: The Experience of the ASHRAE Loads Toolkit and Energyplus. In Proceedings of the 7th International IBPSA Conference - Building Simulation 2001. Rio de