Article
J. Braz. Chem. Soc., Vol. 22, No. 11, 2127-2138, 2011. Printed in Brazil - ©2011 Sociedade Brasileira de Química 0103 - 5053 $6.00+0.00
A
*e-mail: [email protected]
Distribution of Indoor Air Pollutants in Downtown Rio de Janeiro, Brazil
Celeste Y. S. Siqueira,*,a Adriana Gioda,b Fabiana P. Carneiro,a
Maria da Conceição K. V. Ramosa and Francisco R. Aquino Netoa
aLaboratório de Apoio ao Desenvolvimento Tecnológico, Instituto de Química,
Universidade Federal do Rio de Janeiro, Av. Athos da Silveira Ramos No. 149, Ilha do Fundão, Cidade Universitária, 21941-909 Rio de Janeiro-RJ, Brazil
bDepartamento de Química, Pontifícia Universidade Católica do Rio de Janeiro,
Rua Marquês de São Vicente No. 225, Gávea, CP 38097, 22453-900 Rio de Janeiro-RJ, Brazil
A qualidade do ar de interiores (IAQ) tem sido um assunto de preocupação no Brasil. No entanto, poucos estudos têm sido realizados em todo o país. Este trabalho apresenta uma pesquisa sobre IAQ conduzida em diferentes tipos de ambientes fechados na cidade do Rio de Janeiro. Amostras de ar foram analisadas para determinar compostos orgânicos voláteis individuais e totais (TVOCs), aldeídos, matéria particulada total (TPM) e fungos. Dentre os parâmetros estudados, as concentrações de TVOCs foram as mais elevadas variando de 101 a 12 823 µg m-3 com uma média
de 1594 µg m-3, ultrapassando o limite sugerido pela ANVISA7 (500 µg m-3). A razão interna/externa
para a maioria dos parâmetros foi maior que a unidade, indicando fontes internas de poluição. Por outro lado, baixos níveis de propágulos fúngicos (esporos) foram detectados (14-314 ufc m-3),
estando abaixo do padrão recomendado (750 ufc m-3). Em geral, os ambientes não apresentaram
boa qualidade do ar para seus ocupantes devido principalmente aos poluentes químicos.
Indoor air quality (IAQ) has been a matter of public concern in Brazil. However, few studies have been performed in the whole country. This work presents an IAQ survey conducted in different kinds of indoor environments in Rio de Janeiro City. Air samples were analyzed to determine individual and total volatile organic compounds (TVOCs), aldehydes, total particulate matter (TPM) and fungi. TVOC concentrations ranged from 101 to 12823 µg m-3 with an average
of 1594 µg m-3, exceeding the suggested limit from ANVISA7 (500 µg m-3). Indoor/outdoor ratios
for most of the parameters were higher than unit, indicating indoor sources of pollution. On the other hand, low levels of airborne fungi were detected (14-314 cfu m-3) being below than the
ANVISA standard7 (750 cfu m-3). Overall, the environments did not present good air quality for
the occupants due to chemical pollutants.
Keywords: indoor air quality, volatile organic compounds, office, microbiological analyses, carbonyl compounds
Introduction
Air pollution is a major environmental health problem affecting developed and under developing countries around the world. Increasing amounts of potentially harmful gases and particles are being emitted into the atmosphere on a global scale, resulting in harm to human health and to the environment. Regarding indoor air, it plays an important role in the healthiness as people spend 88% of their day inside buildings, 7% in a vehicle, but only 5% of their
time outdoors. Indoor exposures produce more harmful health effects than outdoor. The evidence is that indoor concentrations of many pollutants are often higher than
those typically encountered outside.1
Indoor air quality studies are rare in Brazil. The first study registered was developed in 1990, when carbonyl levels of three indoor sites in Salvador City (Bahia State)
were reported.2 That study focused on the relationship
between ambient levels of acetaldehyde and the use
of ethanol as an automobile fuel.2 In that preliminary
Distribution of Indoor Air Pollutants in Downtown Rio de Janeiro, Brazil J. Braz. Chem. Soc. 2128
emitted from works of art (that employed wood, glues, varnishes and lacquers) and infiltrated from the exterior as a result of alcohol-fueled vehicle emissions.
Following that research, the Southeastern Brazil Indoor
Air Quality Study (SEBIAQS conducted in 1993)3-5 was
performed to obtain information on a wide range of airborne chemical species in indoor atmospheres, in a region also influenced by emissions from alcohol-fueled vehicles. This study contributed to the assessment of population exposure to a variety of gaseous and particulate pollutants present in the indoor environment. Measurements were made in a variety of non-industrial indoor environments to investigate aerosol and gas-phase pollutants in São Paulo and Rio de Janeiro Cities.3-5
Over the past two decades, Brazil has experienced an increase in the construction of sealed buildings due to
various factors, e.g. architectural design trends, ambient
conditioning and noise reduction. This tendency is increasing the problems of indoor air quality, when the air-conditioning systems are not adequately maintained. A recent population census also showed an intense urbanization in Brazil, with 84% of the population living in cities. Brazil has one of the
world’s megalopolis, São Paulo (11 × 106 inhabitants) and a
large city, Rio de Janeiro (6 × 10⁶ inhabitants). To preserve
the health of occupants of these buildings, the Brazilian Government published guidelines for indoor air quality.6,7 Both
guidelines suggested limits of indoor pollutants, established cleaning methods for heating, ventilation and air-conditioning (HVAC) systems, indicated emission sources of pollutants, aiming to prevent health risks to the occupants. However, many pollutants still need more information to define limits. Therefore, many more studies are necessary. In the last decade, some researchers have been studying indoor air quality in Brazil, with the objective of improving the quality of people’s lives and of determining what kinds of pollutants are commonly present. Studies evaluating air quality in offices,8-10 dwellings11 and printing facility12 were performed
in our laboratory. Most of these studies were developed in indoor environments where the occupants complained about health problems. The main physical and chemical parameters were investigated and mitigation programs were suggested. The results of these studies indicated that indoor air is more polluted than outdoor and this should be taken into consideration. In some of the studied locations, remediation was carried out to the indoor environments and the air quality
was considerably improved.12
Important sources of chemical indoor pollutants include outdoor air, human body and human activities, emissions from building materials, furnishings and appliances and the
use of consumer products.13,14 Microbial contamination is
mostly related to the presence of humidity. The heating,
ventilating and air-conditioning system can also act as pollutant sources, especially when not properly maintained. For example, the improper care of filters can lead to the
re-emission of particulate contaminants.15
Considerable concern has been voiced over possible ill health effects from exposures to pollutants in indoor air, especially from volatile organic compounds (VOCs). VOCs are widespread indoor pollutants due to their popular use in several ways. Thus, they play an important role in indoor atmospheric chemistry. Some of these VOCs are considered potential risk factors for causing cancer in humans. A new definition of organic compounds in indoor air (OCIA) was proposed to roughly distinguish between four types of OCIAs according to their expected health effect, including
odor annoyance.16
The aim of this research was to evaluate indoor air quality in environments where occupants presented some symptoms of health problems. The indoor environments were offices, a bank vault and carpentry situated in downtown Rio de Janeiro. The evaluated parameters were temperature, relative humidity, volatile organic compounds, aldehydes, total particulate matter and airborne fungi. Some of these environments were reevaluated after a mitigation program. This research could also become a reference scenario to evaluate VOC impact on health since the lower amounts in typical indoor environments hide the evaluation of cause-effect relationships.
Experimental
Sampling sites
Office building (ALC)
A cross-sectional study was carried out involving 151 full-time office workers of a sealed 17 storey office building. Samplings were carried out in a reformed office
located on the 12th floor of the building. The building was
built in the decade of 1970, totally sealed, with HVAC systems. Sampling locations were selected after evaluation of the human activities and the air-conditioning systems. Three sampling points were chosen in the office: ALC_01, ALC_02 and ALC_03. The building is located in downtown Rio de Janeiro near a street with heavy traffic. The office was renewed a year before. It had artificial illumination during daytime and fully carpeted. Smoking is prohibited. The room was equipped with some computers, 5 laser printers, 3 photocopy machines and typical office tables and chairs.
Office building (TRF)
central air-conditioning system. Four floors were selected
with one or two office rooms. The floors were: 10th (1001 and
1003), 14th (1401 and 1403), 15th (1503) and 21st (2101 and
2103). The environments were quite similar: rooms with on average 5 occupants, some of them were smoking, floor covered by carpet, granite and plywood, shelves made of wood and plywood, some wooden chairs and tables, some computers, plants and photocopy machines.
The carpentry workshop, located in annex 2B, 3rd
floor of the same building, was also evaluated. The
room was approximately 120 m2, with 6 non-smoking
occupants, granite floor, some wooden shelves, chairs and tables, computers, plants and photocopy machines. In this environment, two sampling points were chosen: M1 (workshop) and M2 (office). The carpentry is supplied by a central air-conditioning system. The building is located in the downtown area in a street with very heavy traffic.
Office building (PET)
The building has four sectors with approximately
390 occupants and 560 m2 per sector. These sectors are
basically composed by office rooms. Ten sampling points, which are distributed in these sectors, were chosen to collect air samples (Table 1). The environments are similar and have tables, chair, computers, shelves and print/fax machines, i.e., common material to offices. Two sampling campaigns were carried out in this environment, one before a reform and the other one 3 months later after reforming. All rooms are supplied by central air-conditioning system. The building is located in the downtown area in a street with very heavy traffic.
Bank vault of a commercial bank
This is a single storey building, near a heavy traffic street. In this construction, three rooms were selected after evaluation of the human activities and the air-conditioning system: office room (SL), vault (CF), count room point 1 (CG1) and count room point 2 (CG2). The rooms are supplied by central air-conditioning system.
Outdoor
The metropolitan area of Rio de Janeiro is one of the twenty biggest urban agglomerations in the world (with 11 million inhabitants) and the first, among the Brazilian cities,
in respect to the population density, with 1700 hab km-2.17
Among the metropolitan regions in Brazil, Rio de Janeiro has the highest degree of urbanization (96.8%) and responds for 80% of the internal income of the Rio de Janeiro State
and 13% of the country.17 Rio de Janeiro is surrounded by
mountains, coves and beaches, being located in the north of the Tropic of Capricorn along the Brazilian Atlantic Coast.
The terrain is characterized by steep hills and mountains which are offshoots of the mountain range Serra do Mar. These hills are granite based and lead inland to form the Brazilian Highlands. The center of the city (Central Zone) was built on a hill. As the city grew, this hill was later leveled and used as infill for expansion. The hills around Rio de Janeiro severely limited where and how
much expansion could take place.17 Therefore, other areas
were occupied such as the Southern Zone and Northern Zone. The Southern Zone is limited by hills and ocean. Northern Zone is much flatter and most of the development is concentrated along the western side of the Guanabara Bay. The Central Zone is characterized by big buildings and commercial activities. The South is basically designated to tourism and the North is characterized by industry. Rio de
Janeiro City is situated at latitude 22o 54’ S and longitude
43o 10’ W and experiences a climate with high temperatures
(20-40 oC), high humidity (70-80%) and abundant rainfall
averaging 2381 mm y-1.
Sampling strategy and analytical measurements
Samplings were performed for 8 h during daytime indoor (with the rooms normally occupied) and outdoor simultaneously. Measurements were taken for dry-wet bulb temperature and relative humidity, aldehydes, VOCs, total particulate matter (TPM) and airborne fungi.
Air sampling systems consisted of area stations equipped with diaphragm air sampling pumps with flowmeters
(1 L min-1 for VOCs and aldehydes and 10 L min-1 for TPM).
Pollutants were concentrated by pumping air through a manifold containing sorbent tubes and filters.
Complete sampling and analysis conditions are described
elsewhere.8,12 VOCs were collected on XAD-2 resin in
series with activated charcoal in cartridges containing two sections each, one for sampling (100 mg) and other for checking possible breakthrough (50 mg). The collected VOCs were directly extracted by dichloromethane in an
autosampler vial. Perdeuterotoluene was used at 20 µg mL-1
as an internal standard. VOCs were quantified by high resolution gas chromatography with flame ionization detector (HRGC-FID) (Hewlett-Packard 5890 GC, Series II, Palo Alto, Calif. USA). The temperatures of the injector and detector were 260 and 290 ºC, respectively. The column was an HP-5 fused silica capillary column
(60 m × 1.12 mm i.d. × 200 µm film thickness). The GC
heating profile was 5 min at 35 ºC, being programmed at 10 ºC
min-1 to 250 ºC and holding for 5 min. The carrier gas was
helium at 1.8 mL min-1 flow rate. Compounds were identified
Distrib
ution of Indoor
Air Pollutants in Do
wnto
wn Rio de Janeiro, Brazil
J. Br
az. Chem. Soc.
2130
Table 1. Characteristics of each studied room: physical parameters and concentration (average and standard deviation (SD)) of TPM, aldehydes, TVOCs (µg m-3) and fungi (cfu m-3). All rooms are refrigerated
with central air-conditioned system
Location Room Characteristics T / oC RH / % TPM HCHO CH
3CHO TVOCs Airborne fungi
ALC
01 offices 25.0 71.0 16.3 110.0 Nd 548.1 50.0
02 24.0 72.0 15.1 96.6 1.4 592.9 57.1
03 23.0 66.0 12.4 110.7 1.9 567.4 50.0
average 24.0 69.7 14.6 105.8 1.1 569.5 52.4
SD 1.0 3.2 2.0 7.9 1.0 22.5 4.1
TRF-offices
1001 offices 22.1 55.7 8.3 0.15 1.0 – 215.6
1003 22.0 58.6 27.6 0.18 0.1 – 222.6
1401 23.2 58.3 11.1 0.12 1.1 – 109.5
1403 21.6 55.7 8.3 0.02 0.04 – 120.1
1503 23.1 56.8 67.0 0.12 0.24 – 197.9
2101 23.0 55.8 63.6 0.21 0.87 – 130.7
2103 23.0 60 80.5 0.07 0.96 – 116.6
average 22.6 57.3 38.1 0.12 0.62 159.0
SD 0.6 1.7 31.3 0.06 0.47 50.5
TRF-carpentry
M1 workshop 25.2 62.5 98.5 0.32 0.37 6294.3 144.9
M2 office 25.1 64.2 56.7 0.04 0.03 5343.4 144.9
average 25.2 63.4 77.6 0.18 0.2 5818.8 144.9
SD 0.1 1.2 29.6 0.1 0.1 672.4 0.0
Vault of a commercial bank
SL office 20.0 76.0 22.6 11.8 Nd 329.2 314.3
CF strong room 20.0 73.0 18.6 8.7 1.01 321.4 250.0
CG1 count room 1 18.0 65.0 44.9 8.2 1.41 398.3 257.1
CG2 count room 2 18.0 63.0 27.3 9.5 Nd 356.9 257.1
average 19.0 69.3 28.4 9.6 0.6 351.4 269.6
SD 1.2 6.2 11.6 1.6 0.5 34.8 30.0
1st 2nd 1st 2nd 1st 2nd 1st 2nd 1st 2nd 1st 2nd 1st 2nd
PET
01 offices 23.7 22.3 61.6 54.9 4.2 6.2 Nd 27.5 Nd 6.9 351.0 630.0 21.2 81.2
02 23.9 23.0 65.5 58.6 6.6 9.0 Nd 40.1 Nd 4.4 351.0 219.7 151.9 81.2
03 24.1 23.9 65.5 54.2 2.2 1.0 Nd 20.1 Nd 3.1 478.0 175.3 42.4 35.3
04 24.0 23.1 61.6 53.1 9.5 3.8 Nd 7.5 Nd 5.6 354.0 367.4 123.6 130.7
05 23.8 23.5 60.5 56.1 2.9 3.0 Nd 23.4 Nd 6.7 1570.0 12282.5 197.9 148.4
06 23.9 23.5 63.0 58.3 2.9 3.1 Nd 22.4 Nd 7.5 304.0 389.9 31.8 14.4
07 23.8 23.4 63.9 56.5 8.1 1.3 Nd 18.8 Nd 6.6 832.0 10086.1 229.7 81.2
08 24.0 23.3 63.8 57.6 5.7 6.1 Nd 8.9 Nd 4.0 101.0 326.1 116.6 109.5
09 23.8 23.4 64.1 54.9 5.2 6.3 Nd 8.0 Nd 5.0 325.0 357.9 247.3 28.2
10 23.5 22.6 61.7 58.4 4.1 6.7 Nd 2.1 Nd 5.5 930.0 990.8 38.8 95.4
average 23.8 23.2 63.1 56.3 5.1 4.7 0 17.9 0 5.5 563.7 582.6 120.2 80.6
SD 0.2 0.5 1.7 1.9 2.4 2.6 0 11.4 0 1.4 432.5 395.8 85.3 43.9
Series II/Hewlett-Packard 5972 Series Mass Selective Detector) and the analytical conditions were similar to those used in HRGC-FID analyses. The MS system was operated in the electron impact mode at 70 eV with helium
as the carrier gas, at 1.6 mL min-1 flow rate, 32 cm average
linear velocity and 3.12 min hold-up. The limit of detection
(LOD) varied from 0.01 to 0.1 µg m-3 depending on the
different volatile organic compounds (VOCs) and the limit
of quantification varied from 0.3 to 3 µg m-3. A calibration
curve for the response factor was prepared for different VOC and the accuracy and precision of the determination was typically ± 10%.
Samples to measure formaldehyde and acetaldehyde were collected on C18 Sep-Pak cartridges that were impregnated with an acid solution of 2,4-dinitrophenylhydrazine. Aldehyde samples were analyzed by isocratic high performance liquid chromatography (HPLC) (Waters 600E, Miliford, Mass., USA), being the unit fitted with a variable wavelength ultraviolet detector adjusted to 360 nm (Hewlett-Packard Vis/UV Series 1100). The sample volume was 20 µL. Separation was performed on a C18 column
(Merck Lichrocart C18 125 mm × 4.6 mm × 5 µm). The
flow of the acetonitrile/water (45:55) mobile phase was
adjusted to 1 mL min-1. External standards containing six
different concentrations of 2.4-dinitrophenilhydrazones of both aldehydes were analyzed under the same conditions. A calibration curve was made to quantify both derivatized aldehydes.
TPM was measured by gravimetric analysis. Air from the environment was collected on 37-mm diameter polycarbonate membrane filters (0.4 um) mounted in plastic cassettes. Filters were preconditioned to constant humidity
in a desiccator containing 80% (m/m) glycerol/water before and after sampling. Weighing was performed on a
calibrated microbalance (± 0.00002 g).
The air samples for microbiological analysis are of four distinct types: ambient air, supply air, return air and mixer air. The used sampler for these collections was a one stage CBI Air Sampler E01-S Impactor (CBI Air Sampler, Sao Paulo, Brazil). Fungi analysis conditions
were described by Brickuset al.9
Results and Discussion
Temperature and relative humidity
Figure 1 illustrates the temperatures (T) that were measured in the office buildings (ALC, TRF and PET), carpentry and a bank vault of a commercial bank.
ASHRAE18 recommends internal temperatures between
20-26 oC and Brazilian guidelines7 23 to 26 oC. The indoor
temperature for all environments varied from 18 to 25 ºC,
with an average of 23 oC that is the suggested minimum
value by Brazilian guidelines. Some of the rooms presented
temperature values below the minimum limit (23 oC), but
none above (26 oC) (Figure 1, Table 1). ALC presented
satisfactory temperatures for all rooms. In the vault, the detected lowest temperature was below the suggested minimum.
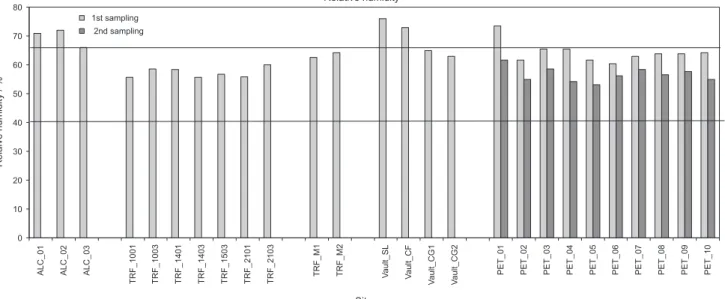
ASHRAE18 recommends for relative humidity (RH)
value a range from 30 to 70% and the RE97 from 40 to
65%. The relative humidity was in the interval of 53-76%, with an average value of 61%. This value is near of the maximum one that is suggested by Brazilian guidelines
Distribution of Indoor Air Pollutants in Downtown Rio de Janeiro, Brazil J. Braz. Chem. Soc. 2132
(Figure 2, Table 1). In contrast to temperature, the RH values were near the maximum limit (65%) with some of them exceeding, but none was lower than the minimum guideline value (40%). The high RH value is probably due to external conditions since the average RH value in
Rio de Janeiro is about 70% for the whole year.19
It is known that low air humidity values induce the drying of skin, mouth and nasal mucous while high values can favor the proliferation of biological agents. Temperature and humidity are also important due to their influence on the clearance rate of chemical pollutants from the environment. Although, most of the measurements are within the guideline values, they are near the maximum (RH) or minimum (T) values. In this case, low temperatures could be uncomfortable for their occupants and the high humidity could cause proliferation of microorganisms.
Total particulate matter (TPM)
TPM concentrations ranged from 0.1 to 99 µg m-3, with
an average of 17 ± 26 µg m-3. Overall, most of the measured
TPM values were below the suggested limits by national
guidelines (80 µg m-3)(Table 1). The highest values were
measured in the carpentry that is an environment with intense activities and sources of particulate matter. The I/O ratios for these environments were higher than unit (1), indicating that indoor concentrations are higher than outdoors in these environments. Although many measurements were made on different floors of the buildings, it was not observed a decrease in the concentration depending on the floor height. It is expected that high-level floors are less impacted by
outdoor pollution than ground-level floors. It means that in this study the main TPM sources are internal.
Aldehydes
Formaldehyde levels are good indicators of the effect of the air-conditioning regime in the indoor pollutant
concentrations.8 Formaldehyde concentrations ranged
between not detected to 111 µg m-3, with an average of
15 ± 30 µg m-3 for all environments. In this study, the
maximum levels of formaldehyde were slightly higher (just
in few points) than the suggested limit (100 µg m-3).20 The
sampling points with high formaldehyde levels were in the
renewed office (ALC and PET - 2nd sampling). Probably, it
originated from phenolic resins that were used as a plywood binder and particleboard finishing materials, glues and furniture21 (due to the recent reform in the offices). The I/O
ratios for all points were much higher than unit indicating an indoor source for this pollutant.
Low levels of acetaldehyde were detected for all office
rooms varying between not detected and 8 µg m-3 (Table 1)
that is much lower than the limit (100 µg m-3).20 It seems
that this pollutant is not the cause of ill health problems in the occupants of this building. However, especially sensitive groups showing hypersensitive reactions without immunological signs could suffer some health problems,
therefore World Health Organization (WHO)20 recommends
a maximum value of 10 µg m-3.The use of ethanol for
cleaning surfaces (notably glass windows) in Brazil is very common. This appears to be the major source of acetaldehyde indoors because acetaldehyde is a usual contaminant in commercial ethanol. There was no evidence
that its higher levels could derive from the use of ethanol as fuel for cars in Brazil.
Volatile organic compounds (VOCs)
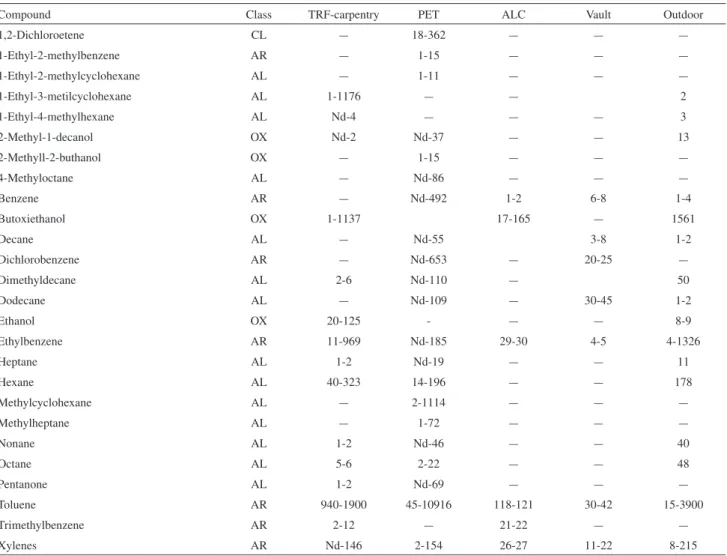
Several VOCs were identified using a MS Chemstation with a Wiley 275.L spectral library and the mean
concentrations of the main measured compounds (µg m-3)
are listed in Table 2.
The commonly detected volatile organic compounds can be divided into five categories. The largest classes are the aromatic and aliphatic hydrocarbons. The compounds in
these two classes are derived from petroleum products (e.g.,
solvents, fuel etc). Chlorinated hydrocarbons are commonly emitted from solvents, detergents, insecticides and tap
water.22 The terpenes constitute a class of odoriferous
substances that are probably related to cleaning products. Oxygenated compounds (aldehydes of high molecular weight) make up the remaining class.
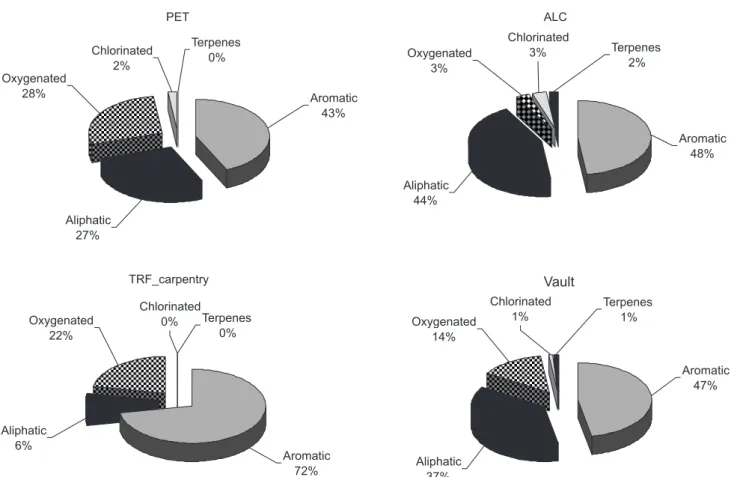
The distribution of VOC classes in indoor air varies due to their different emission sources (Figure 3).
The absolute amount of the compounds also widely varied between the sampling sites. On average, about 20-30 compounds were identified in each office room and 50-60 in the carpentry. However, in most of them, the predominant classes were aliphatic and aromatic hydrocarbons. Only in a few sampling points were detected terpenes. Offices (PET and ALC) and vault presented similar class distributions for aromatics (43-48%), chlorinated (1-3%) and terpenes (0-2%). However they presented significant differences for aliphatic (27, 37 and 44%) and oxygenated (3, 14 and 28%) compounds (Figure 3). In the carpentry, the predominant class was aromatic (70%), followed by oxygenated (20%) and aliphatic (10%). No chlorinated or terpenes were found.
The aromatic compounds predominated in all the studied environments because they are major components of the solvents, inks and external infiltration. The indoor
concentration is frequently much higher (e.g., toluene).
Table 2. Concentration ranges of the main VOCs identified (µg m-3)
Compound Class TRF-carpentry PET ALC Vault Outdoor
1,2-Dichloroetene CL – 18-362 – – –
1-Ethyl-2-methylbenzene AR – 1-15 – – –
1-Ethyl-2-methylcyclohexane AL – 1-11 – – –
1-Ethyl-3-metilcyclohexane AL 1-1176 – – 2
1-Ethyl-4-methylhexane AL Nd-4 – – – 3
2-Methyl-1-decanol OX Nd-2 Nd-37 – – 13
2-Methyll-2-buthanol OX – 1-15 – – –
4-Methyloctane AL – Nd-86 – – –
Benzene AR – Nd-492 1-2 6-8 1-4
Butoxiethanol OX 1-1137 17-165 – 1561
Decane AL – Nd-55 3-8 1-2
Dichlorobenzene AR – Nd-653 – 20-25 –
Dimethyldecane AL 2-6 Nd-110 – 50
Dodecane AL – Nd-109 – 30-45 1-2
Ethanol OX 20-125 - – – 8-9
Ethylbenzene AR 11-969 Nd-185 29-30 4-5 4-1326
Heptane AL 1-2 Nd-19 – – 11
Hexane AL 40-323 14-196 – – 178
Methylcyclohexane AL – 2-1114 – – –
Methylheptane AL – 1-72 – – –
Nonane AL 1-2 Nd-46 – – 40
Octane AL 5-6 2-22 – – 48
Pentanone AL 1-2 Nd-69 – – –
Toluene AR 940-1900 45-10916 118-121 30-42 15-3900
Trimethylbenzene AR 2-12 – 21-22 – –
Xylenes AR Nd-146 2-154 26-27 11-22 8-215
Distribution of Indoor Air Pollutants in Downtown Rio de Janeiro, Brazil J. Braz. Chem. Soc. 2134
There are many compounds that are only found indoor (e.g.,
1-methyl-2-propylbenzene, 1,2-dimethylcyclohexane). The main compounds that were identified among the aromatics were benzene, toluene, ethylbenzene and xylene isomers. They are identified as target compounds in environmental studies due to their potential health risks. There is no regulation for a tolerance limit for any of the identified compounds. On the other hand, some common harmful compounds have very high (in regards to indoor pollution)
industry environment limits determined by NR-15,23e.g.,
toluene and xylenes (290 and 340 mg m-3, respectively).
However, Aquino Neto and Brickus24 recommended a
guideline for individual VOCs of 250 µg m-3 for indoor
environments. Toluene showed the greatest concentration in the majority of the sampling points. Indoor concentrations
ranging from 5 to 2043 µg m-3 for toluene and 10-1500 µg m-3
for xylenes were measured (Table 2). The office environments presented low levels of these aromatics, but the carpentry showed the highest levels. This was expected due to the kind of activity, exceeding the suggested limit.
The saturated hydrocarbons can be originated from a variety of consumer products, building materials, where they are present as solvents or thinners and in building composites (particleboard). Some may also arise from
tobacco smoke and vehicular traffic.5 Several kinds of
alkanes and cycloalkanes were identified such as n-alkanes, methylcyclohexane, methyl and ethyl cyclohexanes and others (Table 2). However, the exact structures of several isomers of the other alkanes and cycloalkanes were not characterized.
In general, the levels of individual aliphatic VOCs are low in the offices. For ALC, the highest concentration was
obtained for pentadecane (ca. 7 µg m-3). For the vault, it
was decane (ca. 8 µg m-3). On the other hand, the aliphatic
compounds were high in the carpentry, where hexane (ca. 320 µg m-3) exceeded the suggested limit (250 µg m-3).
Some oxygenated compounds were detected in significant concentrations in the carpentry, such as
ethanol (21-125 µg m-3) and 3-hydroxy-2-butanone
(ca. 14 µg m-3). Among the studied office sites, it
was detected methylpentanone (ca. 121 µg m-3) and
2,2-dimethylpropanol (ca. 441 µg m-3) that presented the
highest mean concentrations. The latter ones surpass the
values that are suggested by Aquino Neto and Brickus.24
TVOC values are very useful in the assessment of the
quality of the indoor air. Molhave and Clausen25 proposed
the use of a target guideline of 300 µg m-3 for TVOC
as an indicator of ill health effects that are caused by a multicomponent air exposure to VOC at low concentrations.
In Brazil, Aquino Neto and Brickus24 recommended a
Figure 4. Indoor TVOC concentrations for all indoor environments and the suggested limit (500 µg m-3).
guideline for TVOCs of 500 µg m-3. These measurements
demonstrated that values of TVOC concentrations in the evaluated sites are high enough, in the light of the study
performed by Molhave and Clausen,25 to cause discomfort
in occupants (especially sensitive individuals). In this study,
the TVOC values ranged from 100 to 12282 µg m-3, with
an average of 1594 ± 3020 µg m-3. Figure 4 and Table 1
show TVOC values for all sampling points.
According to recommended Brazilian threshold
(500 µg m-3), just the offices in the vault presented
appropriated levels of TVOC, with similar concentrations
among rooms (321-398 µg m-3). In the ALC offices were
measured slightly higher levels of TVOCs, but it was
also similar among the rooms (548-592 µg m-3). Levels
in the carpentry were very high, mainly in the workshop
(6294 µg m-3). This was expected due the more intense
activities than in the office. In the PET building, most of the rooms presented low levels of TVOCs in the first sampling, but high in the second one (after renovation of the room). As expected, the concentrations of TVOCs increased as a reflection of the increased emission of these substances from building materials and finishing (plywood, glues, paints, varnishes, wax, etc). Also, there are significant differences among the levels in the building. It is not clear the cause of these variations once the rooms are located in the same floor and composed by the same materials and number of workers.
Indoor/outdoor ratios for VOC classes and TVOC revealed that indoor air is much more polluted than outdoor, with critical sources of pollution.26-28 This fact indicates that
VOCs found in indoor environments are originated mainly from indoor sources, possibly because of the materials used in refurbishing, and cleaning products.
Airborne fungi
Microbiological analysis shows similar characteristics
for all environments, presenting genera Alternaria,
Penicilium, Aspergillus sp and Cladosporium in a significantly prevalent way in all samples. Exposures
to species of Penicilium and Aspergillus sp have been
associated with occupational asthma and hypersensitive
pneumonitis.9 However, the levels that were detected for
airborne fungi in this study (Table 1) are lower than the
recommended by Brazilian guidelines (750 cfu m-3).7
Although the temperature and relative humidity are out of the suggested range in most of the sites, it seems not to affect the microbiological growth. No correlation among RH and T with fungi concentrations was obtained. These low measured levels of airborne fungi indicate that the air-conditioning systems are kept working properly in these buildings.
Comparison with other published studies from Rio de Janeiro
Distribution of Indoor Air Pollutants in Downtown Rio de Janeiro, Brazil J. Braz. Chem. Soc. 2136
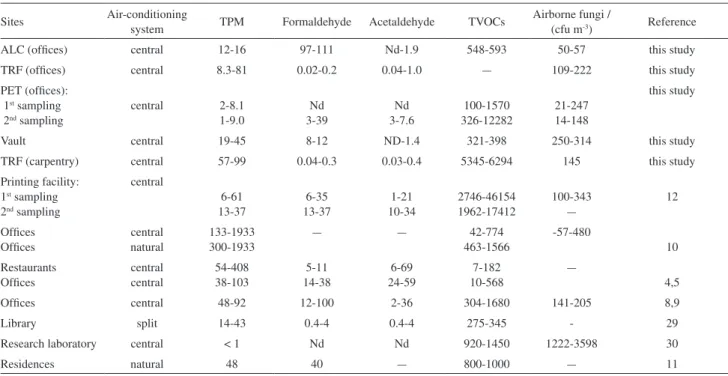
Table 3. Comparison between the published ranges of concentrations (µg m-3) and fungi for indoor pollutants measured in different indoor environments in Rio de Janeiro, Brazil
Sites Air-conditioning
system TPM Formaldehyde Acetaldehyde TVOCs
Airborne fungi /
(cfu m-3) Reference
ALC (offices) central 12-16 97-111 Nd-1.9 548-593 50-57 this study
TRF (offices) central 8.3-81 0.02-0.2 0.04-1.0 – 109-222 this study
PET (offices): 1st sampling 2nd sampling
central 2-8.1 1-9.0 Nd 3-39 Nd 3-7.6 100-1570 326-12282 21-247 14-148 this study
Vault central 19-45 8-12 ND-1.4 321-398 250-314 this study
TRF (carpentry) central 57-99 0.04-0.3 0.03-0.4 5345-6294 145 this study
Printing facility: 1st sampling 2nd sampling
central 6-61 13-37 6-35 13-37 1-21 10-34 2746-46154 1962-17412 100-343 – 12 Offices Offices central natural 133-1933 300-1933
– – 42-774
463-1566 -57-480 10 Restaurants Offices central central 54-408 38-103 5-11 14-38 6-69 24-59 7-182 10-568 – 4,5
Offices central 48-92 12-100 2-36 304-1680 141-205 8,9
Library split 14-43 0.4-4 0.4-4 275-345 - 29
Research laboratory central < 1 Nd Nd 920-1450 1222-3598 30
Residences natural 48 40 – 800-1000 – 11
Nd: not detected; −: not analyzed.
larger number of studies in different regions and indoor environments would be necessary.
In order to define a profile of pollutant distribution, a compilation of data was done. Table 3 presents published concentrations of TPM, aldehydes, TVOCs and airborne fungi for Rio de Janeiro City. These values are compared with this study. In this research, other buildings were investigated, but other profiles were observed. Overall, the levels of indoor pollutants significantly vary among sites as discussed below for each species.
Total particulate matter presented low levels in most of the studied environments, both with and without central air-conditioning systems (Table 3). However, in other offices with air-conditioning or natural ventilation, high
levels were detected ranging from 130 to 1930 µg m-3. These
levels exceed by several times the limit that is suggested
by the Brazilian legislation (80 µg m-3).7 Probably, the
cause of these higher concentrations is the downtown city location, near streets with heavy traffic. Restaurants with electrical systems for food cooking presented levels
between 54-84 µg m-3 being lower than the ones measured
for charcoal systems (408 µg m-3).4
Aldehydes were detected in low levels being not detected in most cases. In this study, the highest registered concentrations for formaldehyde among sites were
111 µg m-3 (Table 3). The maximum values exceeded the
suggested limit of 100 µg m-3. According to these results, and
contrarily to the expected contribution of ethanol as car fuel in Rio de Janeiro, aldehydes do not appear to be the most important pollutant of indoor environments.
Total volatile organic compounds largely varied among sites. The lowest registered concentrations were in a library
(64-199 µg m-3) and restaurants (7-182 µg m-3) (Table 3).
The measured concentration in residences was surprisingly
high ranging from 800 to 1000 µg m-3. Probably, the outdoor
sources had significant influence in these concentrations. But also cleaning activities with solvents and other products and cooking affected the levels of TVOCs. Comparing offices with natural and central ventilation, it was observed that the former presented higher TVOC concentrations. The worst scenario with concentration as
high as 46000 µg m-3 was obtained in a printing facility.
These high values were expected as several kinds of solvents and inks were handled in that environment.
Regarding to microbiological analysis, in this study,
low levels of airborne fungi were detected (20-314 cfu m-3).
The highest levels were detected in a research laboratory. Probable the cause of these high concentrations is the location, in a basement with high humidity. Overall, the microbiological index did not exceed the suggested limit (750 cfu m-3).7
of each environment. However, some variations could be also attributed to sampling methodologies, period of the year and other factors. It is urgently needed to validate the methodology for indoor sampling and analyses in order to gain more reliable information about indoor pollutants. Interlaboratory proficiency testing should be also established to reach consensus values among laboratories that work in this field, integrating that obtained values worldwide. Based only in the few available results, it is very difficult to define thresholds due to great variations, although it was observed in the same kind of indoor environment.
Indoor air was monitored in different environments in Rio de Janeiro City in order to get information to be used in governmental guidelines. Because of the potential risks and problems related to indoor air pollution, the Brazilian government has been striving to establish IAQ objectives for different types of indoor environments.
Indoor air quality study is a complex issue and requires multidisciplinary investigations and environmental monitoring. To understand the effects of the indoor air on the occupants, an evaluation of the performance of the building and a survey about materials, activities, cleaning products and health symptoms are required. It is essential to characterize the composition, magnitude and the distribution of air toxicants through air monitoring, assessing the impact of these components on human health. It is important to take into account that new and refurbished buildings have generally materials that could emit high indoor concentrations of VOCs and formaldehyde, causing adverse effects on the occupants. Good practices of environmental monitoring and sampling of pollutants for assessment of the impacts together with a medical evaluation are essential to improve IAQ guidelines.
Conclusions
In this study, physical parameters, such as temperature and relative humidity, were evaluated and oscillated among rooms. For most sites, the temperature was near the
minimum value (23 oC) and the relative humidity near to
the maximum value (65%) that is suggested by Brazilian guidelines. These values out of the guidelines range could be uncomfortable for the occupants or cause proliferation of microorganisms. In spite of the high RH, low levels of fungi were observed. The low measured levels of airborne fungi indicates that the air-conditioning systems are kept working properly in these buildings. The total particulate matter
(TPM) was measured in lower levels (average of 17 µg m-3)
than the suggested by the guideline (80 µg m-3), indicating
as clean the studied environments. Some places with more intense activities had high TPM concentrations, slightly
exceeding the limits. Formaldehyde and acetaldehyde were detected in low concentrations in almost all rooms. The level of formaldehyde was higher in newly built homes and decreased with the age of the buildings. The average values of VOCs were associated with very large standard deviations, reflecting wide distribution of these compounds in indoor environments. The average concentration was
1543 ± 3020 µg m-3 which is higher than the suggested limit
(500 µg m-3). Compared to other studies in Brazil, the levels
of formaldehyde and TVOCs are within the same range. The possible influence of the building age, its decoration, cigarette smoking and the number of occupants in indoor are the main causes of differences.
The mean values obtained in this work together with others conducted in Brazil were associated with very large standard deviation, reflecting wide distribution of chemical compounds and TPM. Both the indoor and outdoor environments have sources that elevated the indoor concentrations in a different extent. These variations are due to specific characteristics of each evaluated environment. Also, significant variations were observed among rooms of the same building. However, to define thresholds it is necessary to perform further studies to obtain a wider range of emission levels for each type of environment. Although in many rooms the parameters were within the guidelines, many symptoms were reported by the occupants. It means that the limits are still inadequate, especially for sensitive people.
Acknowledgments
T h e a u t h o r s t h a n k C o n s e l h o N a c i o n a l d e Desenvolvimento Científico e Tecnológico (CNPq), Fundação de Apoio à Pesquisa do Estado do Rio de Janeiro (FAPERJ) and Fundação Universitária José Bonifácio (FUJB).
References
1. Jones, A. P.; Atmos. Environ.1999, 33, 4535.
2. Grosjean, D.; Miguel, A. H.; Tavares, T. M.; Atmos. Environ.
1990, 24B, 101.
3. Allen, A. G.; Miguel, A. H.; Atmos. Environ.1995, 29, 3519. 4. Miguel, A. H.; Aquino Neto, F. R.; Cardoso, J. N.; Vasconcellos,
P. D. C; Pereira, A. S.; Marquez, K. S. G.; Environ. Sci. Technol.
1995, 29, 338.
5. Santos, C. Y. M.; Aquino Neto, F. R.; Cardoso, J. N.; Indoor Built Environ.1997, 6, 168.
Distribution of Indoor Air Pollutants in Downtown Rio de Janeiro, Brazil J. Braz. Chem. Soc. 2138
7. Agencia Nacional de Vigilância Sanitária (ANVISA); Padrões Referenciais de Qualidade do Ar Interior em Ambientes
Climatizados Artificialmente de Uso Público e Coletivo, Resolution - RE No. 9, Brasília, DF, Brasil, 2003.
8. Brickus, L. S. R; Cardoso, J. N.; Aquino Neto, F. R.; Environ. Sci. Technol.1998a,32,3485.
9. Brickus, L. S. R.; Siqueira, L. F. G.; Aquino Neto, F. R.; Cardoso, J. N.; Indoor Built Environ.1998b, 7, 270.
10. Rios, J. L. M.; Boechat, J. L.; Gioda, A.; Santos, C. Y. M.; Aquino Neto, F. R.; Silva, J. R. L.; Environ. Int.2009, 35, 1136. 11. Almeida, S. M.; Corrêa, M. A. P.; Brickus, L. S. R.; Aquino
Neto, F. R.; Moreira, J. M.; In: Healthy Buildings 2000, Helsinki, Finland, Proceedings V I Helsinky: SIY, 549. 12. Gioda, A.; Aquino Neto, F. R.; Indoor Built Environ.2002, 11,
302.
13. Brickus, L. S. R.; Aquino Neto, F. R.; Quim. Nova1999, 22, 65.
14. Gioda, A.; Aquino Neto, F. R.; Quim. Nova2003, 26, 359. 15. World Health Organization (WHO); The Right to Healthy
Indoor Air, Report on a WHO Meeting; WHO Regional Office of Europe: Bilthoven, Netherlands, 2000.
16. Wolkoff, P.; Clausen, P. A.; Nielsen, G. D.; Indoor Air2006, 16, 7.
17. http://www.macalester.edu/courses/geog61/chad/geograph.htm Geography and Development of Rio de Janeiro, accessed in September 2011.
18. American Society of Heating, Refrigerating and Air-Conditioning Engineers (ASHRAE); Ventilation for Acceptable Indoor Air Quality, Standard 62-1999, ASHRAE, Inc.: Atlanta, 1999.
19. Martins, E. M.; Arbilla, G.; Atmos. Environ. 2003, 37, 1715. 20. World Health Organization (WHO); Indoor Air Quality:
Biological Contaminants, Report on WHO Meeting; WHO Regional Office of Europe: Rautavaara, 1988, p. 37.
21. Sato, S.; Hirokawa, Y.; Bougaki, K., Ito, H.; Kimituki, M.; In: Healthy Build. 2000, Helsinki, Finland, Proceedings V I Helsinky: SIY 1, 459.
22. Iwata, T.; Ozaki, J.; Takahashi, M.; Kimura, K.; In:. Healthy Build. 2000, Helsinki, Finland, Proceedings V I Helsinky: SIY 1, 407.
23. Ministério do Trabalho; Segurança e Medicina do Trabalho: Lei No. 6514; Editora Atlas: São Paulo, Brasil, 1994. 24. Aquino Neto, F. R.; Brickus, L. S. R.; Rev. Brasindoor1999,
3, 4.
25. Molhave, L.; Clausen, G.; Proceeding of 7th International Conference on Indoor Air Quality and Climate, Nagoya, Japan,
1996,2, 37.
26. Han, K. H.; Zhang, J. S.; Knudsen, H. N.; Wargocki, P.; Chen, H.; Varshney, P. K.; Guo, B.; Atmos. Environ.2011, 45, 3034. 27. Lindgren, T.; Build. Environ. 2010, 45, 596.
28. Wolkoff , P.; Nielsen, G. D.; Environ. Int.2010, 36, 788. 29. Gioda, A.; Ramos, M. C. K. V.; Aquino Neto, F. R.; Proceeding
of 12th International Conference on Indoor Air Quality and
Climate, Austin, Texas, 2011, 6.
30. Freitas, T.; Research Laboratory in Indoor Air Quality; a Report for LADETEC, Rio de Janeiro, Brasil, 2005, 10. With the permission of author Freitas, T., this report is available under request.
Submitted: March 16, 2011