ARTIGO ORIGINAL
Functional, Sensorial, Mobility and Communication
Difficulties in the Portuguese Oldest Old (80+)
Dificuldades Funcionais, Sensoriais, de Mobilidade e de
Comunicação nos Muito Idosos (80+) Portugueses
1. Research and Education Unit on Ageing. Universidade do Porto. Porto. Portugal.
2. Center for Health Technology and Services Research. Faculdade de Medicina. Universidade do Porto. Porto. Portugal. Autor correspondente: Daniela Brandão. [email protected]
Recebido: 25 de julho de 2016 - Aceite: 10 de abril de 2017 | Copyright © Ordem dos Médicos 2017
Daniela BRANDÃO1,2, Óscar RIBEIRO1,2, Constança PAÚL1,2
Acta Med Port 2017 Jun;30(6):463-471 ▪ https://doi.org/10.20344/amp.8060
RESUMO
Introdução: O envelhecimento da população é evidente na maioria dos países desenvolvidos, e o grupo dos muito idosos é um dos
segmentos da população com mais rápido crescimento. O objetivo deste estudo é analisar as características sociodemográficas e de saúde dos muito idosos portugueses, usando uma abordagem baseada nos dados dos censos populacionais.
Material e Métodos: Foi conduzido um estudo descritivo considerando todos os residentes com 80 ou mais anos à data dos Censos
2011 (n = 532 219). Os dados dos questionários dos Censos acerca das características sociodemográficas, funções sensoriais (visão, audição), estado funcional (andar/subir degraus, tomar banho/vestir-se sozinho), cognição (memória/concentração) e comunicação (compreender os outros/fazer-se entender) foram analisados.
Resultados: Os resultados revelaram que a maioria dos muito idosos são mulheres (64,5%), viúvos (53,9%), analfabetos (46,1%) e
vivem em contexto domiciliar (88,8%). Andar/subir degraus (57,1%), visão (39,1%) e audição (35,1%) foram as dimensões onde os muito idosos apresentavam maiores constrangimentos. Em paralelo, compreender os outros/fazer-se entender (25,9%) e memória/ concentração (34,4%) foram as dimensões com percentagens mais baixas de dificuldade. Foram encontradas diferenças significati-vas entre a população octogenária/nonagenária e a população centenária para a visão, andar/subir escadas, e tomar banho/vestir-se sozinho, com os centenários a apresentarem uma maior percentagem de dificuldade.
Discussão: Os muito idosos portugueses apresentam dificuldades significativas nas atividades de vida diária, contudo, as
capaci-dades cognitivas e de comunicação parecem ser comummente mantidas. Em conjunto, estes resultados sugerem a necessidade de assistência funcional, mas que pode ser, em última instância, gerida pelo próprio idoso.
Conclusão: Considerando as diferenças observadas entre os centenários e os idosos mais jovens, devem ser equacionadas
interven-ções capazes de responder às necessidades potencialmente específicas de cada grupo.
Palavras-chave: Actividades da Vida Diária; Avaliação da Deficiência; Censo; Demografia; Idoso, 80 anos e mais; Idoso Fragilizado;
Portugal
ABSTRACT
Introduction: The ageing of populations is evident in most developed countries, and the oldest old group is one of the segments with
the fastest growing. The aim of this paper is to examine sociodemographic and health related characteristics of the portuguese oldest old, using a census-based approach.
Material and Methods: A descriptive study considering all residents aged 80 years and older at the time of the 2011 Census (n =
532 219) was conducted. Information on sociodemographic characteristics, sensory functions (seeing, hearing), functional status (walking/climbing stairs, bathing/dressing alone), cognition (memory/concentration), and communication (understanding others/being understood) as assessed by the Portuguese census official questionnaires were analyzed.
Results: Findings revealed that most of the oldest old are women (64.5%), widowed (53.9%), illiterate (46.1%) and live in private
households (88.8%). Walking/climbing stairs (57.1%), vision (39.1%) and hearing (35.1%) were the dimensions where the oldest old presented major constrains. In parallel, understanding others/being understood (25.9%) and memory/concentration (34.4%) were the dimensions with lower percentages of difficulties. Significant differences were found between octogenarians/nonagenarians and centenarians for vision, walk/climb stairs, and bathing/dressing alone, with centenarians presenting a higher percentage of difficulties.
Discussion: Portuguese oldest old showed significant difficulties in activities of daily living, nevertheless cognitive and communication
capacities seem to be commonly maintained. Taken together, these findings suggest the need for functional assistance, which can be ultimately managed by the older person him/herself.
Conclusion: Based on the observed differences between centenarians and younger oldest old, specific interventions should be
equated to better respond to their potentially distinctive needs.
Keywords: Activities of Daily Living; Aged, 80 and over; Censuses; Demography; Disability Evaluation; Frail Elderly; Portugal
INTRODUCTION
The number of individuals reaching advanced ages is rising rapidly worldwide, and the 80+ age group is one of the segments with a fastest growing.1 A recent report of the
United Nations refers that among those aged 60 or over worldwide, 14% were aged 80 or over in 2015, and this percentage is expected to grow to 21% in 2050.2
In Portugal, individuals aged 80 and plus represent
5.6% of the total 10 562 178 population and 26.5% of the older population (2 010 064), i.e., slightly above a quarter of those aged 65 and over in 2011.3 The number of oldest
old suffered a great increase over the last decades, and according to the most recent projections life expectancy is expected to continue to increase, and in 2060 it will be 84.21 years for men and 89.88 years for women.4 Life expectancy
ARTIGO ORIGINAL at age 80 also suffered a positive tendency: in 1980 - 1985 it was 6.5 years, currently it is projected to rise to 11.5 years in 2045 - 2050, according to a report of the United Nations on the profiles of ageing.5
These improvements on life expectancy are one of the findings that best reflect the positive change in health indicators that have occurred over last decades in Portugal. Nonetheless, this trend has not been accompanied by clear policy measures that consider the needs of the elderly population.6
Although the achievement of increased longevity is a result of improvements in health and medical care services, those with very advanced ages are likely to have more frailty conditions and disabilities, requiring more medical services and social support.7 The World Health Organization defines
disability as “an umbrella term, covering impairments, activity limitations, and participation restrictions” in one or more functional areas (e.g. cognitive, sensorial), which are commonly associated with morbidity and dependence.8-10
Findings from 2014 regarding the Active Ageing Index which measures the extent to which older people can realize their full potential in terms of employment, participation in social and cultural life and independent living) revealed that Portugal appears in the 16th place on the ranking of EU 28
countries in the overall domain, but only in the 21st place in
the independent living domain,5 reinforcing the great need
of some source of support in this population.
The number of older people facing disability is expected to increase in the coming years. Main reasons are due to the growing number of older persons, and also the growing number of individuals achieving extremely long lives (i.e. centenarians). Some studies that compare different age groups among the oldest old have found a higher number of physical difficulties and chronic conditions in centenarians when compared to octogenarians.11-13 In addition, age
seems to predict a higher usage of care services, and the increase in the number of extremely long-lived individuals is expected to raise the burden on caregiving and long-term care services.14 Nevertheless, in the aging research,
attention to the oldest old population is still scarce, and some of the available findings contradictory.15
The aim of this study is to provide a profile of the sociodemographic characteristics and self-reported disabilities in sensorial, functional, and cognitive and communication domains of the Portuguese oldest old. Knowledge about this increasingly expressive group is important in order to establish adequate prevention programs, and implement effective interventions to deal with adverse outcomes commonly associated with very old age.
MATERIAL AND METHODS
Information was obtained using data from the 2011 Portuguese National Census provided by National Statistical Institute of Portugal (INE), of all persons resident in Portugal with 80 or more years at the moment of census data collection.
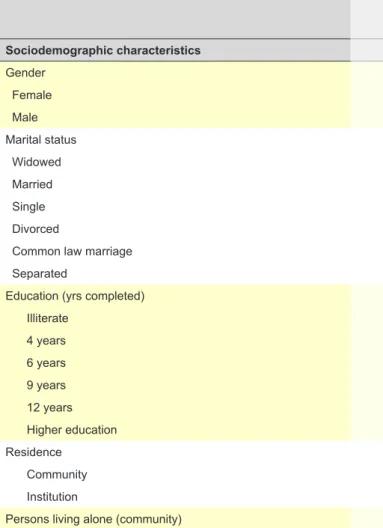
Table 1 - Sociodemographic characteristics of the Portuguese 2011 Census sample of oldest old
Total 80 - 99 yrs 100+ yrs p
n = 532 219 n = 530 693 n = 1526
Sociodemographic characteristics n % (IC 95%) n % (IC 95%) n % (IC 95%)
Gender Female 343 491 64.5 (64.37% to 64.63%) 342 238 64.5 (64.37% to 64.63%) 1253 82.1 (80.18% to 84.02%) < 0.001 Male 188 728 35.5 (35.37% to 35.63%) 188 455 35.5 (35.37% to 35.63%) 273 17.9 (15.98% to 19.82%) Marital status Widowed 287 032 53.9 (53.77% to 54.03%) 285 781 53.9 (53.77% to 54.03%) 1251 82.0 (80.07% to 83.93%) 0.013 Married 193 654 36.4 (36.27% to 36.53%) 193 568 36.5 (36.37% to 36.63%) 86 5.6 (4.45% to 6.75%) Single 39 360 7.4 (7.33% to 7.47%) 39 188 7.4 (7.33% to 7.47%) 172 11.3 (9.71% to 12.89%) Divorced 10 146 1.9 (1.86% to 1.94%) 10 130 1.9 (1.86% to 1.94%) 16 1.0 (0.5% to 1.5%)
Common law marriage 4685 0.9 (0.87% to 0.93%) 4676 0.9 (0.87% to 0.93%) 9 0.6 (0.21% to 0.99%)
Separated 2027 0.4 (0.38% to 0.42%) 2026 0.4 (0.38% to 0.42%) 1 0.07 (-0.06% to 0.2%)
Education (yrs completed)
Illiterate 245 506 46.1 (45.97% to 46.23%) 244 566 46.1 (45.97% to 46.23%) 940 61.6 (59.16% to 64.04%) 0.009 4 years 223 185 41.9 (41.77% to 42.03%) 222 749 42.0 (41.87% to 42.13%) 436 28.6 (26.33% to 30.87%) 6 years 14 124 2.6 (2.56% to 2.64%) 14 082 2.7 (2.66% to 2.74%) 42 2.8 (1.97% to 3.63%) 9 years 18 115 3.4 (3.35% to 3.45%) 18 066 3.4 (3.35% to 3.45%) 49 3.2 (2.32% to 4.08%) 12 years 14 817 2.8 (2.76% to 2.84%) 14 787 2.8 (2.76% to 2.84%) 30 1.9 (1.22% to 2.58%) Higher education 16 475 3.1 (3.05% to 3.15%) 16 446 3.0 (2.95% to 3.05%) 29 1.9 (1.22% to 2.58%) Residence Community 472 649 88.8 (88.72% to 88.88%) 471 565 88.9 (88.82% to 88.98%) 1084 71.0 (68.72% to 73.28% 0.227 Institution 59 570 11.2 (11.12% to 11.28%) 59 128 11.1 (11.02% to 11.18%) 442 29.0 (26.72% to 31.28%
Persons living alone (community) 142 153 30.7 (30.58% to 30.82% 141 936 26.8 (26.68% to 26.92%) 217 14.2 (12.45% to 15.95%
Place of birth
Other municipality than that where resides actually 192 492 36.2 (36.07% to 36.33%) 191 883 36.2 (36.07% to 36.33%) 609 39.9 (37.44% to 42.36%)
0.003
Same parish 229 998 43.2 (43.07% to 43.33%) 229 425 43.2 (43.07% to 43.33%) 573 37.5 (35.07% to 39.93%)
Same municipality, but other parish 98 083 18.4 (18.3% to 18.5%) 97 785 18.4 (18.3% to 18.5%) 298 19.5 (17.51% to 21.49%)
Other country 13 172 2.5 (2.46% to 2.54%) 13 126 2.5 (2.46% to 2.54%) 46 3.1 (2.23% to 3.97%) Income source Pension 512 620 96.3 (96.25% to 96.35%) 511 176 96.3 (96.25% to 96.35%) 1444 94.6 (93.47% to 95.73%) 0.265 Family support 9018 1.7 (1.67% to 1.73%) 8977 1.7 (1.67% to 1.73%) 41 2.7 (1.89% to 3.51%) Properties or business 3265 0.6 (0.58% to 0.62%) 3248 0.6 (0.58% to 0.62%) 17 1.1 (0.58% to 1.62%) Social support 1197 0.2 (0.19% to 0.21%) 1183 0.2 (0.19% to 0.21%) 14 0.9 (0.43% to 1.37%) Work 2258 0.4 (0.38% to 0.42%) 2249 0.4 (0.38% to 0.42%) 9 0.6 (0.21% to 0.99%) Other 3475 0.6 (0.58% to 0.62%) 3474 0.7 (0.68% to 0.72%) 1 0.07 (-0.06% to 0.2%) Religion Catholic 467 715 87.9 (87.81% to 87.99% 466 399 87.9 (87.81% to 87.99% 1316 86.2 (84.47% to 87.93% 0.139 Without religion 13 904 2.6 (2.56% to 2.64%) 13 880 2.6 (2.56% to 2.64%) 24 1.6 (0.97% to 2.23%) Other 10 726 2.0 (1.96% to 2.04%) 10 701 2.0 (1.96% to 2.04%) 25 12.2 (10.56% to 13.84%) Do not answer 39 874 7.5 (7.53% to 7.67%) 39 713 7.5 (7.43% to 7.57%) 161 10.6 (9.06% to 12.14%) Nationality Portuguese 52 5298 98.7 (98.67% to 98.73%) 52 3801 98.7 (98.67% to 98.73%) 1497 98.1 (97.42% to 98.78%) 0.270 Foreign 31 127 5.8 (5.74% to 5.86%) 31 108 0.6 (0.58% to 0.62% 19 1.2 (0.65% to 1.75%) Dual nationality 3791 0.7 (0.68% to 0.72%) 3781 0.7 (0.68% to 0.72%) 10 0.7 (0.28% to 1.12%)
ARTIGO ORIGINAL Table 1 - Sociodemographic characteristics of the Portuguese 2011 Census sample of oldest old
Total 80 - 99 yrs 100+ yrs p
n = 532 219 n = 530 693 n = 1526
Sociodemographic characteristics n % (IC 95%) n % (IC 95%) n % (IC 95%)
Gender Female 343 491 64.5 (64.37% to 64.63%) 342 238 64.5 (64.37% to 64.63%) 1253 82.1 (80.18% to 84.02%) < 0.001 Male 188 728 35.5 (35.37% to 35.63%) 188 455 35.5 (35.37% to 35.63%) 273 17.9 (15.98% to 19.82%) Marital status Widowed 287 032 53.9 (53.77% to 54.03%) 285 781 53.9 (53.77% to 54.03%) 1251 82.0 (80.07% to 83.93%) 0.013 Married 193 654 36.4 (36.27% to 36.53%) 193 568 36.5 (36.37% to 36.63%) 86 5.6 (4.45% to 6.75%) Single 39 360 7.4 (7.33% to 7.47%) 39 188 7.4 (7.33% to 7.47%) 172 11.3 (9.71% to 12.89%) Divorced 10 146 1.9 (1.86% to 1.94%) 10 130 1.9 (1.86% to 1.94%) 16 1.0 (0.5% to 1.5%)
Common law marriage 4685 0.9 (0.87% to 0.93%) 4676 0.9 (0.87% to 0.93%) 9 0.6 (0.21% to 0.99%)
Separated 2027 0.4 (0.38% to 0.42%) 2026 0.4 (0.38% to 0.42%) 1 0.07 (-0.06% to 0.2%)
Education (yrs completed)
Illiterate 245 506 46.1 (45.97% to 46.23%) 244 566 46.1 (45.97% to 46.23%) 940 61.6 (59.16% to 64.04%) 0.009 4 years 223 185 41.9 (41.77% to 42.03%) 222 749 42.0 (41.87% to 42.13%) 436 28.6 (26.33% to 30.87%) 6 years 14 124 2.6 (2.56% to 2.64%) 14 082 2.7 (2.66% to 2.74%) 42 2.8 (1.97% to 3.63%) 9 years 18 115 3.4 (3.35% to 3.45%) 18 066 3.4 (3.35% to 3.45%) 49 3.2 (2.32% to 4.08%) 12 years 14 817 2.8 (2.76% to 2.84%) 14 787 2.8 (2.76% to 2.84%) 30 1.9 (1.22% to 2.58%) Higher education 16 475 3.1 (3.05% to 3.15%) 16 446 3.0 (2.95% to 3.05%) 29 1.9 (1.22% to 2.58%) Residence Community 472 649 88.8 (88.72% to 88.88%) 471 565 88.9 (88.82% to 88.98%) 1084 71.0 (68.72% to 73.28% 0.227 Institution 59 570 11.2 (11.12% to 11.28%) 59 128 11.1 (11.02% to 11.18%) 442 29.0 (26.72% to 31.28%
Persons living alone (community) 142 153 30.7 (30.58% to 30.82% 141 936 26.8 (26.68% to 26.92%) 217 14.2 (12.45% to 15.95%
Place of birth
Other municipality than that where resides actually 192 492 36.2 (36.07% to 36.33%) 191 883 36.2 (36.07% to 36.33%) 609 39.9 (37.44% to 42.36%)
0.003
Same parish 229 998 43.2 (43.07% to 43.33%) 229 425 43.2 (43.07% to 43.33%) 573 37.5 (35.07% to 39.93%)
Same municipality, but other parish 98 083 18.4 (18.3% to 18.5%) 97 785 18.4 (18.3% to 18.5%) 298 19.5 (17.51% to 21.49%)
Other country 13 172 2.5 (2.46% to 2.54%) 13 126 2.5 (2.46% to 2.54%) 46 3.1 (2.23% to 3.97%) Income source Pension 512 620 96.3 (96.25% to 96.35%) 511 176 96.3 (96.25% to 96.35%) 1444 94.6 (93.47% to 95.73%) 0.265 Family support 9018 1.7 (1.67% to 1.73%) 8977 1.7 (1.67% to 1.73%) 41 2.7 (1.89% to 3.51%) Properties or business 3265 0.6 (0.58% to 0.62%) 3248 0.6 (0.58% to 0.62%) 17 1.1 (0.58% to 1.62%) Social support 1197 0.2 (0.19% to 0.21%) 1183 0.2 (0.19% to 0.21%) 14 0.9 (0.43% to 1.37%) Work 2258 0.4 (0.38% to 0.42%) 2249 0.4 (0.38% to 0.42%) 9 0.6 (0.21% to 0.99%) Other 3475 0.6 (0.58% to 0.62%) 3474 0.7 (0.68% to 0.72%) 1 0.07 (-0.06% to 0.2%) Religion Catholic 467 715 87.9 (87.81% to 87.99% 466 399 87.9 (87.81% to 87.99% 1316 86.2 (84.47% to 87.93% 0.139 Without religion 13 904 2.6 (2.56% to 2.64%) 13 880 2.6 (2.56% to 2.64%) 24 1.6 (0.97% to 2.23%) Other 10 726 2.0 (1.96% to 2.04%) 10 701 2.0 (1.96% to 2.04%) 25 12.2 (10.56% to 13.84%) Do not answer 39 874 7.5 (7.53% to 7.67%) 39 713 7.5 (7.43% to 7.57%) 161 10.6 (9.06% to 12.14%) Nationality Portuguese 52 5298 98.7 (98.67% to 98.73%) 52 3801 98.7 (98.67% to 98.73%) 1497 98.1 (97.42% to 98.78%) 0.270 Foreign 31 127 5.8 (5.74% to 5.86%) 31 108 0.6 (0.58% to 0.62% 19 1.2 (0.65% to 1.75%) Dual nationality 3791 0.7 (0.68% to 0.72%) 3781 0.7 (0.68% to 0.72%) 10 0.7 (0.28% to 1.12%)
ARTIGO ORIGINAL and place of birth varied according to the age group. A higher percentage of women (82.1%) was found in the centenarian group when compared to the octogenarian/ nonagenarian group (64.5%), and a higher percentage of widowed and singles was found among centenarians than among octogenarians/nonagenarians (82.0% vs 53.9%, and 11.3% vs 7.4%, respectively). Data also pointed to a higher percentage of centenarians being illiterate (61.6%
vs 46.1%), and a higher percentage of octogenarians/
nonagenarians than centenarians living in the same parish where they were born (43.2% vs 37.5%).
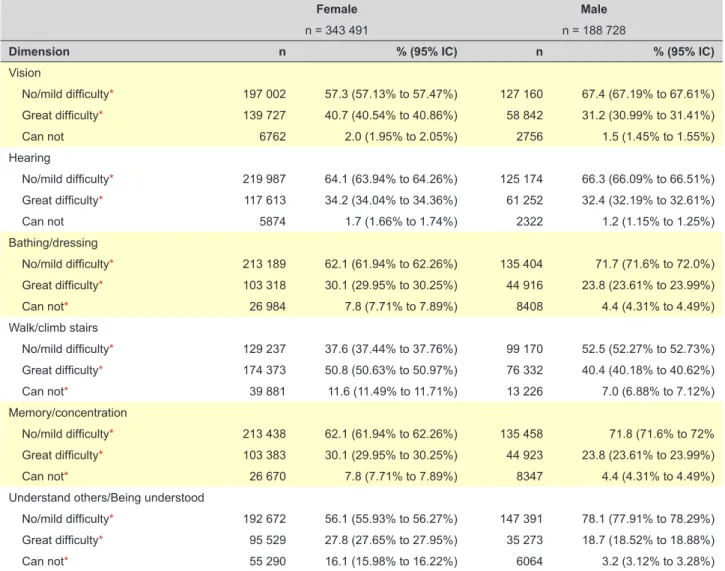
A first look at self-reported disability (Fig. 1) showed major constrains in walk/climb stairs (57.1%), vision (39.1%) and hearing (35.1%), and less constrains in understanding others/being understood (25.9%) and memory/concentration (34.4%). The dimensions with higher percentage of people mentioning a total incapacity were bathing/dressing (14.3%) and walk/climb stairs (10.0%). On the contrary, vision (1.8%) and hearing (1.5%) were the dimensions with lower percentages of total incapacity. The analysis of self-reported difficulties by gender (Table 2) points to higher percentages of total incapacity in women in all the assessed dimensions, differences only not significant for vision and hearing. The more accentuated differences were found in understand others/being understood (16.1% in women vs 3.2% in men) and walk/ climb stairs (11.6% vs 7.0%).
The existence of problems in sensorial, functional and cognitive status, and communication was also assessed considering a distinction between octogenarians/ nonagenarians and centenarians.
In what regards sensory functions (Fig. 2), 33.5% of the octogenarians/nonagenarians mentioned having great difficulties in hearing and 37.2% in vision, while in the centenarian group these percentages were higher (63.4% and 58.2%, respectively). Also notable is the higher percentages of total incapacity in hearing compared with vision, which was present in both sub-groups, but was specially accentuated in the centenarian group (89.0%
vs 9.2%). Analysis by age group revealed significant
differences for vision (p < 0.05), but not for hearing. In respect to functional status (Fig. 3), 25.2% of octogenarians/nonagenarians reported having great Sociodemographic characteristics include gender
(male; female), marital status (married; common law marriage; single; widowed; divorced; separated), years of education completed (illiterate; 4 years; 6 years; 9 years; 12 years; high education), income (pension; family support; properties or business; social support; other), religion (catholic; other; without religion; not available), type of residence (community; institution), place of birth (other municipality than that where resides actually; same parish; same municipality, but other parish; other country), and nationality (Portuguese; foreign; dual nationality).
Information on the presence of difficulties in: (i) sensory status (“difficulty seeing, even if wearing glasses”; “difficulty hearing, even in using a hearing aid”) (ii) functional status (“difficulty in walking or climbing steps”; “difficulty (with self-care such as washing all over or dressing”) (iii) cognition (“difficulty remembering or concentrating”) and (iv) communication (“difficulty communicating, for example understanding or being understood by others”) was analyzed to assess self-reported disability. These six questions included in the census questionnaire regarding the individual´s functionality were developed by the Washington Group on Disability Statistics, and evaluate the ability to perform several activities of daily living.16 This set of
questions is consistent with the International Classification of Functioning, Disability and Health.
Exploratory descriptive analyses were performed in order to obtain the profile of the Portuguese oldest old. Results were presented for the total sample, and for the subgroup of centenarians versus octogenarians/nonagenarians. Differences between the two sub-samples were explored using Chi-Square tests, and gender differences in the perceived difficulties were also explored. A significance level of α = 0.05 was considered.
RESULTS
There were 534 219 people aged 80 and over living in Portugal in the data of the 2011 Census, of which 530 693 (99.7%) had between 80 and 99 years, and 1526 (0.3%) have 100 or more years. Most were women (64.5%), widowed (53.9%) or married (34.6%). Regarding education, most never attended school (46.1%) or had completed only 4 years of education (41.9%); a minority had higher education (3.1%). About half (43.2%) were born in the place they currently live, and 18.4% lived in the same municipality, but other parish. The majority lived in private households (88.8%) and 30.7% lived alone. Noteworthy is the fact that the great majority of centenarians lived in the community (71.0%); and that among these, 14.2% lived alone. Monthly income came mostly from their own pension (96.3%), and 1.7% relied on their family as the main source of economic support. The majority was catholic (87.9%). Descriptive characteristics for the total sample, octogenarians/ nonagenarians and centenarians are summarized in Table 1.
Analysis of the sociodemographic characteristics by
age group revealed that gender, marital status, education Figure 1munication of the portuguese oldest old (Census, 2011) – Sensorial status, functionality, cognitive status and com-No/Mild difficulty Great difficulty Can not
Vision 74.1% 65.5% 42.9% 60.4% 64.9% 60.9% 21.1% 27.9% 47.1% 25.2% 33.6% 37.3% 4.8% 6.5% 10.0% 14.3% 1.5% 1.8% Hearing Bathing/Dressing Walk/Climb stairs Memory/Concentration Understand others/Being understood
ARTIGO ORIGINAL
Figure 2 – Sensorial status of the oldest old (80 - 99 years vs 100+ years) No/ Mild difficulty No/ Mild difficulty Great difficulty Great difficulty
Can not Can not
Vision 65.0% 33.5% 15.0% 61.0% 37.2% 1.8% 27.7% 63.4% 89.0% 32.6% 58.2% 9.2% Hearing 80 - 99 yrs 100+ yrs Sensorial status
difficulties in bathing/dressing alone, and 47.1% in walking/ climbing stairs. In the centenarian group these percentages were higher for bathing/dressing alone (34.2%), but similar for walking/climbing stairs (46.2%). Likewise, higher percentages of total incapacity were found for bathing/ dressing than for walking/climbing stairs in both groups (14.2% vs 9.9% in octogenarians/nonagenarians and 46.5% vs 37.5% in centenarians). Significant differences by age group were found for both bathing/dressing and
walking/climbing stairs
In respect to cognition and communication (Fig. 4), 27.8% of octogenarians/nonagenarians reported having great difficulties in memory/concentration, and 21.0% great difficulties in understand others/being understood. In the centenarian group, the percentages increase to 38.9% and 39.7%, respectively. Similarly, higher percentages of total incapacity were found for memory/concentration when compared to understanding others/being understood, which
Figure 3 – Functional status of the oldest old (80 - 99 years vs 100+ years) No/ Mild difficulty No/ Mild difficulty Great difficulty Great difficulty
Can not Can not
Walk/Climb stairs 60.6% 25.2% 14.2% 43.0% 47.1% 9.9% 19.3% 34.2% 46.5% 16.3% 46.2% Bathing/Dressing 80 - 99 yrs 100+ yrs Functional status 37.5% Table 2 - Sensorial status, functionality, cognitive status and communication of the portuguese oldest old, by gender (Census, 2011)
Female Male
n = 343 491 n = 188 728
Dimension n % (95% IC) n % (95% IC)
Vision No/mild difficulty* 197 002 57.3 (57.13% to 57.47%) 127 160 67.4 (67.19% to 67.61%) Great difficulty* 139 727 40.7 (40.54% to 40.86%) 58 842 31.2 (30.99% to 31.41%) Can not 6762 2.0 (1.95% to 2.05%) 2756 1.5 (1.45% to 1.55%) Hearing No/mild difficulty* 219 987 64.1 (63.94% to 64.26%) 125 174 66.3 (66.09% to 66.51%) Great difficulty* 117 613 34.2 (34.04% to 34.36%) 61 252 32.4 (32.19% to 32.61%) Can not 5874 1.7 (1.66% to 1.74%) 2322 1.2 (1.15% to 1.25%) Bathing/dressing No/mild difficulty* 213 189 62.1 (61.94% to 62.26%) 135 404 71.7 (71.6% to 72.0%) Great difficulty* 103 318 30.1 (29.95% to 30.25%) 44 916 23.8 (23.61% to 23.99%) Can not* 26 984 7.8 (7.71% to 7.89%) 8408 4.4 (4.31% to 4.49%) Walk/climb stairs No/mild difficulty* 129 237 37.6 (37.44% to 37.76%) 99 170 52.5 (52.27% to 52.73%) Great difficulty* 174 373 50.8 (50.63% to 50.97%) 76 332 40.4 (40.18% to 40.62%) Can not* 39 881 11.6 (11.49% to 11.71%) 13 226 7.0 (6.88% to 7.12%) Memory/concentration No/mild difficulty* 213 438 62.1 (61.94% to 62.26%) 135 458 71.8 (71.6% to 72% Great difficulty* 103 383 30.1 (29.95% to 30.25%) 44 923 23.8 (23.61% to 23.99%) Can not* 26 670 7.8 (7.71% to 7.89%) 8347 4.4 (4.31% to 4.49%)
Understand others/Being understood
No/mild difficulty* 192 672 56.1 (55.93% to 56.27%) 147 391 78.1 (77.91% to 78.29%)
Great difficulty* 95 529 27.8 (27.65% to 27.95%) 35 273 18.7 (18.52% to 18.88%)
Can not* 55 290 16.1 (15.98% to 16.22%) 6064 3.2 (3.12% to 3.28%)
ARTIGO ORIGINAL
occurred in both groups (6.5% vs 4.8% in octogenarians/ nonagenarians, and 22.0% vs 17.8% in centenarians). Significant differences by age group were found for memory/concentration, but not for understanding others/ being understood.
Only 0.3% octogenarians/nonagenarians and 2.5% centenarians showed no capacity in all considered dimensions (functional, sensorial, cognitive and communication functions) concurrently. On the contrary,
27.4% octogenarians/nonagenarians, and 6.0%
centenarians presented no/mild difficulties in all considered dimensions.
DISCUSSION
The sociodemographic profile of the Portuguese oldest old is globally in line with previous studies on the oldest old population.17,18 The existence of significant differences
in some sociodemographic characteristics and sensorial, functional and cognitive status reinforces the heterogeneity of the older population, even in the oldest subgroup (centenarians). Gender differences on life expectancy (higher for women) are commonly cited in the literature19-21
and corroborated by the preponderance of females in our study.
The high levels of illiteracy of the Portuguese oldest old can be a distinct aspect when considering other European countries. In general, the portuguese old population attended school for a mean of 5.79 years, which is clearly bellow the mean of the European countries that participated in the 4th wave of SHARE (Denmark, Sweden, Austria,
France, Germany, Switzerland, Belgium, Netherlands, Spain, Italy, Greece, Estonia, Hungary, Luxemburg, Portugal and Slovenia) with a mean of 10.4 years of schooling.22
Illiteracy is decreasing and the new cohorts arriving to old age are successively more educated, but the current cohort of old people evidently attained low levels of education or were even unschooled. Findings from the last Portuguese population census revealed that 46.1% of the 80 - 99 years old people never attended school; the percentage of illiteracy rises to 61.6% in centenarians. In Portugal the low level of education and the illiteracy of older cohorts seem associated with poor aging outcomes, namely cognition.23 According to
findings from SHARE, Mediterranean countries that present
the highest prevalence of relative cognitive impairment have also the lowest levels of education.24 The hypothetical
influence of education in disability indicators is apparent in several studies and deserves further attention.24-26
Also noteworthy is the high percentage of individuals living in the community. This finding is consistent with previous studies around the world on oldest old and centenarians27,28 but in order to interpret this finding we
must consider the strong tradition of family care in southern countries, where Portugal is included, and the frequent desire of older persons to stay at home for as long as possible.29,30 Among those living in the community, our data
revealed that about one-third lives alone. A report about health and incapacities in Portugal revealed that more than half of older persons (≥ 65 years) lived alone or accompanied exclusively by other older persons.31 The SHARE project
found even higher percentages for those 80 and plus, with 56% of the community-dwellers living alone.32 Living alone
with an advanced age can be challenging, and contribute to a higher risk of unmet care needs.33 Those who live alone
seem to be more likely to have health problems, have fewer social contacts and not receive help with their functional limitations, increasing the risk of under met needs.34
Another important finding from the SHARE project is that children were the most important group to provide help to their parents in all countries considered. Accordingly, preliminary findings from the first population-based study on portuguese centenarians found that more than half of the sample lived in the community, and among these, 36% lived with their children.35 Nevertheless, the advanced age
and (potential) existence of health problems of their children (which can also be older persons), along with a decrease in the number of children and persons per household, constitute serious challenges to their availability to provide care, and assure their long-term care needs. Moreover, the parent support ratio (the ratio of the population 85 or older to those aged 50 to 64) in 2000 was estimated in 4 persons aged 85 or older for every 100 persons aged 50 - 64, and it is projected to reach to 11 per 100 in 2050, in a global level.36 Data on this indicator for Europe follows the same
direction: in 2007 the parent support ratio was estimated in 8.1, and it is projected to reach 12.9 in 2025.37 Taking
into account all of these aspects it seems of particular importance the development of home and community-based support services, and the promotion of neighborhood networks. Moreover, more attention to the impacts of caregiving demands is needed, namely in order to study (possible) differences in the impacts felt by caregiving of oldest old patients compared with those caring for younger older patients.
In Portugal, life expectancy at age 65 was 21.6 years for women and 17.8 years for men in 2011, representing an increase of 2.5 years for women and 2.1 years for men over the period 2001 - 2011. But the number of healthy life years is also important. In 2011, at age 65 women and men could expect to spend 29% and 44% of their life without self-reported long-term activity limitations, respectively.38
Figure 4 – Cognition and communication of the oldest old (80 - 99 years vs 100+ years) No/ Mild difficulty No/ Mild difficulty Great difficulty Great difficulty
Can not Can not
Understand others/Being understood 65.6% 27.8% 6.5% 74.2% 21.0% 4.8% 39.1% 38.9% 22.0% 42.5% 39.7% 17.8% Memory/Concentration 80 - 99 yrs 100+ yrs
ARTIGO ORIGINAL
Despite this positive trend for the older portuguese population, our findings generally showed the presence of high levels of self-reported disability, particularly in personal activities of daily living (ADL) and, secondly, on sensorial functions (hearing and vision), and reinforced the worst health and functional condition of women when compared to men. Sensory losses in older adults commonly compromise the ability to social participation, and can concur to negative outcomes, such us depression. Thus, this finding reinforces the importance of assessing sensory impairments in this population, and their impacts in the capacity for independent living, in order to a better identification and management of the difficulties, and subsequently a promotion of an active and participative ageing. This is of particular relevance when we observe that more than half of the oldest old included in the study reported having no/mild difficulties in cognitive functions (i.e., memory/concentration; understand others and being understood), which emphasizes the potential autonomy that these individuals may retain, regardless of the functional impairments. The increasing proportion of older people reinforces the importance of organizing and delivering care in a way that gives the opportunity to maintain the individual’s greatest amount of control, even when they are dependent on others for help in everyday life. Thus, health promotion (the process of enabling people to take control over and to improve their health) should be a key goal to policy makers, and contemplated in healthcare policies for very advanced ages.39
Older age has been associated with a decline in functional status and an increase in long-term conditions.40 Considering
this, the observed higher prevalence of difficulties in all the dimensions considered in the centenarians subgroup when compared to the octogenarians/nonagenarians subgroup is somewhat expected. Nevertheless, when evaluating in more detail the differences between the two subgroups, differences were only significant for vision, bathing/dressing, walking/climbing stairs and memory/concentration. This suggests that as age advances the greater impact is in the (perceived) ability to perform personal activities of daily living, which can be associated with the difficulties in vision and memory/concentration commonly reported in the centenarian population.27 A recent portuguese study that
compared oldest old with younger older adults on health objective indicators, also found a global deterioration with age, with a diminution of sensorial capacities, and increase in functional impairment, especially in instrumental activities of daily living.41 Some studies verified that older
persons with dual sensory loss are at risk for decreased everyday competence and capacity for independent living.42
Considering this, vision and hearing screening should be part of regular physical assessment for older individuals, and healthcare providers need to be sensitive to the importance of the identification of sensory impairment to outline subsequent interventions, which can include effective vision and hearing rehabilitation and help in maintaining functional independence by specific helping devices.
Finally, certain limitations of the present study should
be addressed. Firstly, the subjective measurement of the dimensions considered (sensory functions, functional status, cognition and communication), which can contribute to an underestimation of the difficulties.43,44 The census
methodology does not account for the presence of objective information, so we had to rely on self-perceived difficulties. It is important to mention, though, that other studies pointed to the validity of self-report functional disability measures among older adults, as well as a high correlation between self-reported disability and health status.45,46 Secondly,
caution is also needed when analyzing the results regarding the low percentages of cognitive impairment. Along with the self-report of difficulty, it is possible that it was a family member or the interviewer who filled the census questionnaire in those cases where the older person didn´t had the capacity to respond autonomously. Regardless of these two major limitations, we believe the obtained profile provides valuable information to develop intervention programs directed to this population, and allows for the identification of areas requiring further attention. Longevity constitutes a challenging phenomenon to health and social care services, as well as to the families. The significant levels of functional incapacity, along with the preponderance of community-dwellers, highlight the great need of support from informal caregiving and formal in-home care services. Such services should be designed in order to cover the oldest old functional needs, without constraining autonomy. Programs of financial assistance to the oldest old and their caregivers, as well as the recognition of the role of the informal caregivers should therefore be implemented.
CONCLUSION
Currently little is known about the characteristics and functional status of the portuguese oldest old. This study provides important descriptive information on this population, and revealed a higher percentage of constrains in ADL and sensorial aspects. Conversely, the majority seems to maintain their ability to understand others/being understood and in cognitive dimensions (memory/concentration). Taken together, these findings suggest the need for assistance, which can be ultimately managed by the older person him/herself. Nonetheless, the subjective measurement of the dimensions considered in the census implies some interpretative cautions, since an underestimation of the difficulties can be present. Considering that most individuals lived in the community, informal caregivers, namely family members, are expected to play a very important role in the care provision. Further studies should be conducted, namely by considering more detailed and objective analyses of functionality and memory, since the characteristics of the oldest old remain poorly described in the national context. Having this profile can result in important implications for healthcare and social services planning for an ageing population.
ACKNOWLEDGEMENTS
ARTIGO ORIGINAL for providing the data and for assistance in a first analysis of the data coding system, and Lia Araújo (UNIFAI and Polytechnic Institute of Viseu - ESEV), for support with a first analysis of the data coding system.
PROTECTION OF HUMANS AND ANIMALS
This study was conducted in accordance with the principles of the Declaration of Helsinki, ICH Guidelines for Good Clinical Practice and in full conformity with relevant regulations. Patients provided written informed consent for study participation. The study protocol was approved by the local ethics committee.
DATA CONFIDENTIALITY
The authors declare having followed the protocols in use at their working center regarding patients’ data publication.
CONFLICTS OF INTEREST
All authors report no conflict of interest.
FUNDING SOURCES
This work was supported by FCT (Portuguese Foundation for Science and Technology) under a PhD Grant for the first author (SFRH/BD/101595/2014).
REFERENCES
1. Herm A, Cheung SL, Poulain M. Emergence of oldest old and centenarians: Demographic analysis. Asian J Gerontol Geriatr. 2012;7:19-25.
2. United Nations. World Population Ageing 2015 – Highlights. New York: Department of Economic and Social Affairs, Population Division; 2015. 3. Instituto Nacional de Estatística. Censos - Resultados definitivos.
Região Norte – 2011. Lisboa: INE; 2012.
4. Instituto Nacional de Estatística. Projeções de população residente 2012-2060. Lisboa: INE; 2014.
5. United Nations. Active Ageing Index 2014. Analytic Report. Report prepared by Asghar Zaidi of Centre for Research on Ageing, University of Southampton and David Stanton, under contract with United Nations Economic Commission for Europe (Geneva), co-funded by European Commission’s Directorate General for Employment, Social Affairs and Inclusion (Brussels); 2015.
6. Santana P. Integration of care systems in portugal: autonomy of recent reforms. Int Jl Integr Care. 2014;14:24.
7. Gu D, Feng Q. Frailty still matters to health and survival in centenarians: the case of China. BMC Geriatr. 2015;15:159.
8. Duarte N, Teixeira L, Ribeiro O, Paúl C. Frailty phenotype criteria in centenarians: findings from the Oporto Centenarian Study. Eur Geriatr Med. 2014;5:371-6.
9. Fried L, Ferrucci L, Darer J, Williamson J, Anderson G. Untangling the concepts of disability, frailty, and comorbidity: implications for improved targeting and care. J Gerontol A Biol Sci Med Sci. 2004;59:M255-63. 10. van Houwelingen A, Cameron I, Gussekloo J, Putter H, Kurrle S, de
Craen A, et al. Disability transitions in the oldest old in the general population. The Leiden 85-plus study. Age. 2014;36:483-93.
11. Andersen-Ranberg K, Schroll M, Jeune B. Healthy centenarians do not exist, but autonomous centenarians do: a population-based study of morbidity among Danish centenarians. J Am Geriatr Soc. 2001;49:900-8.
12. Jeune B. Living longer-but better? Aging Clin Exp Res. 2002;14:72–93. 13. Scheetz L. Utilization of care services among the oldest old [thesis],
2010. [Accessed 2015 Dec 1]. Available from http://lib.dr.iastate.edu/cgi/ viewcontent.cgi?article=2739&context=etd.
14. MacDonald M, Aneja A, Martin P, Margrett J, Poon LW. Distal and proximal resource influences on economic dependency among the oldest old. Gerontology. 2010;56:100-5.
15. Serra V, Watson J, Sinclair D, Kneale D. Living beyond 100. A report on centenarians. London: ILKUK; 2011.
16. Madans J, Loeb M, Altman B. Disabilities: the work of the Washington Group on Disability Statistics. BMC Public Health. 2011;11:S4. 17. Santana P. Ageing in Portugal: regional iniquities in health and health
care. Soc Sci Med. 2000;50:1025-36.
18. Tomassini C. The demographic characteristics of the oldest old in the United Kingdom. Popul Trends. 2005;Summer:15-22.
19. Chatterji S, Byles J, Cutler D, Seeman T, Verdes E. Health, functioning, and disability in older adults-present status and future implications. Lancet. 2015;385:563–75.
20. Gu D, Dupreb M, Liuc G. Characteristics of the institutionalized and community-residing oldest-old in China. Soc Sci Med. 2007;64:871–83. 21. Solé-Auró A, Beltrán-Sánchez H, Crimmins E. Are differences in
disability-free life expectancy by gender, race, and education widening at older ages? Popul Res Policy Rev. 2015;34:1-18.
22. Cabral MV, da Silva P, Batista M. Envelhecimento em Lisboa, Portugal e Europa: uma perspectiva comparada. Inquérito SHARE [2010-2011].
Lisboa: Instituto do Envelhecimento da Universidade de Lisboa; 2015. 23. Paúl C, Ribeiro O, Teixeira L. Active ageing: an empirical approach to
the WHO model. Curr Gerontol Geriatr Res. 2012;382972.
24. Dewey ME, Prince MJ. Mental health. In: Börsch-Supan A, Brugiavini A, Jürges H, Mackenbach J, Siegrist J, Weber G, editors. Health, ageing and retirement in Europe - first results from the Survey of Health, Ageing and Retirement in Europe. Mannheim: MEA; 2005. p. 108-17. 25. Amaducci L, Maggi S, Langlois J, Minicuci N, Baldereschi M, Di Carlo A,
et al. Education and the risk of physical disability and mortality among men and women aged 65 to 84: The Italian longitudinal study on aging. J Gerontol A Biol Sci Med Sci. 1998;53A:M484-90.
26. Bruusgaard D, Smeby L, Claussen B. Education and disability pension: a stronger association than previously found. Scand J Public Health. 2010;38:686-90.
27. Cimarolli V, Jopp D. Sensory impairments and their associations with functional disability in a sample of the oldest-old. Qual Life Res. 2014;23:1977–84.
28. Gondo Y, Hirose N, Arai Y, Inagaki H, Masui Y, Yamamura K, et al. Functional status of centenarians in Tokyo, Japan: developing better phenotypes of exceptional longevity. J Gerontol A Biol Sci Med Sci. 2006;61:305–10.
29. Lopes A. New approaches to familism in the management of social policy for old age in Portugal. In: Troisi J, Von-Kondratowitz H, editors. Ageing in the Mediterranean. Chicago: Policy Press; 2013. p. 215-34. 30. Sundström G, Malmberg B, Sancho Castiello M, del Barrio É, Castejon
P, Tortosa M, et al. Family care for elders in Europe: policies and practices. In: Szinovacz M, Davey A, editors. Caregiving contexts. Cultural, familial, and societal implications. New York: Springer; 2008. p. 235-68.
31. Instituto Nacional de Estatística. Saúde e incapacidades em Portugal 2011. Lisboa: INE; 2012.
32. Andersen-Ranberg K, Petersen I, Robine JM, Christensen K. Who are the oldest old? In: Börsch-Supan A, [outros cinco editors], et al, editors. Health, ageing and retirement in Europe - first results from the Survey of Health, Ageing and Retirement in Europe. Mannheim: MEA; 2005. p.35-40.
33. Zhu H. Unmet needs in long-term care and their associated factors among the oldest old in China. BMC Geriatr. 2015;15:46.
34. Peng R, Wu B, Ling L. Undermet needs for assistance in personal activities of daily living among community-dwelling oldest old in China from 2005 to 2008. Res Aging. 2015;37:148-70.
35. Ribeiro O, Araújo L, Teixeira L, Duarte N, Brandão D, Martín I, et al. Health status, living arrangements and sService use at 100. Findings from the Oporto Centenarian Study. J Aging Soc Policy. 2016;28:148-64. 36. United Nations. World Population Ageing 1950-2050. New York:
Department of Economic and Social Affairs, Population Division; 2002. 37. Gavrilova N, Gavrilov L. Rapidly aging populations: Russia/Eastern
Europe. In: Unlenberg P, editor. International Handbook of Population Aging. Dordrecht: Springer; 2009. p. 113-33.
38. European Health and Life Expectancy Information System (EHLEIS). Health Expectancy in Portugal [report]; 2014. [Accessed 2015 Dec 9]. Available from http://www.eurohex.eu/pdf/CountryReports_Issue7/ Portugal_Issue7.pdf.
39. World Health Organization. Active Ageing: a policy framework; 2002. [Accessed 2016 Jan 12]. Available from http://apps.who.int/iris/ bitstream/10665/67215/1/WHO_NMH_NPH_02.8.pdf.
ARTIGO ORIGINAL 100 according to sex: population-based cohort study of centenarians
using electronic health records. J Am Geriatr Soc. 2015;63:1331-7. 41. Araújo L, Ribeiro O. O paradoxo da incapacidade das pessoas muito
idosas. Acta Med Port. 2011;24:189-96.
42. Brennan M, Horowitz A, Su YP. Dual sensory loss and its impact on everyday competence. Gerontologist. 2005;45:337-46.
43. Benitez-Silva H, Buchinsky M, Chan H, Cheidvasserd S, Rust J. How large is the bias in self-reported disability? J Appl Econ. 2004;19:649–
70.
44. Gill TM, Hardy SE, Williams CS. Underestimation of disability in community-living older persons. J Am Geriatr Soc. 2002;50:1492–7. 45. Crawford S, Jette A, Tennstedt S. Test–retest reliability of self-reported
disability measures in older adults. J Amer Geriat Soc. 1997;45:338–41. 46. Young Y, Boyd C, Guralnik J, Bandeen-Roche K, Fried L. Does Self-reported function correspond to objective measures of functional impairment? J Am Med Dir Assoc. 2010;11:645–53.