e-ISSN: 2316-9834
Economic viability to generate electricity from the biogas produced
in the wastewater treatment plant
Ian Gabriel Brum Garcia1, Ronaldo Hoffmann2, Flávio Dias Mayer3, Patrícia
Andrade Paines4, Osmar Possamai5
1Master in Electrical Engineering- Universidade Federal de Santa Maria – UFSM. Santa Maria, RS – Brazil.
ian.gabriel.brum.garcia@gmail.com
2PhD in Mechanical Engineering - Universidade Federal do Rio Grande do Sul - UFRGS. Porto Alegre, RS – Brazil.
hoffmann@ct.ufsm.br
3PhD in Chemical Engineering - Universidade Federal do Rio Grande do Sul - UFRGS. Porto Alegre, RS – Brazil.
flaviodmayer@yahoo.com.br
4PhD in Production Engineering - Universidade Federal de Santa Catarina – UFSC. Florianópolis, SC – Brazil.
paines_sm@hotmail.com
5Ph D in Génie Mécanique - Université de Technologie de Compiègne – UTC. Compiègne – França.
osmar.possamai@gmail.com
Cite as:
Garcia, I. G. B., Hoffmann, R., Mayer, F. D., Paines, P. A., & Possamai, O. (2020). Economic viability to generate electricity from the biogas produced in the wastewater treatment plant.J. Environ. Manag. & Sust., 9(1), 1-17,
e13443. https://doi.org/10.5585/geas.v9i1.13443.
Abstract
Objective of the study: to present the analysis of the collected data referring to the characteristics of affluent sewage of the Serraria Sewage Treatment Station, in Porto Alegre/RS.
Methodology / approach: descriptive research with a quantitative approach and centralized in the case
study of the biogas exploration generated for the production of electric energy.
Originality / relevance: this study focuses on the technical and economic feasibility for generating electricity from biogas effluent for use at the station itself, serving most of the local loads, as well as the energy conversion technology used from of the internal combustion Cycle Otto, with its accessories.
Main results: installation, operation and maintenance costs for five years are estimated at around R$
4.500.000,00. In addition, the return on invested capital occurs, at most, in 4 years and 7 months.
Theoretical / methodological contributions: there is a tendency to increase electricity from the
network tariff and the flow of inputs in the UASBs, making self-generation even more viable. Currently, biogas is flared and the sludge generated is deposited in landfills, which makes it possible to produce electricity and supply it to the distribution network.
Conclusion: sewage treatment plants consisting of an upstream flow anaerobic sludge deposit followed
by active sludge aims to treat effluents, that is, to promote the separation of gases, solids and liquids as a form of sustainable treatment and, in addition, to provide sustainable benefits and resources for society.
Viabilidade econômica para a geração de energia elétrica a partir do biogás produzido em estação de tratamento de esgoto
Resumo
Objetivo do estudo: apresentar a análise dos dados coletados referentes às características de esgoto
afluente da Estação de Tratamento de Esgoto Serraria, em Porto Alegre/RS.
Metodologia / abordagem: pesquisa descritiva com abordagem quantitativa e centralizada no estudo de caso da exploração de biogás gerada para produção de energia elétrica.
Originalidade/relevância: este estudo concentra-se na viabilidade técnica e econômica para a
geração de eletricidade a partir de efluente de biogás para uso na própria estação, atendendo a maioria das cargas locais, e também, da tecnologia de conversão de energia empregada a partir do ciclo de combustão interna Otto, com seus acessórios.
Principais resultados: os custos de instalação, operação e manutenção por cinco anos estão
estimados em torno de R$ 4.500.000,00. Além disso, o retorno sobre o capital investido ocorre, no máximo, em 4 anos e 7 meses.
Contribuições teóricas / metodológicas: há uma tendência de aumento da eletricidade a partir da tarifa da rede e do fluxo de insumos nos UASBs, tornando a autogeração ainda mais viável. Atualmente, o biogás é queimado e o lodo gerado é depositado em aterros sanitários, o que possibilita a produção de energia elétrica e fornecimento à rede de distribuição.
Conclusão: as usinas de estação de tratamento de esgoto constituídas de depósito de lodo anaeróbio de fluxo ascendente seguida de lodos ativos têm como objetivo o tratamento de efluentes, isto é, promover a separação dos gases, sólidos e líquidos como forma de tratamento sustentável e, além disso, proporcionar benefícios e recursos sustentáveis para a sociedade.
Palavras-chave: Biogás de Esgoto. Tratamento de Esgoto. Viabilidade Econômica.
Viabilidad económica para generar electricidad a partir del biogás producido en la planta de tratamiento de aguas residuales
Resumen
Objetivo del estudio: presentar el análisis de los datos recopilados en referencia a las características
de las aguas residuales afluentes de la Estación de Tratamiento de Aguas Residuales Serraria, en Porto Alegre / RS.
Metodología/enfoque: investigación descriptiva con enfoque cuantitativo y centralizada en el estudio
de caso de la exploración de biogás generada para la producción de energía eléctrica.
Originalidad / relevancia: este estudio se centra en la viabilidad técnica y económica para generar electricidad a partir del efluente de biogás para su uso en la propia estación, que sirve a la mayoría de las cargas locales, así como la tecnología de conversión de energía utilizada del ciclo de combustión interna Otto, con sus accesorios.
Resultados principales: los costos de instalación, operación y mantenimiento durante cinco años se
estiman en alrededor de R $ 4.500.000,00. Además, el rendimiento del capital invertido se produce, como máximo, en 4 años y 7 meses.
Contribuciones teóricas / metodológicas: existe una tendencia a aumentar la electricidad de la tarifa de la red y el flujo de insumos en los UASB, haciendo que la autogeneración sea aún más viable. Actualmente, el biogás se quema y el lodo generado se deposita en vertederos, lo que permite producir electricidad y suministrarla a la red de distribución.
Conclusión: las plantas de tratamiento de aguas residuales que consisten en un depósito de lodo
anaeróbico de flujo aguas arriba seguido de lodo activo tiene como objetivo tratar los efluentes, es decir, promover la separación de gases, sólidos y líquidos como una forma de tratamiento sostenible y, además, proporcionar beneficios sostenibles y recursos para la sociedad.
Palabras clave: Biogás de aguas residuales. Tratamiento de aguas residuales. Viabilidad económica.
1 Introduction
Climate change has been accentuated and accelerated in recent decades, due to the increasing use of natural resources, especially by the consumption of fossil fuels. Climate change represents "a serious environmental problem, caused by the greenhouse effect". This phenomenon is directly related to the increase in the concentration of certain gases, with properties to retain infrared solar radiation (PEREIRA, 2004).
The greenhouse effect occurs naturally and is essential for maintaining the climate and the average temperature of the planet, allowing plant and animal life. It is characterized by the trapping of thermal energy in the lower atmosphere, increasing the average temperature in microclimates, essentially in urban areas. Among the human activities that most interfere with the causes of the greenhouse effect are those resulting from electrical generation, transportation, industrial processes, and also those from the natural cycle of organic matter. Although they are in closed cycles, the process of transformation of organic matter can aggravate the greenhouse effect, depending on the composition of the gases generated. Methane (CH4) is produced during anaerobic decomposition, mainly from agricultural activity, livestock, fossil natural gas, landfills and sewage, being one of the main gases that cause the greenhouse effect (CHERNICHARO, 2001).
One way to reduce the environmental impact of CH4 emissions to the atmosphere is by burning it. Combustion converts CH4 into carbon dioxide (CO2) and thermal energy. This alternative is usually used in Sewage Treatment Plants (STPs), where biogas is produced, mainly formed by CH4 and CO2. Thermal energy is often lost to the environment, with no use for its conversion into electrical energy.
The objective of this research is to carry out a theoretical study of the technical and economic feasibility of implementing an internal combustion engine to generate electricity from biogas from STP Serraria, Municipal Department of Water and Sewage in the city of Porto Alegre, Rio Grande do Sul, Brazil (DMAE, 2009, 2014).
To this end, biogas seen as an input, and not as waste, changes the paradigm of STPs, from energy consumers and environment polluters to an important auxiliary in the process of improving the relationship between human beings and nature, also sustainable development. Which is one of the main objectives to be achieved with initiatives of greenhouse gas emissions reduction.
2 Theoretical reference
This section is divided into three parts as part of a better understanding of the topic, which are: what are biogas, sewage treatment plants, and the energy conversion of biogas.
2.1 Biogas
The gas mixture resulting from the decomposition process of organic matter, during the anaerobic digestion stage, that is, without the presence of oxygen, is called biogas that is contained in the biomass (Bitton, 2005). In the case of sewage, biogas is in the liquid mixture with dissolved solids, removed from sand, foam and coarse inorganic solids. This matter is converted from a solid to a gaseous state by the anaerobic action of the methanogenic bacteria Archaebacterias, as shown in Figure 1.
Figure 1 -
Anaerobic digestion process (BITTON, 2005)
Source: BITTON, 2005.
The proportion of each gas in the biogas composition depends on parameters such as the substrate and the digesting environment (COLDEBELLA, 2006). The average biogas composition is shown in Table 1.
Table 1 -Biogas composition
Components Concentration
Methane (CH4) 50% - 75% (vol.)
Carbon dioxide (CO2) 25% - 45% (vol.)
Water (H2O) - moisture 2% - 7% (vol.) (20 – 40°C)
Hydrogen sulfide (H2S) 20 – 20000 ppm Nitrogen (N2) < 2% (vol.) Oxygen (O2) < 2% (vol.) Hidrogen (H2) < 1% (vol.) Source: Authors.
The potential energy as a fuel of 1.0 Nm³ of biogas, with a concentration of 50% CH4 is equivalent to: 0.53 Nm³ of natural gas, 0.63 liter of diesel oil and 0.61 liter of gasoline (COLDEBELLA, 2006).
2.2 Sewage Treatment Plants (STPs)
The STPs are systems capable of treating domestic and/or industrial wastewater, so that later the effluent can be drained with an environmental and sanitary impact at acceptable levels, using physical, chemical and biological processes. Figure 2 illustrates the flowchart of STP, which will serve as a reference in this study (TREVISAN, ORSSATTO, 2017).
The tributaries represent the sewage entrance channels, where the catchments are. During the treatment process there is the separation of the solid part dissolved in the water, resulting in effluents of three types: gaseous, liquid and wet solids (sludge) (DMAE, 2009; SALAMA, 2017)
The preliminary treatment is responsible for the separation of coarse solids, foam, grease and sand. The primary treatment aims to separate the water by the physical action of sedimentation, aided by coagulating chemical agents, flocculating the polluting matter (ZILOTTI, 2012).
Secondary treatment is a biological process, which can be activated sludge or filter type, using reactors where organic matter will be consumed by anaerobic (with no oxygen) and aerobic (in the presence of forced oxygenation) microorganisms. The efficiency of biological treatment is high: the reduction of organic matter dissolved in water reaches 95%. Subsequently, the microorganisms undergo a sedimentation process in the secondary decanters (SEMAE, 2011).
The tertiary treatment corresponds to the disinfection of the waters, being removed pathogenic organisms or nutrients that potentiate the eutrophication of the waters from rivers and seas. Normally, nitrogen and phosphorus are removed to prevent the growth of cyanophyte algae, which decrease the amount of oxygen dissolved in the water, which ends up asphyxiating fish. (CENBIO, 2004).
Figure 2 - Flow chart of sewage treatment (PEROVANO, FORMIGONI; 2011)
2.3 Energy conversion from biogas
Energy conversion is the process of transforming one type of energy into another. Biogas contains energy stored in the molecular bonds of methane, which can be converted into thermal energy by going through the combustion process. To transform thermal energy into mechanical energy, it must undergo a controlled combustion process, in a turbine specially designed to work ideally with this fuel.
The biogas turbine can activate a generator by converting mechanical energy into electrical energy. For the production of electric energy from biogas in a STP to be uninterrupted, the size of the station must meet at least a population of 10.000 inhabitants, with the respective generation capacity of 5.544 kWh / month (COSTA et al., 2001). Between the available technologies, gas turbines and combustion engines based on the Otto cycle are the most common.
Gas turbines allow greater global efficiency in electrical conversion when operated in heat and electricity cogeneration (DMAE, 2009). Figure 3 illustrates a gas turbine, which is formed by an air compressor, combustion chamber and turbine.
Figure 3 -Gas turbine in section (DMAE, 2009)
Source: DMAE, 2009.
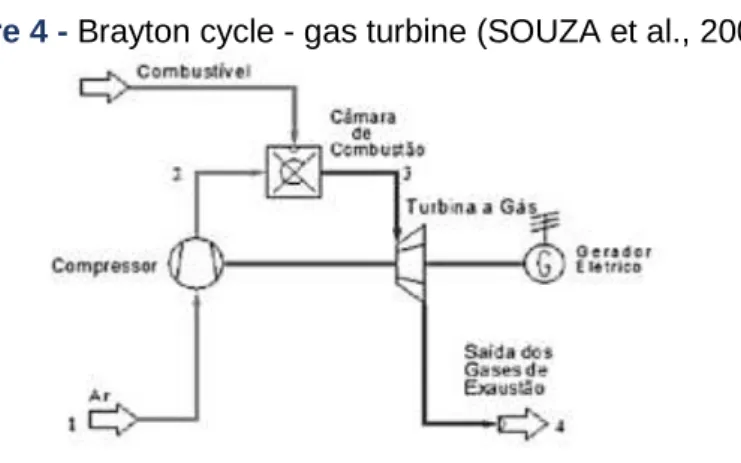
The gas turbine is smaller in size than steam turbines, as it does not use an intermediate fluid to drive the compressor. An additional advantage is the ability to operate with different fuels, such as natural gas, biogas (from CH4), kerosene, coal and biomass gases. However, it follows the Brayton Cycle with a yield of approximately 35%, as shown in Figure 4.
Figure 4 - Brayton cycle - gas turbine (SOUZA et al., 2004)
Source: SOUZA et al., 2004.
For the system consisting of a compressor, combustion chamber, turbine and electric generator, it is called “micro-turbine”, the set with power less than 250 kW and “mini-turbine”, the power range between 250 kW to 1000 kW.
3 Study methodology
The case study of this work is focused on the characteristics of the sewage found in the capture of the STP Serraria, located at the south area of Porto Alegre city at the Rio Grande do Sul State - Brazil.
The tributary undergoes treatment consisting of mechanical sieving and aerated sandbox. Subsequently, the sewage is conducted to the eight anaerobic reactors of the UASB type (Upflow Anaerobic Sludge Blanket).
Figure 5 shows an overview of the installed plant, with indications for the eight UASB reactors. The Station adopts a system that combines different process steps.
Figure 5 -Panoramic view of STP Serraria with emphasis on UASBs
Source: ETE Serraria, 2014.
Then, the sewage goes through a post-treatment system with activated sludge, with phases of nitrification and denitrification, in eight sets of equipment called Unitank (technology by the company Keppel Seghers). The advantage in using this system occurs in the reducing the installation area and the consumption of electrical energy necessary to aerate and move waste between the phases of the sewage decontamination process. The four main procedures used to analyze the project are described below: analyzes of affluent sewage, biogas, equipment and electricity generation.
3.1 Data from Affluent Sewage of the Serraria Station
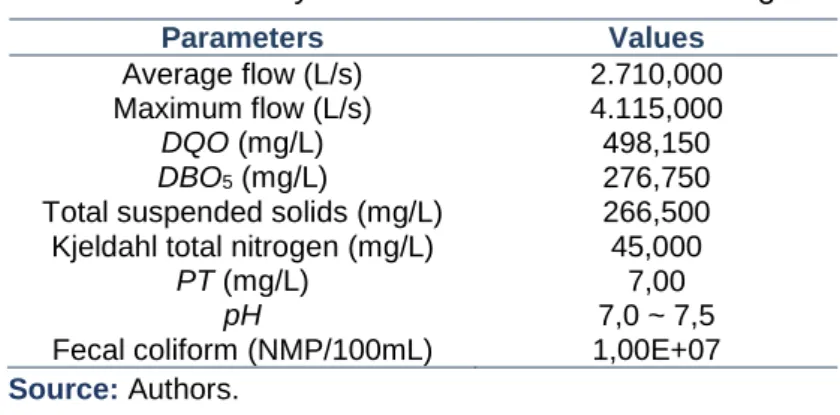
The Serraria STP was designed to perform the tertiary treatment of the collected sanitary effluents, including the removal of nitrogen and phosphorus nutrients. The UASB reactors, the object of study in this research, are contained in the secondary phase of treatment. The project was designed to treat sewage with domestic characteristics. The parameters presented in Table 2 were adopted for the dimensioning of the unit (IANNICELLI, 2008).
Table 2 -Monthly concentration of affluent sewage Parameters Values Average flow (L/s) 2.710,000 Maximum flow (L/s) 4.115,000 DQO (mg/L) 498,150 DBO5 (mg/L) 276,750
Total suspended solids (mg/L) 266,500
Kjeldahl total nitrogen (mg/L) 45,000
PT (mg/L) 7,00
pH 7,0 ~ 7,5
Fecal coliform (NMP/100mL) 1,00E+07
Source: Authors.
Currently, the ETE receives an average affluent flow of 1,000 L/s and will be gradually increased to the maximum design flow of 4,115 L/s. The operation started in March 2014, with a flow rate below 500 L/s.
3.2 Biogas Data of Serraria Station
The reactor used in this case study is of the UASB type. The operational control of the UASB’s reactors is basically based on the evaluation of four main parameters:
1 organic matter removal efficiency must be in the range of 60% to 70%;
2 Biogas production is the best indicator of the degradation of organic matter in the reactor. Theoretically 1.0 kg of COD consumed should produce 0.35 Nm³ of CH4. However, the possibility that 40% of the biogas remains dissolved in the liquid mass must be taken into account;
3 pH of the reactor should have a pH between 6.5 and 7.5 in the methanogenic phase with an ideal temperature of 35°C for anaerobic digestion. If the pH falls below this range it means that the reactor is in the acidogenic phase, volatile acid concentration above 500 mg acetic acid/L, usually due to an imbalance between the applied load and the biomass in the reactor. In this case it is advisable to reduce the organic load and not to discard sludge until the pH has recovered. In extreme cases it is possible to control the pH with the application of alkaline chemicals (GLAISTER et al., 2017).
It is worth mentioning the influence of rain on the biogas production rates in the ETE. The biogas flow has a variation coefficient of 30%. As the precipitations becomes intense (over 10 mm) there is a tendency to reduce biogas flow rates. In addition, it is estimated that rain events decrease the average annual biogas flow by 3.5% (WAISS, POSSETTI, 2015).
at the STP, with a capacity of 550 Nm³/hour. The expected average composition for biogas is 65% CH4 and 35% CO2 at 37ºC. Until the date of this work, there was no biogas production at STP Serraria. For this reason, all materials and methods raised for this case study are those considered in projects, such as data on sewage characteristics, equipment sizing and treatment systems.
3.3Equipment Proposed in the Project
For the installation of the electric power generation system based on the internal combustion engine of the Otto cycle, the following components are required (SEMAE, 2011):
a) Otto cycle engine generator set, biogas fuel; b) Gasometer suitable for the expected biogas flow;
c) Interconnection of the generation system with the burner system, previously installed;
d) Biogas filtration system, connected to the burners and exit from the UASBs; e) Biogas compression system;
f) Hydromechanical and electrical installations of the system;
g) Automation and control system for electrical generation in parallel with the grid; h) Supply and installation of the electrical system at 440V and 13.8 kV, including elevator transformer, adequate cabling between the biogas generator, transformer, entrance cabin, piping, command and control panel, parallel system with the electrical distribution network, licensing with ANEEL and other services related to electricity generation; and
i) Civil works corresponding to the construction of the electricity generation system.
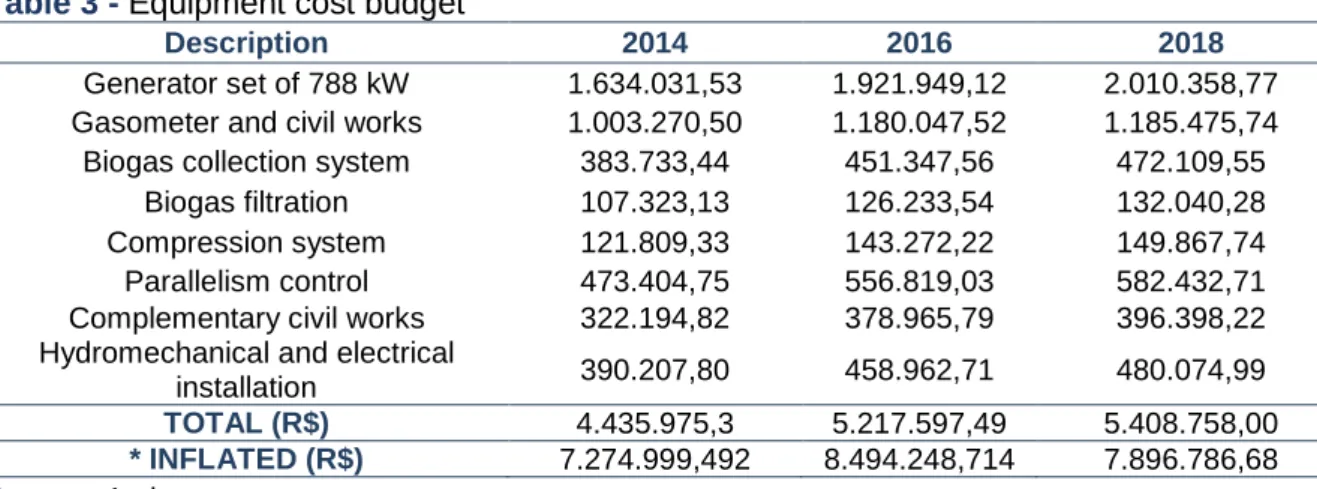
The equipment cost budgets for the generation of electricity from biogas are shown in Table III, using the system proposed by the Municipal Autonomous Water and Sewage Service of São José de Rio Preto, São Paulo (SEMAE, 2011). For the list of costs, the Índice Nacional de Preços ao Consumidor – Amplo (IPCA) for December 2014, 2016 and 2018 was updated in order to compare installation and acquisition costs with electricity values under the same reference.
Table 3 shows the inflated values under the following IPCA: 0.6407 for 2014; 0.6280 for 2016; and estimate of 0.460 for 2018, that is, total value multiplied by the IPCA index per year (*).
Table 3 -Equipment cost budget
Description 2014 2016 2018
Generator set of 788 kW 1.634.031,53 1.921.949,12 2.010.358,77
Gasometer and civil works 1.003.270,50 1.180.047,52 1.185.475,74
Biogas collection system 383.733,44 451.347,56 472.109,55
Biogas filtration 107.323,13 126.233,54 132.040,28
Compression system 121.809,33 143.272,22 149.867,74
Parallelism control 473.404,75 556.819,03 582.432,71
Complementary civil works 322.194,82 378.965,79 396.398,22
Hydromechanical and electrical
installation 390.207,80 458.962,71 480.074,99
TOTAL (R$) 4.435.975,3 5.217.597,49 5.408.758,00
* INFLATED (R$) 7.274.999,492 8.494.248,714 7.896.786,68
Source: Authors.
3.4 Capacity to Generate Electricity from Biogas
For the transformation of the chemical energy contained in biogas to electrical energy, equivalence through the lower calorific value of biogas was used.
Equation 1 makes the equivalence of the lower calorific potential of the unit kcal/kg to the calorific potential in kWh/m³ of biogas.
PCID = PE x PCI x K (1)
Being, PCID is the lower calorific potential in kWh/m³; PE is the specific weight in kg/Nm³; PCI is the lower calorific potential in kcal/kg; e K is the conversion constant from kcal to kJ to kWh equal to 4.19 kWh/3600.
With reference value for the global efficiency of the thermal machine with generator sets, according to the Otto Cycle, 25% is used, (IANNICELLI, 2008) represented by the factor 0.25 in the following equation. Eq. 2 determines the electrical power to be made available.
P = PTB x PCID x 0,25 (2)
Where, P is the electrical power available in kW; and PTB is the total biogas production in m³/h.
However,
PTB = DQO x Q x PTUASB x CH4(gasoso) (3)
PTUASB is the percentage of treatment in UASB; CH4 (gasoso) is the percentage of usable
methane in gas; e Q is the flow per hour in m³/h.
In eq. 4, demonstrates the electric energy to be made available monthly:
Being Emês the electric energy in kWh/month; h is equal to 24 hours a day; and m is
equal to 30.4167 days of the month, considering 365 days per year/12 months.
For project data from STP Serraria, the chemical composition of biogas is 65% CH4 to 35% CO2. The respective PE, in kg/Nm³ is 1.1518 and the PCI, in kcal/kg is 4,831.14 (DMAE, 2014).
According to ANEEL 414/2014 Resolution, consumer units with contracted demand above 300kW, the application of the horo-seasonal tariff modality is mandatory.
Thus, the price paid for the distributor's energy varies according to the time and period of the year. The so-called peak time is characterized by the three-hour period, usually from 6 pm to 9 pm, shifted by one hour during daylight saving time.
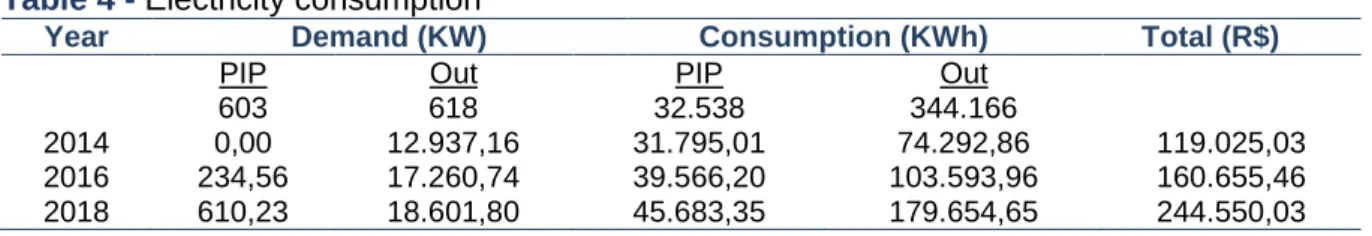
The peak of energy consumption occurs in the city of Porto Alegre/RS at this time and also in the STP itself, as water consumption in the period increases. Consequently the inlet flow grows in the same proportion. The cost of energy is 4.52 times higher during peak hours than during off-peak hours. The initial electricity consumption of STP Serraria in the reference month (December/2014, 2016 and 2018) is shown in Table 4 (DMAE, 2014).
Table 4 -Electricity consumption
Year Demand (KW) Consumption (KWh) Total (R$)
PIP Out PIP Out
603 618 32.538 344.166
2014 0,00 12.937,16 31.795,01 74.292,86 119.025,03
2016 234,56 17.260,74 39.566,20 103.593,96 160.655,46
2018 610,23 18.601,80 45.683,35 179.654,65 244.550,03
Source: Authors.
The consumption trend is increasing, since the flow of sewage initially treated was approximately 1000 L/s in December 2014, 2800 L/s in 2016 and the estimation for 2018 will be to bring the sewage flow to the maximum project value of 4,115 L/s. STP is in the commissioning phase of its reactors. For this reason, it is not necessary to collect consumption data for recurring months, as the month of study is the one with the highest demand and consumption of electricity, as well as the annual tariff readjustment.
4. Analysis and discussion of results
4.1. Evaluation of the Potential of Biogas for Conversion into Electric Energy
Applying to eq. 1 on the biogas data, which is 65% CH4 and 35% CO2, we obtain the
PCID value, in kWh/m³. The total biogas production depends on the DQO percentage of the
sewage treated in the UASB reactors, which in this case is 65% of maximum capacity. Due to the 40% discount that is retained in the sludge, 60% of biogas is effectively considered at the
The average flow (average Q) for the reference month (highest demand and consumption) was 1000 L/s in 2014, 2800 L / s in 2016 and an estimated 4100 L/s in 2018. The DQO of entry into the UASB is of 498,150 mg / l, which taking into account the Q per hour, the DQO value in kg/h is obtained.
Applying to eq. 3, we obtain the PTB value, in Nm³/h. The results of eq. 1 and eq. 3 are factors to find the value of the power and energy generated by the biogas engine, in eq. 2. The monthly electricity available for consumption, considering a stable and uninterrupted operation of biogas generation is found in eq. 4.
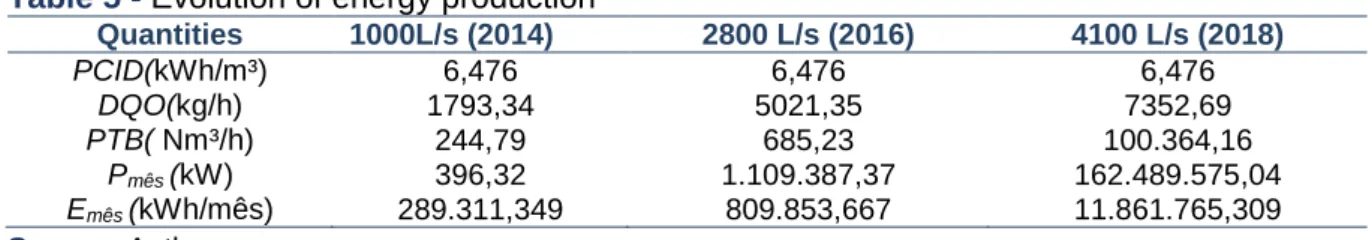
Table 5 shows the evolution of the STPs energy production at the medium term, with reference to the month of greatest demand and consumption of electricity on site.
Table 5 -Evolution of energy production
Quantities 1000L/s (2014) 2800 L/s (2016) 4100 L/s (2018) PCID(kWh/m³) 6,476 6,476 6,476 DQO(kg/h) 1793,34 5021,35 7352,69 PTB( Nm³/h) 244,79 685,23 100.364,16 Pmês (kW) 396,32 1.109.387,37 162.489.575,04 Emês (kWh/mês) 289.311,349 809.853,667 11.861.765,309 Source: Authors.
STS´s Serraria is free to operate with 4,130 L/s, 100% of its fullness, which will allow reaching 80% of sewage treatment in Porto Alegre/RS.
4.2 Financial and economic feasibility analysis
Taking the data of electric energy consumed at STP Serraria, we have that in the three hours peak, the cost of consumption is R$ 0.977 per kWh and at the off peak period it is R$ 0.216 per kWh, relative values of the tariffs in Dec/2014 for initial project. The global consumption of electricity was 376,698 kWh/month. The projected availability of electric energy produced by the biogas plant is 289,311kWh/month. This amount is capable of supplying approximately 76.80% of the electricity consumed at the STP.
Due to the cost of electricity from the grid being higher at peak hours, it can be inferred that the best economical use for biogas in the generation of electricity is the full supply during peak hours, and the rest meets consumption during off-hours. This means that 32.538 kWh can be used during peak hours and 256,773 kWh during off-peak hours.
Based on this analysis, it is possible to calculate the cost of electricity avoided using the proposed system. During the peak, the cost of R$ 31,789.62 is avoided and in the out-of-season period, R$ 55,462.97, totaling around R$ 87,252.59 per month.
Table 6 shows the evolution of energy tariffs in the country. Estimates of electricity tariffs in 2018 aim at a monthly cost of 39,566.20 kWh during peak hours and 103,593.96 kWh
Table 6 -Evolution of energy tariffs
Year Demand (R$/KW) Consumption (R$/KWh)
Pip Out Pip Out
2014 0,00 0,201 0,997 0,216
2016 0,279 0,389 1,216 0,279
2018 1,042 0,301 1,404 0,522
Source: Authors.
The proposed system has an estimated operating and maintenance costs (inputs and labor) of R$ 95,207.65 per year, in addition to a general review of the system every five years, at a cost of R$ 238,019.11. This amount corresponds to R$ 333,226.76 in five years or R$ 5,553.78 monthly. To perform the simple payback analysis, which disregards the discount or recovery of interest over time, the following calculation was performed, with data from the proposed system and the avoided energy cost, shown in Table 7.
Table 7 -Simple payback
Variables Values (2014)
CFt - cash flow R$ (87.252,59 –5.553,78)/mês
Initial investment R$ 4.437.989,28
Simple Payback 54,34 ~ 55 meses
Source: Authors.
However, it is also important to verify the return on investment against an alternative investment in the market. The origin of the financing of the initial investment value must be taken into account.
Considering the interest rate of 9% per year or 0.75% per month, over 55 months (4 years and 7 months) the initial investment value of the biogas system varies from R$ 4,437,989.28 in December from 2014 to R$ 6,693,669.47 for July 2018, that is, an increase of R$ 2.255.680,19 over 4 years and 7 months, as shown in Table 8.
Table 8 -Investment to implement the project
Scenario Year Investment (R$)
1 2014 4.437.989,28
2 2016 5.747.324,82
3 2018 6.693.669,47
Source: Authors.
The medium-term supply prospects, the evolution of the energy cost and the energy supply growth strategies take into account the impact of climate change on the flows of the sewage affluent and on biomass, which influence the variability in energy production
5 Considerations
The case study made it possible to evaluate the technical and economic feasibility for the implementation of electric power generation from biogas produced in the anaerobic
reactors at STP Serraria. The analysis of the sewage affluent collected for the STP Serraria has an average composition of 65% CH4, 60% of which is free for burning, generating electricity by conversing mechanical energy, by means of thermal machines. It was found that the most viable technology was the Otto cycle combustion engine. The necessary equipment structure and respective works were raised. The initial investment amount for the installation was R$ 4,437,989.28 and the amount in maintenance and operation expenses was R$ 333,226.76, for five years.
The affluent flow of STP Serraria has not yet stabilized at its full load capacity, that is, estimates of the start-up process of its reactors. It is expected to reach a flow of 4,115 L/s in four years of operation (in December 2018). The feasibility of the proposed system should increase, as the flow rate approaches the design maximum, as the maintenance and operation costs remain the same, and the return on the purchase of electricity from the grid increases. The electricity tariff assessed was December 2014, 2016 and 2018. It is projected that the energy cost of the grid may increase, due to the decrease in hydroelectric production (cheaper) and the need for thermoelectric generation (more expensive), to compensate. Due to this condition, the generation of electrical energy becomes more viable as it increases the energy of the grid. From the simple payback analysis, it can be concluded that the return on investment occurs, at most, in 4 years and 7 months (second half of 2018). Considering interest found in the market of 9% per year, the return on capital occurs at the same time.
However, large variations in biogas production are expected depending on the seasons and due to the discharge of high rainwater loads. These factors influence the production and conversion of biogas to less. The pouring of water from the rainwater network into sewage is irregular, but a reality considering the Porto Alegre city at Rio Grande do Sul State, which tries to reduce clandestine connections in the network through awareness campaigns.
The ratio of affluent sewage to effluent biogas is 1L to 6.8 x 10⁻⁵ Nm³ of biogas (maximum capacity). Therefore, with a maximum flow of 4100 L/s, it is possible to generate 11.861.765,30 kWh/month. The Serraria ETE was designed, considering the population growth of Porto Alegre/RS, for the full treatment of up to 4,100 liters of sewage per second, in 2018.
References
Aisse, M. M. (2000). “Sistemas econômicos de tratamento de esgotos sanitários”. Rio de Janeiro: ABRES, 192 p.
Bitton, G. (2005). Microbial indicators of fecal contamination: application to microbial source tracking. Report submitted to the Florida Stormwater Association, 719, 4-6.
Chernicharo, C. A. L. (2001). “Pós-Tratamento de Efluentes de Reatores Anaeróbios”, Projeto PROSAB, Belo Horizonte: MG, 544 p.
Coldebella, A. (2006). “Viabilidade do uso do biogás da bovinocultura e suinocultura para geração de energia elétrica e irrigação em propriedades rurais”. Dissertação (Pós-Graduação em Engenharia Agrícola). UNIOESTE, 75p., Cascavel: PR.
Costa et al. (2001). “Produção de Energia Elétrica a partir de Resíduos Sólidos Urbanos – Análise Custo Benefício”. URL:
http://www.ecoeco.org.br/conteudo/publicacoes/encontros/v_en/Mesa4/10.pdf.
DMAE (2009). “Departamento Municipal de Água e Esgotos”. Projeto Executivo da 1ª etapa da Estação de Tratamento de Esgoto Serraria. URL:
http://lproweb.procempa.com.br/pmpa/prefpoa/pisa/usu_doc/edital__ete_serraria_parte_b. pdf
DMAE (2014). “Departamento Municipal de Água e Esgoto”, Relatório de Consumo de Energia Elétrica. Porto Alegre: RS.
França Junior, A. T. (2008). “Análise do aproveitamento energético do biogás produzido numa estação de tratamento de esgoto”. Dissertação (Mestrado em Engenharia Mecânica). UNESP, 148p., Ilha Solteira: SP.
Glaister, B. J., et al. (2017). “Interactions between design, plant growth and the treatment performance of stormwater biofilters”. Ecological Engineering, v. 105, p. 21-31.
Iannicelli, A. L. (2008). “Reaproveitamento energético do biogás de uma indústria cervejeira”. Dissertação (Mestrado em Engenharia Mecânica). UNITAU, 83p., Taubaté: SP.
Moreira, L. (2014). “Cooperação: O caminho para o acesso universal ao saneamento”. In 5º Encontro Nacional das Águas. Apresentação oral, Sindicato Nacional das
Concessionárias Privadas de Serviços Públicos de Água e Esgoto (SINDCON).
Oliveira, P. A. V.; Higarashi, M. M. (2006). “Geração e utilização de biogás em unidades de Produção de suínos”. Embrapa suínos e aves, Concórdia/SC, 42 p.
Pereira, R. S. (2004). “Poluição Hídrica: causas e consequências”. ReRH: Revista Eletrônica
de Recursos Hídricos, v. 1, n. 1, pp.20-36.
Perovano, T. G.; Formigoni, L. P. A. (2011). “Geração de Energia a Partir de Subprodutos do Tratamento de Esgotos Sanitários”. Monografia (Graduação em Engenharia Ambiental). UFES, 101 p., Vitória: ES.
Salama, E., et al. (2017). Recent progress in microalgal biomass production coupled with wastewater treatment for biofuel generation. Renewable and Sustainable Energy Reviews, v. 79, p. 1189-1211.
SEMAE. Serviço Municipal Autônomo de Água e Esgoto (2011). “Estudo Técnico de
Viabilidade – Cogeração de Energia a partir de Biogás e do Lodo Proveniente de Reatores Anaeróbios da ETE Rio Preto”. São José do Rio Preto: SP, 42 p.
Souza, S. N. M.; Pereira, W. C.; Pavan, A. A. (2004). “Custo da eletricidade gerada em conjunto motor gerador utilizando biogás da suinocultura”, Acta Scientiarum Technology, v. 26, n. 2, pp.127-133.
Trevisan, L. Y. I., & Orssatto, F. (2017). “Tratamento de Águas Residuárias e Mecanismos de Gestão Hídrica de uma Universidade em Foz do Iguaçu/PR”. Revista de Gestão Ambiental e Sustentabilidade-GeAS, 6(3), 118-130.
Waiss, T. C. F.; Posseti, G. R. C (2015). Influência de eventos de chuva na produção de biogás de reatores anaeróbios alimentados com esgoto doméstico. In: 28º Congresso
Brasileiro de Engenharia Sanitária e Ambiental, Anais 2015.
Zilotti, H. A. R. (2012). “Potencial de produção de biogás em uma estação de tratamento de esgoto de Cascavel para a geração de energia elétrica”. Dissertação (Mestrado em Energia na Agricultura). UNIOESTE, 52 p., Cascavel: PR.