Original article
Imaging in diagnosis, outcome
prediction and monitoring of large
vessel vasculitis: a systematic literature
review and meta-analysis informing the
EULAR recommendations
Christina Duftner,1 Christian Dejaco,2,3 Alexandre Sepriano,4,5 Louise Falzon,6
Wolfgang Andreas Schmidt,7 Sofia Ramiro4
To cite: Duftner c, Dejaco c, Sepriano a, et al. imaging in diagnosis, outcome prediction and monitoring of large vessel vasculitis: a systematic literature review and meta-analysis informing the eUlar recommendations. RMD Open 2018;4:e000612. doi:10.1136/ rmdopen-2017-000612 ►Prepublication history and additional material for this paper are available online. to view these files, please visit the journal online (http:// dx. doi. org/ 10. 1136/ rmdopen- 2017- 000612).
christinD and christiaD are first co-authors.
received 4 november 2017 accepted 19 December 2017
For numbered affiliations see end of article.
Correspondence to
Dr christina Duftner; christina. duftner@ gmx. at
AbstrAct
Objectives to perform a systematic literature review on
imaging techniques for diagnosis, outcome prediction and disease monitoring in large vessel vasculitis (lVV) informing the european league against rheumatism recommendations for imaging in lVV.
Methods Systematic literature review (until 10 March
2017) of diagnostic and prognostic studies enrolling >20 patients and investigating ultrasound, Mri, ct or positron emission tomography (Pet) in patients with suspected and/or established primary lVV. Meta-analyses were conducted, whenever possible, obtaining pooled estimates for sensitivity and specificity by fitting random effects models.
Results Forty-three studies were included (39 on
giant cell arteritis (gca), 4 on takayasu arteritis (taK)). Ultrasound (‘halo’ sign) at temporal arteries (8 studies, 605 patients) and Mri of cranial arteries (6 studies, 509 patients) yielded pooled sensitivities of 77% (95% ci 62% to 87%) and 73% (95% ci 57% to 85%), respectively, compared with a clinical diagnosis of gca. corresponding specificities were 96% (95% ci 85% to 99%) and 88% (95% ci 81% to 92%). two studies (93 patients) investigating Pet for gca diagnosis reported sensitivities of 67%–77% and specificities of 66%–100% as compared with clinical diagnosis or temporal artery biopsy. in taK, one study each evaluated the role of magnetic resonance angiography and ct angiography for diagnostic purposes revealing both a sensitivity and specificity of 100%. Studies on outcome prediction and monitoring disease activity/damage were limited and mainly descriptive.
Conclusions Ultrasound and Mri provide a high
diagnostic value for cranial gca. More data on the role of imaging for diagnosis of extracranial large vessel gca and taK, as well as for outcome prediction and monitoring in lVV are warranted.
InTROduCTIOn
Large vessel vasculitis (LVV) is the most common form of primary vasculitis comprising (cranial and large vessel (LV)) giant cell arteritis (GCA), Takayasu arteritis
(TAK) and idiopathic aortitis. Prompt diag-nosis and treatment of LVV are important to prevent serious ischaemic complica-tions such as visual loss in GCA, vascular
Key messages
What is already known about this subject? ► imaging modalities including ultrasound (US), Mri,
ct and 18F-FDg positron emission tomography are frequently used for diagnosing large vessel vasculitis (lVV) in clinical practice. However, their diagnostic value is still questioned by several clinicians, especially by those with less experience in imaging.
What does this study add?
► US and Mri of the superficial temporal artery reveal a good performance for the diagnosis of cranial giant cell arteritis (gca) with pooled sensitivities of 77% and 73%, respectively, as well as pooled specificities of 96% and 88%, respectively.
► Studies on the diagnostic accuracy of imaging in extracranial large vessel gca and takayasu arteritis are scarce.
► Studies on the role of imaging techniques for outcome prediction and monitoring of disease activity and damage of lVV are limited and mainly non-informative because of heterogeneous study design and of being mostly descriptive, not enabling reaching an inferential conclusion.
How might this impact on clinical practice? ► the results of this systematic literature review
help clinicians to place the use of imaging in the diagnosis of lVV in their daily clinical practice.
► US and Mri of the temporal arteries can be accurately used in the diagnostic work-up of patients with a suspicion of cranial gca, possibly avoiding the need for more invasive diagnostic techniques, such as a temporal biopsy.
stenosis/occlusion in TAK and aneurysm formation in idiopathic aortitis.1 2 Temporal artery biopsy (TAB)
has been the standard test to confirm the diagnosis of GCA3–5; although highly specific, biopsy is invasive and
lacks sensitivity, with false-negative results in up to 61% of patients compared with a clinical diagnosis of GCA.6 In
addition, extracranial arteries are usually not accessible for histological assessment, and in extracranial LV-GCA, temporal arteries are spared in up to 40% of patients.7 8
Consequently, GCA diagnosis often relies on the combi-nation of clinical symptoms, elevated serum inflamma-tory markers and imaging findings.
The classification criteria for TAK focus on the detection of arterial stenosis and occlusions as detected by conven-tional angiography.9 Conventional angiography, however,
does not allow the delineation of vessel wall changes and bears the potential risk of complications, such as allergic reactions, haematoma, iatrogenic embolisation and arte-rial dissection. Therefore, angiography is being increas-ingly replaced by newer imaging modalities.2
Aortitis is common in GCA and TAK but rarely occurs as an isolated (idiopathic) disease.10 The diagnosis of
idiopathic aortitis is frequently based on radiological findings with inflammatory wall changes of the aorta because histological assessment is only possible if aortic aneurysms are operated.11
The role of imaging modalities including ultrasound (US), MRI, CT and 18F-FDG positron emission
tomog-raphy (PET) in LVV has been addressed in several studies over the last years. Imaging modalities, however, are not yet uniformly used for the diagnosis and monitoring of LVV in clinical practice. A European League Against Rheumatism (EULAR) project has therefore been undertaken to develop recommendations for the use of imaging in LVV in clinical practice.12
The aim of this systematic literature review (SLR) was to summarise the available evidence on the performance of imaging techniques on diagnosis, outcome prediction and monitoring of disease activity and damage in LVV, as well as technical aspects of imaging modalities in order to inform the EULAR task force developing these new recommendations.12
MeTHOds Literature search
In the first meeting of the EULAR task force, four key questions were framed according to the Population, Intervention, Comparator, Outcome (PICO) format.13
These referred to the role of US, MRI, magnetic reso-nance angiography (MRA), PET±CT, CT or CT angiog-raphy (CTA) in diagnosis, outcome prediction and moni-toring of LVV, as well as technical aspects for the different imaging techniques (online supplementary table S1a–d). The population of interest consisted of adult patients (≥18 years) with a suspected (for diagnostic studies and studies on technical aspects) and/or established primary LVV (ie, GCA, TAK and idiopathic aortitis; for
studies on monitoring, prognosis and technical aspects). For diagnostic accuracy of imaging, physician’s clinical diagnosis (both at first assessment and also at first and follow-up assessments) and TAB were accepted as refer-ence standards, and sensitivity and specificity of imaging were the outcomes of interest. For prognostic and moni-toring studies, presence and absence of baseline imaging abnormalities (or also over the follow-up for monitoring studies) were considered as ‘interventions’ and ‘compar-ator’, respectively; outcomes of interest were those reflecting disease activity or damage. The task force did not specify these outcomes, because it was argued that the literature review would reveal relevant outcome parameters addressed in prospective studies.
Eligible studies were all full research articles of cohort studies with prospective design (excluding research letters, case–control and retrospective studies) involving >20 patients; both cross-sectional and longitu-dinal studies were included.
study selection, data extraction and assessment of risk of bias (RoB)
The SLR was conducted by two reviewers (ChristinD and ChristiaD) under the guidance of the methodologist (SR) and with the help of the statistician (AS), who performed the meta-analyses. The search strategy was developed by an experienced librarian (LF) (online supplemen-tary text S1). MEDLINE (1946), Embase (1974) and the Cochrane Library (1993) databases were searched without language restrictions from their inception dates (noted in parentheses) until 10 March 2017.
The reviewers screened independently all titles and abstracts to identify potentially eligible studies that were then reviewed in full text. Papers fulfilling the inclusion criteria were proceeded to data extraction. Both reviewers independently retrieved data using a predefined data extraction sheet. The following data were extracted for diagnostic studies: studies’ main characteristics (year of publication, setting, number of included patients, inclu-sion criteria, use of glucocorticoids (GC) before perfor-mance of imaging), patient characteristics (number (%) of females, patients’ age), disease characteristics (number (%) of patients fulfilling clinical criteria for GCA or TAK, number (%) of patients with positive TAB, number (%) of patients with the LV-GCA subset), tech-nical aspects (imaging devices used, elementary lesions and structures investigated, blinding of the index test to reference standard), index test (lesions identified in the index test that are analysed), reference standard, diag-nostic performance (raw data to calculate sensitivity, specificity, positive likelihood ratio (LR+) and negative likelihood ratio (LR−)) and parameters required for the assessment of the RoB. For prognostic and monitoring studies, the following items were retrieved: study’s aim, inclusion criteria, number of patients included, number (%) of patients with follow-up, period of follow-up, inves-tigated structures, signs and time of change, prognostic factors and outcome—as explained above any outcome
reflecting disease activity or damage. For technical aspects, we extracted the study aim, number of included patients, inclusion criteria, number of patients finally diagnosed with GCA or TAK, investigated structures, different technical aspects being compared (interven-tion and comparator) and outcome (diagnostic perfor-mance or disease activity/damage, as appropriate) were detailed.
RoB of the studies was appraised independently by the same two reviewers who conducted the SLR. For studies on diagnostic accuracy, the Quality Assessment of Diag-nostic Accuracy Studies-2 (QUADAS-2) tool was used comprising four domains: patient selection, index test, reference standard, as well as flow and timing. Each of these domains was evaluated as having a ‘low’, ‘high’ or ‘unclear’ RoB, whereas concerns about applicability were evaluated in the first three domains also as ‘low’, ‘high’ or ‘unclear’. The Quality In Prognosis Studies (QUIPS) tool was applied for the assessment of prognostic studies evaluating the following aspects: study participation and attrition, prognostic factor measurement, outcome measurement, study confounding as well as statistical analysis/reporting.14 15 Each QUIPS domain was rated
as ‘high’, ‘moderate’, ‘low’ or ‘unclear’ RoB. For studies on monitoring and technical aspects, no RoB assessment was performed, because identified studies were mainly only descriptive (see below), hence no adequate RoB assessment could be performed. Discrepancies between reviewers regarding study selection, data extraction and RoB assessment were solved by discussion. A third reviewer (WAS) was involved in case no consensus could be achieved (n=2 studies).
data analysis
Meta-analysis for diagnostic accuracy was performed whenever possible, that is, in case enough data stem-ming from homogeneous studies concerning imaging modality, reference standard (either clinical diagnosis or TAB as reference standards) and outcome assessment was available. For all other diagnostic accuracy studies as well as for prognostic and monitoring studies, individual results (of studies not included in the meta-analysis) are reported.
Pooled sensitivity and specificity were estimated by random-effects bivariate generalised binomial mixed models. This is the recommended analytical method for meta-analysis of diagnostic tests, since it estimates sensi-tivity and specificity together taking into account their correlation.16 Parameter estimates from each model were
used to derive the LR+ and LR− and 95% CIs. In case of limited data (here: ≤3 studies), the above-mentioned rule was relaxed, and univariate random-effects models were used by assuming no correlation between sensitivity and specificity.16
Sensitivity analyses were performed for diagnostic accu-racy studies on US and MRI in GCA evaluating the effect of: (1) the quality of studies (excluding those with high RoB), (2) GC treatment before the index test (including
only those without GC treatment before imaging), (3) the use of imaging devices with high resolution (including only studies that used >12 MHz probes for US or 3T MRI machines), (4) target population (including only studies with a detailed description of what was meant by the ‘suspicion’ of GCA) and (5) reference standard (including only studies with clinical diagnosis confirmed after follow-up used as reference standard).
All analyses were conducted in Stata V.14. The Cochrane Collaboration’s Review Manager Software V.5.3 was used to build forest plots.
ResuLTs
Out of 8691 articles screened, 43 studies were finally included with some of these addressing more than one index test or key objectives (see flow chart in online supplementary figure S1). For GCA, 27 arti-cles focused on the diagnostic accuracy,6 17–425 studies
on outcome prediction,43–47 13 on monitoring disease
activity17 20 22 25 28 29 43–45 48–51 and five on technical
aspects.35 37 52–54 For TAK, four studies were included
with two studies addressing diagnostic accuracy55 56 and
two studies evaluating the value of imaging for moni-toring.57 58 No study on isolated aortitis was identified.
diagnostic accuracy studies
For GCA, most diagnostic accuracy studies focused on the role of US (n=17)6 17–32 or MRI (n=8).33–40 One study
addressed the role of PET,41 and another study examined
the role of PET and CTA for GCA diagnosis.42 In TAK,
one study evaluated the role of MRA and another the role of CTA.55 56
Ultrasound
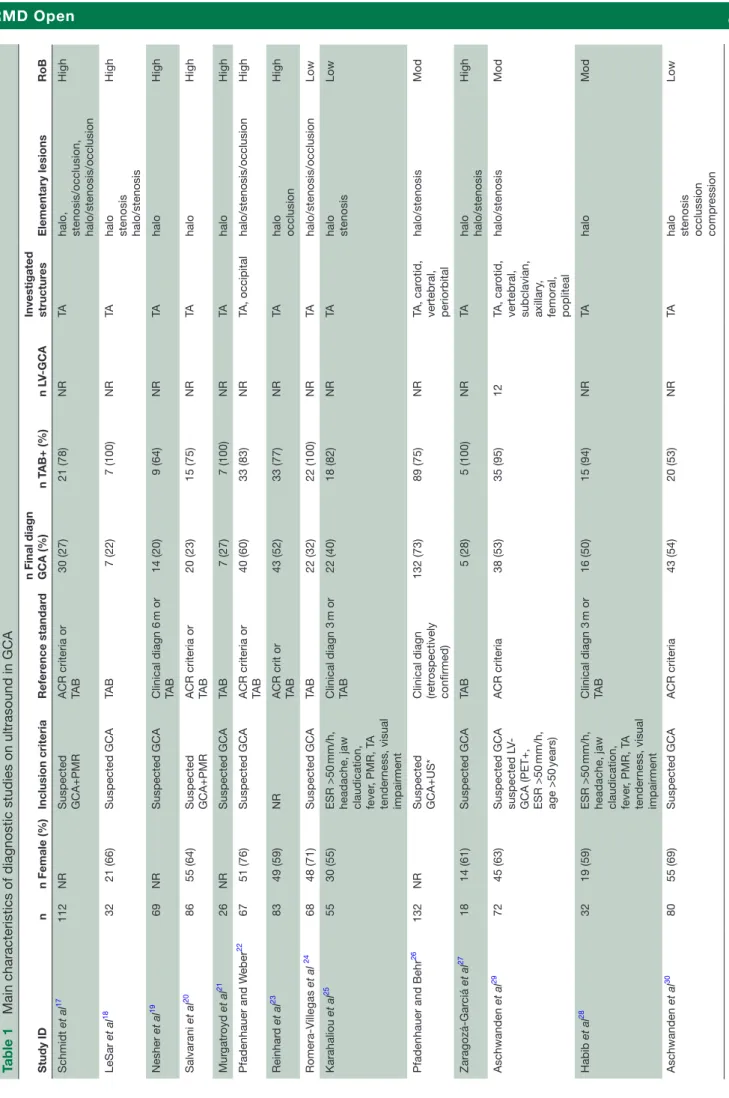
The main study—and patient—characteristics are summarised in table 1 with additional data and details on the RoB assessment described in online supplemen-tary tables S2 and S6, respectively. Most US studies in GCA tested the ‘halo’ sign (n=166 17–31) as a key
elemen-tary lesion defining vasculitis. Other US signs addressed (mostly in combination with the ‘halo’ sign) were stenosis (n=136 17 18 20 22–30), occlusion (n=96 17 22–26 28 30) and the
‘compression’ sign (n=230 32).
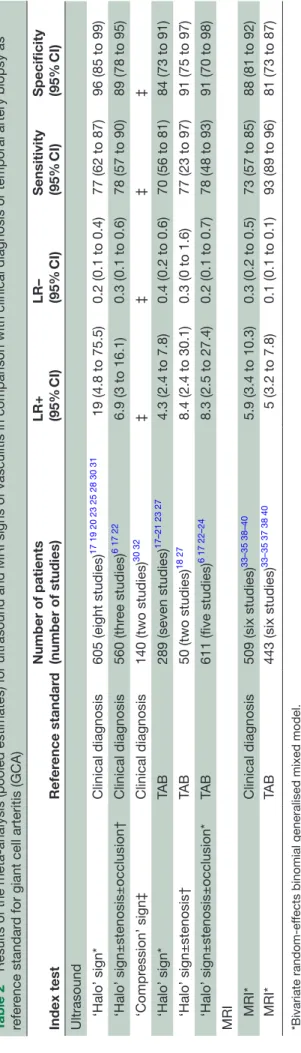
Results of the meta-analysis on the diagnostic perfor-mance of the different US signs are summarised in
table 2, and results of individual studies are shown in
figure 1A,B.
Eight studies (n=605, three studies with low RoB)17 19 20 23 25 28 30 31 investigated the value of the ‘halo’
sign in comparison with the clinical diagnosis of cranial GCA yielding a pooled sensitivity of 77% (95% CI 62% to 87%) and a specificity of 96% (95% CI 85% to 99%). A similarly good diagnostic performance was obtained when the ‘halo’ sign was compared with TAB as refer-ence standard (seven studies, n=289, no study with low RoB).17–21 23 27 Also, the evaluation of the combination of
US signs defining vasculitis (‘halo’, stenosis or occlusion) in comparison with clinical diagnosis (three studies,
Table 1
Main characteristics of diagnostic studies on ultrasound in GCA
Study ID n n Female (%) Inclusion criteria Refer ence standar d
n Final diagn GCA (%)
n T AB+ (%) n L V-GCA Investigated structur es Elementary lesions RoB Schmidt et al 17 112 NR Suspected GCA+PMR ACR criteria or TAB 30 (27) 21 (78) NR TA
halo, stenosis/occlusion, halo/stenosis/occlusion
High LeSar et al 18 32 21 (66) Suspected GCA TA B 7 (22) 7 (100) NR TA
halo stenosis halo/stenosis
High Nesher et al 19 69 NR Suspected GCA Clinical diagn 6 m or TA B 14 (20) 9 (64) NR TA halo High Salvarani et al 20 86 55 (64) Suspected GCA+PMR ACR criteria or TAB 20 (23) 15 (75) NR TA halo High Mur gatr oyd et al 21 26 NR Suspected GCA TA B 7 (27) 7 (100) NR TA halo High Pfadenhauer and W eber 22 67 51 (76) Suspected GCA ACR criteria or TAB 40 (60) 33 (83) NR TA, occipital halo/stenosis/occlusion High Reinhar d et al 23 83 49 (59) NR ACR crit or TAB 43 (52) 33 (77) NR TA halo occlusion High Romera-Villegas et al 24 68 48 (71) Suspected GCA TA B 22 (32) 22 (100) NR TA halo/stenosis/occlusion Low Karahaliou et al 25 55 30 (55) ESR >50 mm/h,
headache, jaw claudication, fever
, PMR, T A tender ness, visual impairment Clinical diagn 3 m or TA B 22 (40) 18 (82) NR TA halo stenosis Low
Pfadenhauer and Behr
26
132
NR
Suspected GCA+US* Clinical diagn (retr
ospectively confirmed) 132 (73) 89 (75) NR TA, car otid, vertebral, periorbital halo/stenosis Mod Zaragozá-Gar ciá et al 27 18 14 (61) Suspected GCA TA B 5 (28) 5 (100) NR TA halo halo/stenosis High Aschwanden et al 29 72 45 (63)
Suspected GCA suspected L
V-GCA (PET+, ESR >50
mm/h, age >50 years) ACR criteria 38 (53) 35 (95) 12 TA, car otid,
vertebral, subclavian, axillary
, femoral, popliteal halo/stenosis Mod Habib et al 28 32 19 (59) ESR >50 mm/h,
headache, jaw claudication, fever
, PMR, T A tender ness, visual impairment Clinical diagn 3 m or TA B 16 (50) 15 (94) NR TA halo Mod Aschwanden et al 30 80 55 (69) Suspected GCA ACR criteria 43 (54) 20 (53) NR TA
halo stenosis occlussion compr
ession
Low
n=560, no study with low RoB)6 17 22 or TAB (five studies,
n=611, one study with low RoB)6 17 22–24 resulted in a
similar diagnostic performance as the ‘halo’ sign alone. Sensitivity analyses for the diagnostic performance of the ‘halo’ sign (compared with clinical diagnosis of cranial GCA) as detailed above, revealed higher pooled sensitiv-ities (86%–89%) than the main analysis and comparable or slightly lower specificities. The only exception was the analysis including only studies without GC treatment before the index test, which had a slightly lower sensi-tivity of 73% (table 3).
Two studies (n=140, both with low RoB),30 32 conducted
by the same research group, investigated the ‘compres-sion’ sign. The authors reported sensitivities of 77%–79% and a specificity of 100% of this sign compared with the clinical diagnosis of cranial GCA.
In three US studies6 29 31 (n=541, one study with low
RoB), extracranial arteries were examined. Only one of these addressed the effect of the examination of temporal plus axillary arteries on the diagnostic performance as compared with the assessment of temporal arteries alone. This study revealed an incremental change of sensitivity of 2% by the former compared with the latter approach.31 Although 22 arteries were evaluated in the
study by Aschwanden et al29 a low sensitivity of 55% was
observed for US (‘halo’ and stenosis) to detect vasculitis. No separate results for the diagnostic performance of US in patients with cranial and extracranial LV involvement were provided in that study.29
No study on US in TAK was identified.
Magnetic resonance imaging
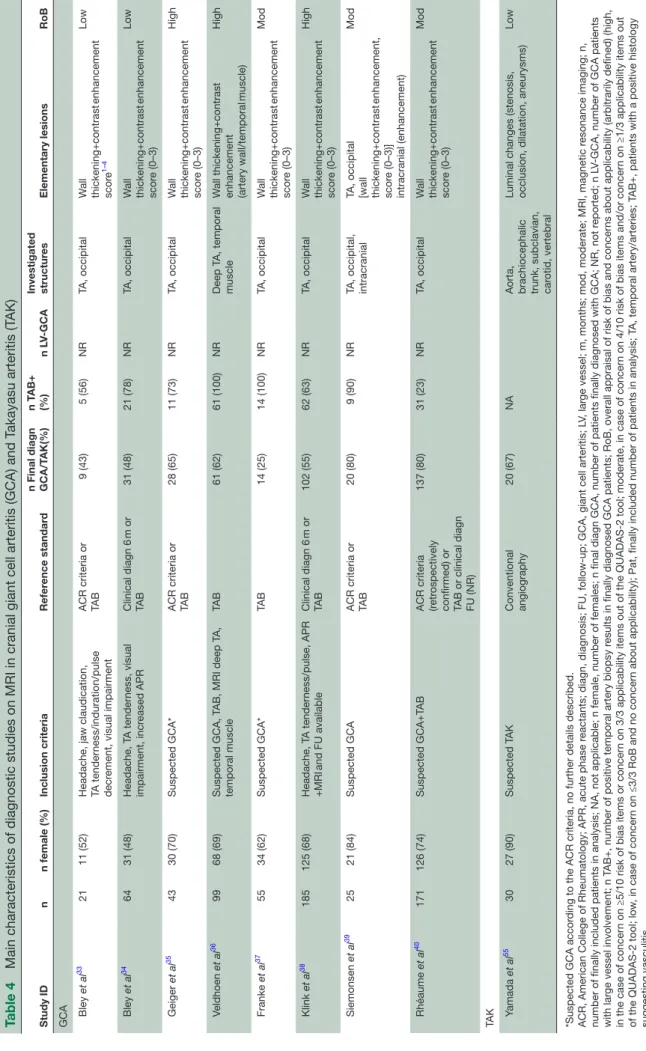
All MRI studies addressed vessel wall thickening and contrast enhancement as signs of vasculitis in the superfi-cial temporal and occipital arteries. Study characteristics are detailed in table 4, individual sensitivity and speci-ficity data are reported in online supplementary table S3 and figure 1A,B and details of the RoB assessment are shown in online supplementary table S6.
Six MRI studies were included in the meta-analysis using clinical diagnosis33–35 38–40 (n=509, one with low
RoB) and/or TAB33–35 37 38 40 (n=443, one with low RoB)
as the reference standard (table 2). A pooled sensitivity of 73% (95% CI 57 to 85) and specificity of 88% (95% CI 81 to 92) was found comparing MRI with the clin-ical diagnosis of cranial GCA. When TAB was used as the reference standard, MRI yielded a sensitivity of 93% (95% CI 89 to 96) and a specificity of 81% (95% CI 73 to 87). Sensitivity analyses, as detailed in table 3, under-lined the robustness of the main analysis. Of note, in all included MRI studies, patients were on treatment with GCs when the MRI was conducted. One study examined the role of the deep temporal arteries and the involve-ment of the temporal muscle for the diagnosis of GCA revealing a sensitivity of 42% and a specificity of 90% (online supplementary table S3).36 This study was not
included in the meta-analysis because the structures investigated were different from those of other studies.
Study ID n n Female (%) Inclusion criteria Refer ence standar d
n Final diagn GCA (%)
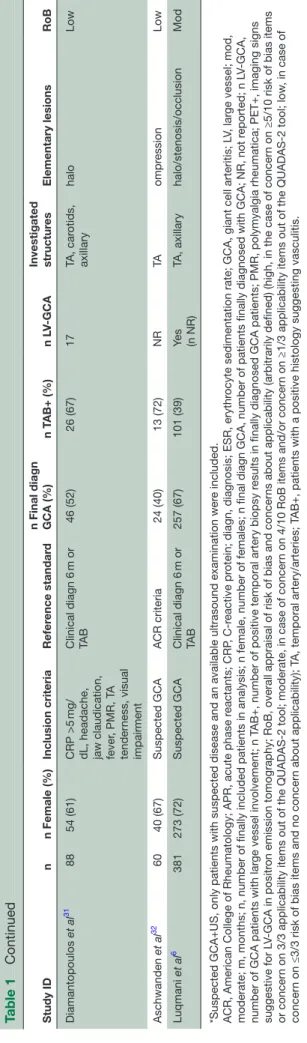
n T AB+ (%) n L V-GCA Investigated structur es Elementary lesions RoB Diamantopoulos et al 31 88 54 (61) CRP >5 mg/
dL, headache, jaw claudication, fever
, PMR, T A tender ness, visual impairment Clinical diagn 6 m or TA B 46 (52) 26 (67) 17 TA, car otids, axillary halo Low Aschwanden et al 32 60 40 (67) Suspected GCA ACR criteria 24 (40) 13 (72) NR TA ompr ession Low Luqmani et al 6 381 273 (72) Suspected GCA Clinical diagn 6 m or TA B 257 (67) 101 (39) Ye s (n NR) TA, axillary halo/stenosis/occlusion Mod
*Suspected GCA+US, only patients with suspected disease and an available ultrasound examination wer
e included.
ACR, American College of Rheumatology; APR, acute phase r
eactants; CRP
, C-r
eactive pr
otein; diagn, diagnosis; ESR, erythr
ocyte sedimentation rate; GCA, giant cell arteritis; L
V, lar
ge vessel; mod,
moderate; m, months; n, number of finally included patients in analysis; n female, number of females; n final diagn GCA, number o
f patients finally diagnosed with GCA; NR, not r
eported; n L
V-GCA,
number of GCA patients with lar
ge vessel involvement; n T
AB+, number of positive temporal artery biopsy r
esults in finally diagnosed GCA patients; PMR, polymyalgia rheumatica; PET+, imaging signs
suggestive for L
V-GCA in positr
on emission tomography; RoB, overall appraisal of risk of bias and concer
ns about applicability (arbitrarily defined) (high, in the case of concer
n on ≥5/10 risk of bias items
or concer
n on 3/3 applicability items out of the QUADAS-2 tool; moderate, in case of concer
n on 4/10 RoB items and/or concer
n on ≥1/3 applicability items out of the QUADAS-2 tool; low
, in case of
concer
n on ≤3/3 risk of bias items and no concer
n about applicability); T
A, temporal artery/arteries; T
AB+, patients with a positive histology suggesting vasculitis.
Table 1
Table 2
Results of the meta-analysis (pooled estimates) for ultrasound and MRI signs of vasculitis in comparison with clinical diagno
sis or temporal artery biopsy as
refer
ence standar
d for giant cell arteritis (GCA)
Index test
Refer
ence standar
d
Number of patients (number of studies) LR+ (95% CI) LR– (95% CI) Sensitivity (95% CI) Specificity (95% CI) Ultrasound ‘Halo’ sign* Clinical diagnosis 605 (eight studies) 17 19 20 23 25 28 30 31 19 (4.8 to 75.5) 0.2 (0.1 to 0.4) 77 (62 to 87) 96 (85 to 99) ‘Halo’ sign±stenosis±occlusion† Clinical diagnosis 560 (thr ee studies) 6 17 22 6.9 (3 to 16.1) 0.3 (0.1 to 0.6) 78 (57 to 90) 89 (78 to 95) ‘Compr ession’ sign‡ Clinical diagnosis 140 (two studies) 30 32 ‡ ‡ ‡ ‡ ‘Halo’ sign* TA B 289 (seven studies) 17–21 23 27 4.3 (2.4 to 7.8) 0.4 (0.2 to 0.6) 70 (56 to 81) 84 (73 to 91) ‘Halo’ sign±stenosis† TA B 50 (two studies) 18 27 8.4 (2.4 to 30.1) 0.3 (0 to 1.6) 77 (23 to 97) 91 (75 to 97) ‘Halo’ sign±stenosis±occlusion* TA B 611 (five studies) 6 17 22–24 8.3 (2.5 to 27.4) 0.2 (0.1 to 0.7) 78 (48 to 93) 91 (70 to 98) MRI MRI* Clinical diagnosis 509 (six studies) 33–35 38–40 5.9 (3.4 to 10.3) 0.3 (0.2 to 0.5) 73 (57 to 85) 88 (81 to 92) MRI* TA B 443 (six studies) 33–35 37 38 40 5 (3.2 to 7.8) 0.1 (0.1 to 0.1) 93 (89 to 96) 81 (73 to 87) *Bivariate random-ef
fects binomial generalised mixed model.
†Univariate random-ef
fects models.
‡Model fails to conver
ge with both analytical methods.
‘halo’ sign ±stenosis, combination of ‘halo’ sign±stenosis as ultrasound signs suggestive for vasculitis; ‘halo’ sign±stenosis±occlusion, combination of halo±stenosis±occlusion as ultrasound signs suggestive for vasculitis; MRI, magnetic r
esonance imaging; wall thickening+contrast
enhancement as MRI signs suggestive for vasculitis.
ACR, American College of Rheumatology; CI, confidence interval; clinical diagnosis, final diagnosis made accor
ding to the ACR criteria or physician diagnosis; LR, likelihood ratio; T
AB,
temporal artery biopsy
No study was identified addressing the role of MRI for the evaluation of extracranial LV-GCA.
One study55 (n=30, low RoB) investigated MRA for the
diagnosis of TAK using conventional angiography as the reference standard (see table 4 and online supplemen-tary tables S3 and S6 for further details). A sensitivity of 100% (95% CI 76 to 100) and a specificity of 100% (95% CI 63 to 100) for MRA was reported.
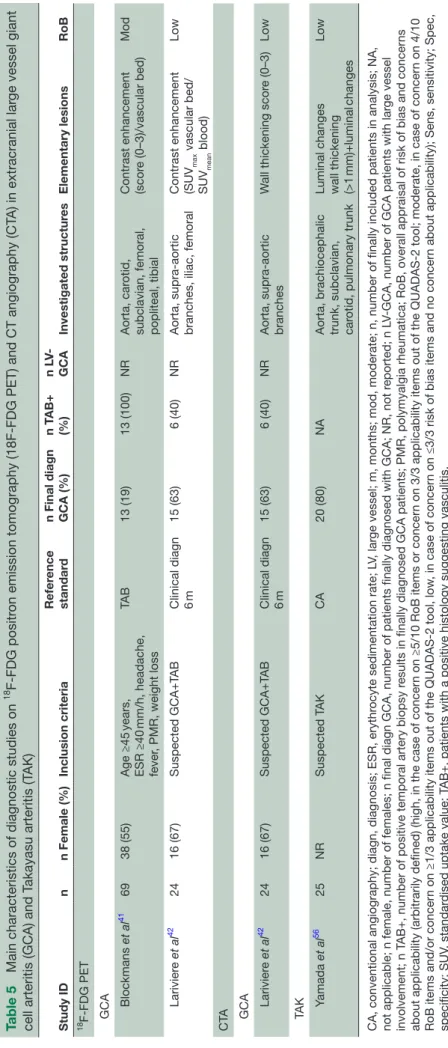
18F-FDg positron emission tomography
Only two studies41 42 (n=93, one study with low RoB42)
focused on the diagnostic performance of 18F-FDG-PET for the diagnosis of extracranial LV-GCA yielding sensi-tivities of 67%–77% and specificities of 66%–100%, using TAB or a clinical diagnosis after 6 months as reference standards, respectively. The study by Lariviere et al42
(n=24, low RoB), reporting a specificity of 100%, applied
a semiquantitative approach (aortic-to-blood pool uptake ratio) for the evaluation of 18F-FDG vessel wall uptake
(table 5 and online supplementary table S4 for further study details, online supplementary table S6 for RoB assessment).
ct angiography
The study by Lariviere et al mentioned above42 (n=25,
with low RoB) evaluated the roles of PET and CTA within the same population. CTA revealed a sensitivity of 73% (95% CI 45 to 92) and a specificity of 78% (95% CI 40 to 97) using the clinical diagnosis of GCA after 6 months as reference standard.
For the diagnosis of TAK, one study56 (n=25, with low
RoB) examined the role of CTA reporting a sensitivity of 100% (95% CI 76 to 100) and a specificity of 100% (95% CI 40 to 100) compared with conventional angi-ography (table 5 and online supplementary tables S5 for further study details, online supplementary table S6 for RoB assessment).
Outcome prediction, monitoring disease activity and damage and technical aspects of imaging techniques
Description of observations without inferences in moni-toring studies (n=11) and studies on technical aspects (n=5) as well as heterogeneity in study design, outcomes and technical settings of prognostic studies (n=5) precluded any meta-analysis. Main study characteristics and findings are summarised in online supplementary tables S7–S10.
Five studies investigated the role of US,43 44
18F-FDG-PET45 46 or CT47 for outcome prediction in GCA
(online supplementary table S7) with none of them being appraised at low RoB (online supplementary table S8). GCA characteristic US lesions at baseline did not predict a relapse,44 and the risk of ischaemic
complica-tions was similar in patients with temporal and extracra-nial LV involvement.43 The response of 18F-FDG-uptake
to GC therapy (at 3 and 6 months) was not associated with the risk of relapse45; however, baseline 18
F-FDG-up-take at the aorta predicted aortic dilatation during long-term disease course according to one study.46 For TAK,
no study was identified addressing the role of imaging for outcome prediction.
For GCA, 13 studies were found investigating the role of imaging for monitoring disease activity and damage.17 20 22 25 28 29 43–45 48–51 Ten US studies (197
patients, follow-up range: 1–41 months) reported that the ‘halo’ sign at temporal arteries was no longer detected in the majority of patients after 2–4 weeks of GC therapy,17 20 22 25 28 29 43 44 48 49 whereas at larger arteries,
vessel wall swelling persisted in two thirds of patients according to CT and US studies.43 51 Additionally, the
occurrence of new vasculitic US lesions was reported in up to 10% of GCA patients despite GC treatment.4318
F-FDG uptake in the wall of extracranial LVs was compa-rable in GCA patients in full remission and those with a relapse.45 In TAK, US and MRI were also not helpful
Figure 1 (A) Diagnostic performance of different ultrasound (US) signs of vasculitis and MRI studies in comparison with clinical diagnosis as reference standard. (B) Diagnostic performance of different US signs of vasculitis and MRI studies in comparison with temporal artery biopsy as reference standard. TP, true positives; FP, false positives; FN, false negatives; TN, true negatives.
to discriminate between active disease and remission57 58
(see online supplementary table S9 for details on moni-toring studies).
All five studies (two on MRI, three on
18F-FDG-PET)35 37 52–54 on technical requirements,
settings and operational procedures were performed in GCA patients and are summarised in online supplemen-tary table S10.
dIsCussIOn
This SLR confirms the good performance of US and MRI for the diagnosis of cranial GCA. The ‘halo’ sign (US) and increased vessel wall thickness in combination with contrast enhancement (MRI) of superficial temporal arteries, respectively, were the most relevant imaging findings suggesting GCA. Data on imaging for diagnosis of extracranial LV disease remain limited.
The diagnostic performance of US was better in the current than in previous meta-analyses with a higher sensitivity (77% vs 55%–69%)59–61 but similar specificity
(96% vs 89%–94%)59–61 for diagnosis of cranial GCA,
which possibly relies on the fact that we included more recent, high-quality studies. A recent SLR conducted
by Buttgereit et al identified many of the same studies described in this work; however, that SLR focused on imaging modalities in GCA and PMR (omitting papers on TAK), spared CT and only reported diagnostic values of individual studies rather than providing meta-analysed estimates on sensitivity and specificity.62 This is a clear
addition of our SLR, together with also covering outcome prediction as well as monitoring disease activity/damage, not addressed in previous SLRs. The sensitivity analyses of the meta-analysis suggest that technical aspects and the definition of study entry criteria have all an impact on the sensitivity of US. Expertise with vascular US (as in any other diagnostic test) is another factor that may influence its diagnostic properties. We could not assess this factor, since all studies were conducted by expert groups. GC treatment before an imaging test has been demonstrated to reduce the sensitivity of the respec-tive imaging modality.6 63 Our results do not seem to
confirm this observation since the ‘halo’ was less sensi-tive for diagnosis of cranial GCA when pooling studies in which patients had not been treated with GCs before US was performed as compared with the main analysis. This finding, however, was largely influenced by a single
Table 3 Sensitivity analyses for diagnostic studies on ultrasound (‘halo’ sign) and MRI in comparison with clinical diagnosis for cranial giant cell arteritis (GCA) as reference standard
Number of patients
(number of studies) LR+(95% CI) LR–(95% CI) Sensitivity(95% CI) Specificity(95% CI)
Ultrasound
Halo versus clinical diagnosis (main analysis)*
605 (eight
studies)17 19 20 23 25 28 30 31 19 (4.8 to 75.5) 0.2 (0.1 to 0.4) 77 (62 to 87) 96 (85 to 99)
Excluding high RoB studies*†
255 (four studies)25 28 30 31 16 (7.3 to 35.2) 0.2 (0.1 to 0.3) 86 (76 to 93) 95 (89 to 98)
Studies without GC* 156 (four studies)19 20 25 28 4.0 (2.6 to 6.2) 0.3 (0.2 to 0.7) 73 (49 to 89) 82 (75 to 87)
Studies with high
resolution device*‡ 292 (four studies)
19 25 30 31 13.8 (3.9 to 48.2) 0.1 (0.1 to 0.3) 87 (77 to 93) 94 (79 to 98)
Suspected diagnosis well-defined§
175 (three studies)25 28 31 11.5 (4.5 to 29.2) 0.1 (0.1 to 0.3) 89 (76 to 95) 92 (83 to 97)
Longitudinal studies§ 244 (four studies)19 25 28 31 7.5 (3.4 to 16.8) 0.1 (0.1 to 0.3) 88 (77 to 94) 88 (78 to 94)
MRI
MRI versus clinical
diagnosis (main analysis)* 509 (six studies)
33–35 38–40 5.9 (3.4 to 10.3) 0.3 (0.2 to 0.5) 73 (57 to 85) 88 (81 to 92)
Excluding high RoB
studies*† 446 (five studies)
33 34 38–40 6.8 (3.6 to 13) 0.3 (0.1 to 0.6) 75 (56 to 88) 89 (82 to 93)
Studies with high
resolution device*‡ 260 (four studies)
33 35 39 40 3.8 (2 to 7.5) 0.4 (0.2 to 0.8) 68 (44 to 85) 82 (69 to 91)
Suspected diagnosis§ 270 (three studies)33 34 38 8.7 (5 to 15.2) 0.2 (0.1 to 0.3) 82 (74 to 87) 91 (84 to 95)
Longitudinal studies§ 411 (three studies)34 38 40 7.5 (4.9 to 11.7) 0.3 (0.2 to 0.4) 75 (65 to 84) 90 (85 to 93)
*Bivariate random-effects binomial generalised mixed model.
†High RoB was defined, in the case of concern on ≥5 RoB items or all 3/3 applicability items out of the QUADAS-2 tool. ‡High resolution devices were defined as >12 MHz probes for ultrasound or 3T MRI machines.
§Univariate random-effects models.
longitudinal studies, studies with clinical diagnosis after follow-up as reference standard; LR, likelihood ratio; QUADAS-2, Quality
Assessment of Diagnostic Accuracy Studies-2; RoB, risk of bias; suspected diagnosis, studies with detailed definition of suspicion of giant cell arteritis included; without GC, studies without glucocorticoid treatment before performance of ultrasound.
Table 4
Main characteristics of diagnostic studies on MRI in cranial giant cell arteritis (GCA) and T
akayasu arteritis (T AK) Study ID n n female (%) Inclusion criteria Refer ence standar d
n Final diagn GCA/T
AK(%) n T AB+ (%) n L V-GCA Investigated structur es Elementary lesions RoB GCA Bley et al 33 21 11 (52)
Headache, jaw claudication, TA tender
ness/induration/pulse
decr
ement, visual impairment
ACR criteria or TAB 9 (43) 5 (56) NR TA, occipital W all thickening+contrast enhancement scor e 1–4 Low Bley et al 34 64 31 (48) Headache, T A tender ness, visual impairment, incr eased APR Clinical diagn 6 m or TA B 31 (48) 21 (78) NR TA, occipital W all thickening+contrast enhancement scor e (0–3) Low Geiger et al 35 43 30 (70) Suspected GCA* ACR criteria or TAB 28 (65) 11 (73) NR TA, occipital W all thickening+contrast enhancement scor e (0–3) High Veldhoen et al 36 99 68 (69) Suspected GCA, T
AB, MRI deep T
A, temporal muscle TA B 61 (62) 61 (100) NR Deep T A, temporal muscle W all thickening+contrast enhancement (artery wall/temporal muscle) High Franke et al 37 55 34 (62) Suspected GCA* TA B 14 (25) 14 (100) NR TA, occipital W all thickening+contrast enhancement scor e (0–3) Mod Klink et al 38 185 125 (68) Headache, T A tender ness/pulse, APR +MRI and FU available Clinical diagn 6 m or TA B 102 (55) 62 (63) NR TA, occipital W all thickening+contrast enhancement scor e (0–3) High Siemonsen et al 39 25 21 (84) Suspected GCA ACR criteria or TAB 20 (80) 9 (90) NR
TA, occipital, intracranial TA, occipital [wall thickening+contrast
enhancement, scor e (0–3)] intracranial (enhancement) Mod Rhéaume et al 40 171 126 (74) Suspected GCA+T AB
ACR criteria (retr
ospectively
confirmed) or TAB or clinical diagn FU (NR)
137 (80) 31 (23) NR TA, occipital W all thickening+contrast enhancement scor e (0–3) Mod TA K Yamada et al 55 30 27 (90) Suspected T AK Conventional angiography 20 (67) NA
Aorta, brachiocephalic trunk, subclavian, car
otid, vertebral
Luminal changes (stenosis, occlusion, dilatation, aneurysms)
Low
*Suspected GCA accor
ding to the ACR criteria, no further details described.
ACR, American College of Rheumatology; APR, acute phase r
eactants; diagn, diagnosis; FU, follow-up; GCA, giant cell arteritis; L
V, lar
ge vessel; m, months; mod, moderate; MRI, magnetic r
esonance imaging; n,
number of finally included patients in analysis; NA, not applicable; n female, number
of females; n final diagn GCA, number of patients finally diagnosed with GCA; NR, not r
eported; n L
V-GCA, number of GCA patients
with lar
ge vessel involvement; n T
AB+, number of positive temporal artery biopsy r
esults in finally diagnosed GCA patients; RoB, overall appraisal of risk of bias and concer
ns about applicability (arbitrarily defined) (high,
in the case of concer
n on ≥5/10 risk of bias items or concer
n on 3/3 applicability items out of the QUADAS-2 tool; moderate, in case of concer
n on 4/10 risk of bias items and/or concer
n on ≥1/3 applicability items out
of the QUADAS-2 tool; low
, in case of concer
n on ≤3/3 RoB and no concer
n about applicability); Pat, finally included number of patients in analysis; T
A, temporal artery/arteries; T
AB+, patients with a positive histology
Table 5
Main characteristics of diagnostic studies on
18 F-FDG positr
on emission tomography (18F-FDG PET) and CT angiography (CT
A) in extracranial lar
ge vessel giant
cell arteritis (GCA) and T
akayasu arteritis (T AK) Study ID n n Female (%) Inclusion criteria Refer ence standar d
n Final diagn GCA (%)
n T AB+ (%) n LV -GCA Investigated structur es Elementary lesions RoB 18F-FDG PET GCA Blockmans et al 41 69 38 (55) Age ≥45 years, ESR ≥40 mm/h, headache, fever , PMR, weight loss TA B 13 (19) 13 (100) NR Aorta, car otid,
subclavian, femoral, popliteal, tibial Contrast enhancement (scor
e (0–3)/vascular bed) Mod Larivier e et al 42 24 16 (67) Suspected GCA+T AB Clinical diagn 6 m 15 (63) 6 (40) NR
Aorta, supra-aortic branches, iliac, femoral Contrast enhancement (SUV
max vascular bed/ SUV mean blood) Low C TA GCA Larivier e et al 42 24 16 (67) Suspected GCA+T AB Clinical diagn 6 m 15 (63) 6 (40) NR
Aorta, supra-aortic branches
W
all thickening scor
e (0–3) Low TA K Yamada et al 56 25 NR Suspected T AK CA 20 (80) NA
Aorta, brachiocephalic trunk, subclavian, car
otid, pulmonary trunk
Luminal changes wall thickening (>1
mm)+luminal
changes
Low
CA, conventional angiography; diagn, diagnosis; ESR, erythr
ocyte sedimentation rate; L
V, lar
ge vessel; m, months; mod, moderate; n, number of finally included patients in analysis; NA,
not applicable; n female, number of females; n final diagn GCA, number of patients finally diagnosed with GCA; NR, not r
eported; n L
V-GCA, number of GCA patients with lar
ge vessel
involvement; n T
AB+, number of positive temporal artery biopsy r
esults in finally diagnosed GCA patients; PMR, polymyalgia rheumatica; RoB, overall appraisal of risk of bias and concer
ns
about applicability (arbitrarily defined) (high, in the case of concer
n on ≥5/10 RoB items or concer
n on 3/3 applicability items out of the QUADAS-2 tool; moderate, in case of concer
n on 4/10
RoB items and/or concer
n on ≥1/3 applicability items out of the QUADAS-2 tool, low
, in case of concer
n on ≤3/3 risk of bias items and no concer
n about applicability); Sens, sensitivity; Spec,
specificity; SUV
, standar
dised uptake value; T
study with high RoB and, by exclusion of that particular study, US was more sensitive to diagnose cranial GCA in patients without GCs as compared with the main analysis (83% vs 77%).
The observation that the combination of the US signs ‘halo’, stenosis and occlusion had a similar sensitivity to the ‘halo’ sign alone can be explained by the fact that in GCA, vascular stenosis or occlusion is usually caused by inflammatory wall swelling, which is the morphological correlate of the ‘halo’ sign.6 17 22–24
The ‘compression’ sign, another key elementary US lesion for cranial GCA, revealed a good diagnostic performance in two studies.30 32 Both studies, however,
were published by the same research group and were not completely independent since five patients (Aschwanden M, personal communication) were included in both studies.
The pooled sensitivity (73%) and specificity (88%) of MRI was lower than that of US (77% and 96%, respec-tively) when the clinical diagnosis was used as the refer-ence standard, while MRI had a higher sensitivity (93% vs 70%) and a similar specificity (81% vs 84%) to sonog-raphy when both modalities were compared with TAB. This indirect comparison must be interpreted with caution, because the different test performances are likely also influenced by variations in study design and data analysis. In most MRI studies, for example, TAB was performed in selected cases with high suspicion of GCA only, while in US studies, the majority of patients under-went a TAB. A retrospective study comparing US and MRI directly reported a similar sensitivity (69% and 67%, respectively) and specificity (both with 91%) for both techniques,64 whereas a prospective direct comparison of
both modalities is still missing.
Although PET is commonly used in patients with suspected extracranial LVV, fever of unknown origin or other systemic illnesses, the SLR identified only two prospective studies on this imaging modality41 42
reporting highly discordant results: in the study of Block-mans et al, data from patients with TAB proven GCA, and PMR with 18F-FDG uptake in LVs were both considered as
GCA cases. This creates ‘ground’ for circular reasoning given that the test under investigation had also been part of the reference standard.41 Recalculating the PET
data for TAB positive GCA patients yielded a sensitivity of 77% and specificity of 66%, which might be an under-estimation of the true diagnostic value of PET, because TAB is frequently false negative in patients with extracra-nial LV-GCA.7 Besides, the study by Lariviere et al, which
applied the clinical diagnosis after follow-up of 6 months as reference standard, showed a specificity of PET of 100%.42 This divergence underlines that the
perfor-mance of a diagnostic test is strongly influenced by the reference standard and that such a standard is urgently needed for extracranial LVV in order to facilitate future studies in the field.
Extracranial large arteries are involved in up to 80% of patients with GCA.8 48 65 66 In one US study, sensitivity
improved by only 2%, when axillary arteries were inves-tigated in addition to temporal arteries, with similar specificity.31 Since no other studies were available, the
diagnostic gain of evaluating different vascular beds with imaging in addition to cranial arteries remains there-fore unclear. Additional studies are warranted to clarify whether a standardised hierarchical approach to assess different vascular territories (eg, temporal, carotid, subclavian and axillary arteries) with US or other imaging modalities improves the diagnostic certainty of cranial and extracranial LV-GCA to an extent that justifies the increased clinical effort. The relatively low sensitivity of 55% for US assessment of 22 arteries reported in the study by Aschwanden et al is probably explained by the fact that one-third of patients had extracranial LV-GCA and that the American College of Rheumatology (ACR) criteria were applied as the reference standard. The ACR criteria mainly capture patients with cranial GCA.29
In TAK, both studies on MRA and CTA revealed excel-lent sensitivities and specificities using conventional angiography as the reference standard. These studies, however, were small, included (partially) the same patients and there was a long interval between MRA/ CTA and angiography.55 56 Future studies on the
diag-nostic performance of imaging techniques in TAK are thus warranted, and there is a need for a novel reference standard, given that conventional angiography is highly invasive.
Current evidence on the role for imaging modali-ties for outcome prediction, as well as for monitoring disease activity and damage in LVV is limited. Although a response of vessel wall alterations to GC treatment was detected in both, cranial and extracranial LV-GCA and TAK,17 20 22 25 28 29 43–45 48–51 57 58 neither imaging findings at
baseline nor during follow-up were clearly associated with a disease relapse or any other outcome. Besides, monitoring studies were mainly descriptive and without clear infer-ences, thus precluding drawing a clear conclusion from them that could be of further information for an SLR like ours. The decision to include these studies in the current SLR was solely based on content knowledge, while from a methodological point of view, this decision is obviously arguable. Now, 15 studies on monitoring are included in this SLR, as we were inclusive, and facing a scarcity of studies, tried to retrieve from the literature any informa-tion on the value of imaging for monitoring LVV. However, we could have also been somewhat more restrictive by only including studies that analysed any association between the imaging for monitoring and other outcomes (eg, relapse); if this was the case, no eligible study would have been found in the literature. The development of standard tools for monitoring disease activity and damage in LVV is urgently needed and might facilitate further research on the eval-uation of the role of imaging for disease monitoring and outcome prediction.
Studies on minimal technical requirements, settings and operational procedures for the evaluation of patients with cranial and extracranial LV-GCA are also scarce.
The quality of imaging devices is obviously a critical issue, because poor equipment may easily lead to misclassifica-tion of patients67 and because heterogeneity in the quality
of imaging devices renders comparison between studies difficult. To avoid this type of bias in our meta-analysis, we performed a sensitivity analysis focusing on studies using high-quality US machines only which resulted, as expected, in a higher sensitivity as compared with the main analysis (87% vs 77%), thus confirming the important role of using high-quality imaging devices.
In summary, this SLR confirms the good performance of US and MRI of the superficial temporal arteries for diag-nosis of cranial GCA. More data on imaging techniques in LV-GCA and TAK are needed, as well as on the role of imaging for outcome prediction, monitoring and technical aspects of LVV, as current studies on these aspects are not conclusive. Based on the results of this SLR, EULAR recom-mendations for the use of imaging modalities in LVV in daily clinical practice have been developed.
Author affiliations
1Department of internal Medicine, clinical Division of internal Medicine ii, Medical University innsbruck, innsbruck, austria
2rheumatology Service, South tyrolean Health trust, Hospital of Bruneck, Bruneck, italy
3Department of rheumatology and immunology, Medical University graz, graz, austria
4Department of rheumatology, leiden University Medical center, leiden, the netherlands
5nOVa Medical School, Universidade nova de lisboa, lisboa, Portugal
6center for Behavioral cardiovascular Health, columbia University Medical center, new York city, new York, USa
7Medical centre for rheumatology Berlin-Buch, immanuel Krankenhaus Berlin, Berlin, germany
Contributors Study concept and design: christinD, christiaD, Sr and WaS; data collection: christinD and christiaD; statistical analysis and data interpretation: aS, christinD, christiaD, Sr and WaS; christinD prepared the first version of the manuscript. all authors revised the manuscript critically for important intellectual content and gave final approval of the version to be published.
Funding Funding was provided by the european league against rheumatism.
Competing interests none declared.
Provenance and peer review not commissioned; externally peer reviewed.
data sharing statement no additional data are available.
Open Access this is an Open access article distributed in accordance with the creative commons attribution non commercial (cc BY-nc 4.0) license, which permits others to distribute, remix, adapt, build upon this work non-commercially, and license their derivative works on different terms, provided the original work is properly cited and the use is non-commercial. See: http:// creativecommons. org/ licenses/ by- nc/ 4. 0/
© article author(s) (or their employer(s) unless otherwise stated in the text of the article) 2018. all rights reserved. no commercial use is permitted unless otherwise expressly granted.
RefeRences
1. Salvarani C, Pipitone N, Versari A, et al. Clinical features of polymyalgia rheumatica and giant cell arteritis. Nat Rev Rheumatol
2012;8:509–21.
2. Direskeneli H. Clinical assessment in Takayasu's arteritis: major challenges and controversies. Clin Exp Rheumatol 2017;35(Suppl 103):189–93.
3. Hall S, Persellin S, Lie JT, et al. The therapeutic impact of temporal artery biopsy. Lancet 1983;2:1217–20.
4. Mukhtyar C, Guillevin L, Cid MC, et al. EULAR recommendations for the management of large vessel vasculitis. Ann Rheum Dis
2009;68:318–23.
5. Hunder GG, Bloch DA, Michel BA, et al. The American College of Rheumatology 1990 criteria for the classification of giant cell arteritis. Arthritis Rheum 1990;33:1122–8.
6. Luqmani R, Lee E, Singh S, et al. The role of ultrasound compared to biopsy of Temporal Arteries in the Diagnosis and Treatment of Giant Cell Arteritis (TABUL): a diagnostic accuracy and cost-effectiveness study. Health Technol Assess 2016;20:1–238.
7. Brack A, Martinez-Taboada V, Stanson A, et al. Disease pattern in cranial and large-vessel giant cell arteritis. Arthritis Rheum
1999;42:311–7.
8. Schmidt WA, Seifert A, Gromnica-Ihle E, et al. Ultrasound of proximal upper extremity arteries to increase the diagnostic yield in large-vessel giant cell arteritis. Rheumatology 2008;47:96–101. 9. Arend WP, Michel BA, Bloch DA, et al. The American College of
Rheumatology 1990 criteria for the classification of Takayasu arteritis. Arthritis Rheum 1990;33:1129–34.
10. Schmidt WA. Role of ultrasound in the understanding and management of vasculitis. Ther Adv Musculoskelet Dis
2014;6:39–47.
11. Cinar I, Wang H, Stone JR. Clinically isolated aortitis: pitfalls, progress, and possibilities. Cardiovasc Pathol 2017;29:23–32. 12. Dejaco C, Ramiro S, Duftner C, et al. EULAR recommendations for
the use of imaging in large vessel vasculitis in clinical practice. Ann
Rheum Dis 2018. doi: 10.1136/annrheumdis-2017- 212649. [Epub
ahead of print 22 Jan 2018].
13. Sackett DL, Richardson WS, Rosenberg W, et al; Evidence Based
Medicine-How to Practice and Teach EBM. London: Churchill
Livingstone, 1997.
14. Whiting PF, Rutjes AWS, Westwood ME, et al. Research and Reporting Methods Accuracy Studies. Ann Intern Med 2011;155:529–36.
15. Hayden JA, Côté P, Bombardier C. Evaluation of the quality of prognosis studies in systematic reviews. Ann Intern Med
2006;144:427–37.
16. Takwoingi Y, Guo B, Riley RD, et al. Performance of methods for meta-analysis of diagnostic test accuracy with few studies or sparse data. Stat Methods Med Res 2017;26.
17. Schmidt WA, Kraft HE, Vorpahl K, et al. Color duplex
ultrasonography in the diagnosis of temporal arteritis. N Engl J Med
1997;337:1336–42.
18. LeSar CJ, Meier GH, DeMasi RJ, et al. The utility of color duplex ultrasonography in the diagnosis of temporal arteritis. J Vasc Surg
2002;36:1154–60.
19. Nesher G, Shemesh D, Mates M, et al. The predictive value of the halo sign in color Doppler ultrasonography of the temporal arteries for diagnosing giant cell arteritis. J Rheumatol 2002;29:1224–6. 20. Salvarani C, Silingardi M, Ghirarduzzi A, et al. Is duplex
ultrasonography useful for the diagnosis of giant-cell arteritis? Ann
Intern Med 2002;137:232–8.
21. Murgatroyd H, Nimmo M, Evans A, et al. The use of ultrasound as an aid in the diagnosis of giant cell arteritis: a pilot study comparing histological features with ultrasound findings. Eye
2003;17:415–9.
22. Pfadenhauer K, Weber H. Duplex sonography of the temporal and occipital artery in the diagnosis of temporal arteritis. A prospective study. J Rheumatol 2003;30:2177–81.
23. Reinhard M, Schmidt D, Hetzel A. Color-coded sonography in suspected temporal arteritis-experiences after 83 cases. Rheumatol Int 2004;24:340–6.
24. Romera-Villegas A, Vila-Coll R, Poca-Dias V, et al. The role of color duplex sonography in the diagnosis of giant cell arteritis.
J Ultrasound Med 2004;23:1493–8.
25. Karahaliou M, Vaiopoulos G, Papaspyrou S, et al. Colour duplex sonography of temporal arteries before decision for biopsy: a prospective study in 55 patients with suspected giant cell arteritis.
Arthritis Res Ther 2006;8:R116.
26. Pfadenhauer K, Behr C. The contribution of ultrasound of the craniocervical arteries to the diagnosis of giant cell arteritis. Clin
Ophthalmol 2007;1:461–70.
27. Zaragozá García JM, Plaza Martínez A, Briones Estébanez JL, et al. [Value of the Doppler-ultrasonography for the diagnosis of temporal arteritis]. Med Clin 2007;129:451–3.
28. Habib HM, Essa AA, Hassan AA. Color duplex ultrasonography of temporal arteries: role in diagnosis and follow-up of suspected cases of temporal arteritis. Clin Rheumatol 2012;31:231–7. 29. Aschwanden M, Kesten F, Stern M, et al. Vascular involvement in
patients with giant cell arteritis determined by duplex sonography of 2x11 arterial regions. Ann Rheum Dis 2010;69:1356–9.
30. Aschwanden M, Daikeler T, Kesten F, et al. Temporal artery compression sign – a novel ultrasound finding for the diagnosis of giant cell arteritis. Ultraschall Med 2013;34:47–50.
31. Diamantopoulos AP, Haugeberg G, Hetland H, et al. Diagnostic value of color Doppler ultrasonography of temporal arteries and large vessels in giant cell arteritis: a consecutive case series. Arthritis Care Res 2014;66:113–9.
32. Aschwanden M, Imfeld S, Staub D, et al. The ultrasound
compression sign to diagnose temporal giant cell arteritis shows an excellent interobserver agreement. Clin Exp Rheumatol 2015;33(2 Suppl 89):S113–5.
33. Bley TA, Weiben O, Uhl M, et al. Assessment of the cranial
involvement pattern of giant cell arteritis with 3T magnetic resonance imaging. Arthritis Rheum 2005;52:2470–7.
34. Bley TA, Uhl M, Carew J, et al. Diagnostic value of high-resolution MR imaging in giant cell arteritis. AJNR Am J Neuroradiol
2007;28:1722–7.
35. Geiger J, Bley T, Uhl M, et al. Diagnostic value of T2-weighted imaging for the detection of superficial cranial artery inflammation in giant cell arteritis. J Magn Reson Imaging 2010;31:470–4.
36. Veldhoen S, Klink T, Geiger J, et al. MRI displays involvement of the temporalis muscle and the deep temporal artery in patients with giant cell arteritis. Eur Radiol 2014;24:2971–9.
37. Franke P, Markl M, Heinzelmann S, et al. Evaluation of a 32-channel versus a 12-channel head coil for high-resolution post-contrast MRI in giant cell arteritis (GCA) at 3T. Eur J Radiol 2014;83:1875–80. 38. Klink T, Geiger J, Both M, et al. Giant cell arteritis: diagnostic
accuracy of MR imaging of superficial cranial arteries in initial diagnosis-results from a multicenter trial. Radiology
2014;273:844–52.
39. Siemonsen S, Brekenfeld C, Holst B, et al. 3T MRI reveals extra- and intracranial involvement in giant cell arteritis. AJNR Am J Neuroradiol
2015;36:91–7.
40. Rhéaume M, Rebello R, Pagnoux C, et al. High-Resolution Magnetic Resonance Imaging of Scalp Arteries for the Diagnosis of Giant Cell Arteritis: Results of a Prospective Cohort Study. Arthritis Rheumatol
2017;69:161–8.
41. Blockmans D, Stroobants S, Maes A, et al. Positron emission tomography in giant cell arteritis and polymyalgia rheumatica: evidence for inflammation of the aortic arch. Am J Med
2000;108:246–9.
42. Lariviere D, Benali K, Coustet B, et al. Positron emission tomography and computed tomography angiography for the diagnosis of giant cell arteritis: A real-life prospective study. Medicine 2016;95:e4146. 43. Schmidt WA, Moll A, Seifert A, et al. Prognosis of large-vessel giant
cell arteritis. Rheumatology 2008;47:1406–8.
44. De Miguel E, Roxo A, Castillo C, et al. The utility and sensitivity of colour Doppler ultrasound in monitoring changes in giant cell arteritis. Clin Exp Rheumatol 2012;30(1 Suppl 70):S34–8. 45. Blockmans D, de Ceuninck L, Vanderschueren S, et al. Repetitive
18F-fluorodeoxyglucose positron emission tomography in giant cell arteritis: a prospective study of 35 patients. Arthritis Rheum
2006;55:131–7.
46. Blockmans D, Coudyzer W, Vanderschueren S, et al. Relationship between fluorodeoxyglucose uptake in the large vessels and late aortic diameter in giant cell arteritis. Rheumatology
2008;47:1179–84.
47. García-Martínez A, Arguis P, Prieto-González S, et al. Prospective long term follow-up of a cohort of patients with giant cell arteritis screened for aortic structural damage (aneurysm or dilatation). Ann
Rheum Dis 2014;73:1826–32.
48. Schmidt WA, Natusch A, Möller DE, et al. Involvement of peripheral arteries in giant cell arteritis: a color Doppler sonography study. Clin
Exp Rheumatol 2002;20:309–18.
49. Pérez López J, Solans Laqué R, Bosch Gil JA, et al. Colour-duplex ultrasonography of the temporal and ophthalmic arteries in the diagnosis and follow-up of giant cell arteritis. Clin Exp Rheumatol
2009;27(1 Suppl 52):S77–82.
50. Both M, Ahmadi-Simab K, Reuter M, et al. MRI and FDG-PET in the assessment of inflammatory aortic arch syndrome in complicated courses of giant cell arteritis. Ann Rheum Dis 2008;67:1030–3. 51. Prieto-González S, García-Martínez A, Tavera-Bahillo I, et al. Effect
of glucocorticoid treatment on computed tomography angiography detected large-vessel inflammation in giant-cell arteritis. A prospective, longitudinal study. Medicine 2015;94:e486.
52. Hautzel H, Sander O, Heinzel A, et al. Assessment of large-vessel involvement in giant cell arteritis with 18F-FDG PET: introducing an ROC-analysis-based cutoff ratio. J Nucl Med 2008;49:1107–13. 53. Martínez-Rodríguez I, del Castillo-Matos R, Quirce R, et al.
Comparison of early (60 min) and delayed (180 min) acquisition of 18F-FDG PET/CT in large vessel vasculitis. Rev Esp Med Nucl
Imagen Mol 2013;32:222–6.
54. Martínez-Rodríguez I, Martínez-Amador N, Banzo I, et al. Assessment of aortitis by semiquantitative analysis of 180-min 18F-FDG PET/CT acquisition images. Eur J Nucl Med Mol Imaging
2014;41:2319–24.
55. Yamada I, Nakagawa T, Himeno Y, et al. Takayasu arteritis: diagnosis with breath-hold contrast-enhanced three-dimensional MR angiography. J Magn Reson Imaging 2000;11:481–7. 56. Yamada I, Nakagawa T, Himeno Y, et al. Takayasu arteritis:
evaluation of the thoracic aorta with CT angiography. Radiology
1998;209:103–9.
57. Fan W, Zhu J, Li J, et al. Ultrasound morphological changes in the carotid wall of Takayasu's arteritis: monitor of disease progression.
Int Angiol 2016;35:586–92.
58. Sun Y, Ma L, Ji Z, et al. Value of whole-body contrast-enhanced magnetic resonance angiography with vessel wall imaging in quantitative assessment of disease activity and follow-up examination in Takayasu's arteritis. Clin Rheumatol 2016;35:685–93. 59. Karassa FB, Matsagas MI, Schmidt WA, et al. Meta-analysis: test
performance of ultrasonography for giant-cell arteritis. Ann Intern Med 2005;142:359–69.
60. Ball EL, Walsh SR, Tang TY, et al. Role of ultrasonography in the diagnosis of temporal arteritis. Br J Surg 2010;97:1765–71. 61. Arida A, Kyprianou M, Kanakis M, et al. The diagnostic value of
ultrasonography-derived edema of the temporal artery wall in giant cell arteritis: a second meta-analysis. BMC Musculoskelet Disord
2010;11:44.
62. Buttgereit F, Dejaco C, Matteson EL, et al. Polymyalgia rheumatica and giant cell arteritis. JAMA 2016;315:2442–58.
63. Hauenstein C, Reinhard M, Geiger J, et al. Effects of early corticosteroid treatment on magnetic resonance imaging and ultrasonography findings in giant cell arteritis. Rheumatology
2012;51:1999–2003.
64. Bley TA, Reinhard M, Hauenstein C, et al. Comparison of duplex sonography and high-resolution magnetic resonance imaging in the diagnosis of giant cell (temporal) arteritis. Arthritis Rheum
2008;58:2574–8.
65. Czihal M, Zanker S, Rademacher A, et al. Sonographic and clinical pattern of extracranial and cranial giant cell arteritis. Scand J
Rheumatol 2012;41:231–6.
66. Czihal M, Tatò F, Rademacher A, et al. Involvement of the femoropopliteal arteries in giant cell arteritis: clinical and color duplex sonography. J Rheumatol 2012;39:314–21.
67. Puppo C, Massollo M, Paparo F, et al. Giant cell arteritis: a systematic review of the qualitative and semiquantitative methods to assess vasculitis with 18F-fluorodeoxyglucose positron emission tomography. Biomed Res Int 2014;2014:1–11.
recommendations
meta-analysis informing the EULAR
systematic literature review and
and monitoring of large vessel vasculitis: a
Imaging in diagnosis, outcome prediction
Wolfgang Andreas Schmidt and Sofia Ramiro
Christina Duftner, Christian Dejaco, Alexandre Sepriano, Louise Falzon,
doi: 10.1136/rmdopen-2017-000612
2018 4:RMD Open
http://rmdopen.bmj.com/content/4/1/e000612 Updated information and services can be found at:
These include:
References
http://rmdopen.bmj.com/content/4/1/e000612#ref-list-1
This article cites 64 articles, 11 of which you can access for free at:
Open Access
http://creativecommons.org/licenses/by-nc/4.0/
non-commercial. See:
provided the original work is properly cited and the use is
non-commercially, and license their derivative works on different terms, permits others to distribute, remix, adapt, build upon this work
Commons Attribution Non Commercial (CC BY-NC 4.0) license, which This is an Open Access article distributed in accordance with the Creative
service
Email alerting
box at the top right corner of the online article.
Receive free email alerts when new articles cite this article. Sign up in the
Notes
http://group.bmj.com/group/rights-licensing/permissions To request permissions go to:
http://journals.bmj.com/cgi/reprintform To order reprints go to:
http://group.bmj.com/subscribe/ To subscribe to BMJ go to: