Significance of Serum Pepsinogens as a
Biomarker for Gastric Cancer and Atrophic
Gastritis Screening: A Systematic Review and
Meta-Analysis
Ya-kai Huang, Jian-chun Yu
*
, Wei-ming Kang, Zhi-qiang Ma, Xin Ye, Shu-bo Tian,
Chao Yan
Department of General Surgery, Peking Union Medical College Hospital, Chinese Academy of Medical Sciences and Peking Union Medical College, Beijing, China
Abstract
Background
Human pepsinogens are considered promising serological biomarkers for the screening of
atrophic gastritis (AG) and gastric cancer (GC). However, there has been controversy in the
literature with respect to the validity of serum pepsinogen (SPG) for the detection of GC and
AG. Consequently, we conducted a systematic review and meta-analysis to assess the
diagnostic accuracy of SPG in GC and AG detection.
Methods
We searched PubMed, Embase, and the Chinese National Knowledge Infrastructure
(CNKI) for correlative original studies published up to September 30, 2014. The summary
sensitivity, specificity, positive diagnostic likelihood ratio (DLR+), negative diagnostic
likeli-hood ratio (DLR-), area under the summary receiver operating characteristic curve (AUC)
and diagnostic odds ratio (DOR) were used to evaluate SPG in GC and AG screening
based on bivariate random effects models. The inter-study heterogeneity was evaluated by
the I
2statistics and publication bias was assessed using Begg and Mazumdar
’
s test.
Meta-regression and subgroup analyses were performed to explore study heterogeneity.
Results
In total, 31 studies involving 1,520 GC patients and 2,265 AG patients were included in the
meta-analysis. The summary sensitivity, specificity, DLR+, DLR-, AUC and DOR for GC
screening using SPG were 0.69 (95% CI: 0.60
–
0.76), 0.73 (95% CI: 0.62
–
0.82), 2.57 (95%
CI: 1.82
–
3.62), and 0.43 (95% CI: 0.34
–
0.54), 0.76 (95% CI: 0.72
–
0.80) and 6.01 (95% CI:
3.69
–
9.79), respectively. For AG screening, the summary sensitivity, specificity, DLR+,
DLR-, AUC and DOR were 0.69 (95% CI: 0.55
–
0.80), 0.88 (95% CI: 0.77
–
0.94), 5.80 (95%
CI: 3.06
–
10.99), and 0.35 (95% CI: 0.24
–
0.51), 0.85 (95% CI: 0.82
–
0.88) and 16.50 (95%
OPEN ACCESS
Citation:Huang Y-k, Yu J-c, Kang W-m, Ma Z-q, Ye
X, Tian S-b, et al. (2015) Significance of Serum Pepsinogens as a Biomarker for Gastric Cancer and Atrophic Gastritis Screening: A Systematic Review and Meta-Analysis. PLoS ONE 10(11): e0142080. doi:10.1371/journal.pone.0142080
Editor:Hiromu Suzuki, Sapporo Medical University,
JAPAN
Received:January 24, 2015
Accepted:October 16, 2015
Published:November 10, 2015
Copyright:© 2015 Huang et al. This is an open
access article distributed under the terms of the Creative Commons Attribution License, which permits unrestricted use, distribution, and reproduction in any medium, provided the original author and source are credited.
Data Availability Statement:All relevant data are
within the paper and its Supporting Information files.
Funding:The present study was financially
supported by Beijing Municipal Natural Science Foundation of China (No. 7132209;http://www.bjnsf. org/nsf_xmsq/nsf_zzxm/). The funders had no role in study design, data collection and analysis, decision to publish, or preparation of the manuscript.
Competing Interests:The authors have declared
CI: 8.18
–
33.28), respectively. In subgroup analysis, the use of combination of concentration
of PGI and the ratio of PGI:PGII as measurement of SPG for GC screening yielded
sensitiv-ity of 0.70 (95% CI: 0.66
–
0.75), specificity of 0.79 (95% CI: 0.79
–
0.80), DOR of 6.92 (95%
CI: 4.36
–
11.00), and AUC of 0.78 (95% CI: 0.72
–
0.81), while the use of concentration of
PGI yielded sensitivity of 0.55 (95% CI: 0.51
–
0.60), specificity of 0.79 (95% CI: 0.76
–
0.82),
DOR of 6.88 (95% CI: 2.30
–
20.60), and AUC of 0.77 (95% CI: 0.73
–
0.92). For AG
screen-ing, the use of ratio of PGI:PGII as measurement of SPG yielded sensitivity of 0.69 (95% CI:
0.52
–
0.83), specificity of 0.84 (95% CI: 0.68
–
0.93), DOR of 11.51 (95% CI: 6.14
–
21.56),
and AUC of 0.83 (95% CI: 0.80
–
0.86), the use of combination of concentration of PGI and
the ratio of PGI:PGII yield sensitivity of 0.79 (95% CI: 0.72
–
0.85), specificity of 0.89 (95%
CI: 0.85
–
0.93), DOR of 24.64 (95% CI: 6.95
–
87.37), and AUC of 0.87 (95% CI: 0.81
–
0.92),
concurrently, the use of concentration of PGI yield sensitivity of 0.46 (95% CI: 0.38
–
0.54),
specificity of 0.93 (95% CI: 0.91
–
0.95), DOR of 19.86 (95% CI: 0.86
–
456.91), and AUC of
0.86 (95% CI: 0.52
–
1.00).
Conclusion
SPG has great potential as a noninvasive, population-based screening tool in GC and AG
screening. In addition, given the potential publication bias and high heterogeneity of the
included studies, further high quality studies are required in the future.
Introduction
Gastric cancer (GC) was the fifth most common cancer and the third leading cause of
cancer-related mortality worldwide [1]. In the Asia-Pacific region, the incidence of GC is high in
Japan, China, Korea, Singapore, and Malaysia and is low in Thailand, India, New Zealand and
Australia[2]. The clinical symptoms in the early stages of GC are not specific; therefore, a large
number of patients with early GC do not seek appropriate medical care until the disease has
progressed [3], and the prognosis of patients with advanced GC remains poor [4]. GC develops
in a stepwise manner, and subjects with precancerous lesions, such as atrophic gastritis (AG),
intestinal metaplasia (IM), and dysplasia, may be at high risk of eventually developing
carci-noma. Subsequently, it is important to improve the prognosis of GC by identifying its high-risk
population. The development of tools for the early diagnosis of GC and precancerous lesions of
GC is important for reducing mortality, increasing survival rates, and improving quality of life
[5]. Endoscopy and biopsy are the reference standards for diagnosis and screening of GC and
precancerous lesions of GC, but their use is limited for population-wide screening due to their
invasiveness[6,
7]. Subsequently, it is necessary to identify novel, simple, cost-effective and
manipulable screening methods for GC and precancerous lesions of GC.
with increasing severity of
H
.
pylori
-related chronic gastritis. However, when atrophic changes
in the corpus are accompanied by a loss of cells in the corpus, including those secreting PGI,
the level of PGI decreases, whereas the level of PGII remains high or stable. Therefore, the ratio
of PGI:PGII decreases in a stepwise manner. More severe atrophy is related to a lower PGI:
PGII ratio. The non-invasive markers PGI and PGII and their ratio have been proposed as
predictors of various gastric pathologies, including AG and IM[10,
12], which are defined as
precancerous lesions for GC[13]. In addition, several case-control and cohort studies have
demonstrated the predictive value of SPG for GC diagnosis and screening, suggesting that it is
possible to use SPG for GC screening on the basis of large populations. In Japan, SPG detection
has become the first step of GC screening, instead of photofluorography[14].
SPG has been commonly accepted as a useful biomarker for GC screening and AG
diagno-sis, but its efficacy remains controversial. To obtain summary estimates of the diagnostic
accu-racy of SPG for screening GC and for the diagnosis of AG, the present meta-analysis was
performed to assess the overall diagnostic performance of SPG in patients with GC or AG.
Materials and methods
Search strategy
Electronic searches were performed using PubMed, Embase, and the Chinese National
Knowl-edge Infrastructure (CNKI). To assess the diagnostic value of SPG in GC, the following search
terms were used: (1) (((((pepsinogen[Title/Abstract]) AND gastric cancer[Title/Abstract])) OR
((pepsinogen[Title/Abstract]) AND gastric carcinoma[Title/Abstract])) OR ((pepsinogen[Title/
Abstract]) AND stomach carcinoma[Title/Abstract])) OR ((pepsinogen[Title/Abstract]) AND
stomach cancer[Title/Abstract]) in PubMed and CNKI; (2) (TITLE-ABSTR-KEY(pepsinogen)
and ABSTR-KEY(stomach cancer)) or (((ABSTR-KEY(pepsinogen) and
TITLE-ABSTR-KEY(gastric cancer)) or (TITLE-ABSTR-KEY(pepsinogen) and TITLE-ABSTR-KEY
(gastric carcinoma))) or (TITLE-ABSTR-KEY(pepsinogen) and TITLE-ABSTR-KEY(stomach
carcinoma))) in Embase (ScienceDirect). The search terms used for AG diagnosis by SPG were
presented as follows: (1) ((((gastritis[Title/Abstract]) AND pepsinogen[Title/Abstract])) OR
((intestinal metaplasia [Title/Abstract]) AND pepsinogen[Title/Abstract])) OR ((dysplasia[Title/
Abstract]) AND pepsinogen[Title/Abstract]) in PubMed and CNKI; (2) ((TITLE-ABSTR-KEY
(pepsinogen) and TITLE-ABSTR-KEY(gastritis)) or (TITLE-ABSTR-KEY(pepsinogen) and
ABSTR-KEY(intestinal metaplasia))) or (ABSTR-KEY(pepsinogen) and
TITLE-ABSTR-KEY(dysplasia)) in Embase (ScienceDirect). The reference lists of all retrieved articles
were reviewed to identify additional potentially relevant studies in adherence with the preferred
reporting items for systematic reviews and meta-analysis (PRISMA) guidelines.
Selection criteria
Data extraction and quality assessment of studies
The data extracted from studies included the following: (1) basic characteristics of studies,
including: first author’s name; publication year; country of origin; the number of patients and
controls; detection method; cut-off values; study design; pathological type and mean age; and
(2) diagnostic performance, including sensitivity, specificity, TP, FP, FN, and TN. The Quality
Assessment of Diagnostic Accuracy Studies-2 (QUADAS-2) checklist was used by two
review-ers (C.Y. and YK.H.) to assess study quality using RevMan 5.3[15]. However, studies were not
excluded on the basis of quality. A proportional bar graph and summary table of review
authors' ratings for each criterion was plotted to characterize the results of our assessment.
Statistical analysis
We calculated the pooled sensitivity, pooled specificity, diagnostic odds ratio (DOR), positive
diagnostic likelihood ratio (DLR+), negative diagnostic likelihood ratio (DLR-), and 95%
confi-dence intervals (CIs) for each criterion. A summary receiver operator characteristic (SROC)
curve was generated, and the area under the summary receiver operating characteristic curve
(AUC) was calculated[16]. To assess the clinical utility of SPG for GC and AG diagnosis,
Fagan’s nomograms were plotted. The threshold effect was assessed by Spearman’s correlation
analysis. Heterogeneity was assessed using the I
2statistics; I
2>
50% indicated moderate to high
heterogeneity[17]. Meta-regression was performed to identify possible sources of
heterogene-ity. Subgroup analyses were also performed as necessary. Sensitivity analysis was performed to
evaluate the effects of each individual study on the summary accuracy of SPG detection for GC
and AG. A funnel plot followed by the Begg and Mazumdar's test was used to explore potential
publication bias. All analyses were performed with Stata 12.0 (College Station, TX, USA),
Meta-DiSc statistical software[18], and RevMan 5.3 (Cochrane, USA).
Results
Identification of studies
Study characteristics and quality assessment
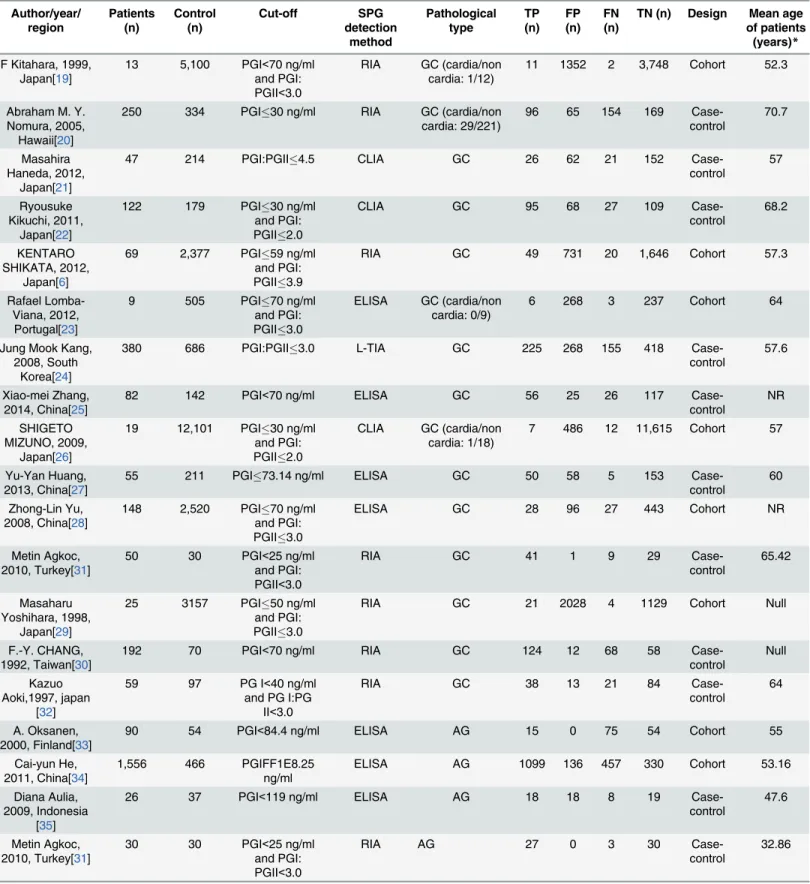
The characteristics of the included studies are summarized in
Table 1. Briefly, the 31 studies
represented 13 countries. In total, 27 studies were published in English, 2 were written in
Chi-nese, and 1 was written in Korean. Overall, 1,520 GC patients and 27,723 control samples were
included in 15 studies with respect to GC diagnosis. A total of 2,265 AG patients and 2,660
control samples were included in the 16 studies with respect to the diagnosis of AG. All patients
were diagnosed by endoscopy and biopsy. The studies were published from 1991 to 2014 and
used different detection methods and cut-off values, although most involved radio-immunity
assays (RIA) and enzyme-linked immunosorbent assays (ELISA). The most commonly used
cut-off values were PG I
70 ng/ml and PG I:PG II
3.0 (Table 1). Four articles contained
dif-ferent cut-off values within the same study, and we selected the cut-off values with the highest
Youden’s index for the present analysis. For GC diagnosis, the sensitivity and specificity ranges
were 37–91% and 36–97%, respectively, and the sensitivity and specificity ranges for the
diag-nosis of AG using SPG were 17–91% and 39–100%, respectively.
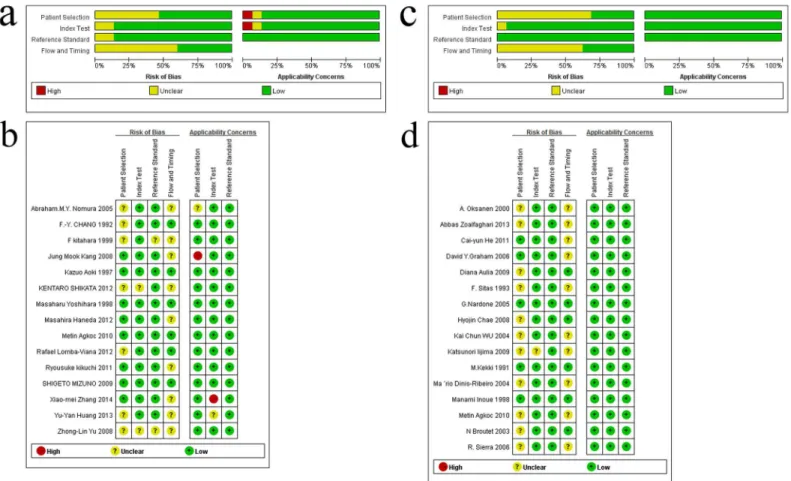
An assessment of the studies by QUADAS-2 is presented in
Fig 2. The overall quality of the
eligible studies for GC diagnosis was not robust, but the studies showed good overall quality
with respect to the diagnosis of AG. The index test and reference standard did not have an
interaction effect for any of the included studies. For GC diagnosis, 6 of the 15 included studies
had a cohort design, and 9 were case-control studies. For AG diagnosis, 13 of the 16 included
studies had a cohort design, and 3 were case-control studies. For GC diagnosis, all studies had
strict reference standards, and 9 contained clearly defined inclusion and exclusion criteria.
Three of the 15 included studies did not employ an appropriate interval between the reference
standard and the index test, which potentially led to the introduction of bias. For the diagnosis
of AG, all included studies also had strict reference standards and employed an appropriate
interval between the reference standard and the index test; 10 contained clearly defined
inclu-sion and excluinclu-sion criteria, and 6 did not.
Diagnostic accuracy of SPG in GC and AG
A forest plot was used to demonstrate the sensitivity, specificity, DLR+, and DLR- for the
detection of SPG in GC screening and AG diagnosis. The I
2values of the summary sensitivity,
summary specificity, summary DLR+, and summary DLR- for studies of GC were 88.27%
(95% CI: 83.46–93.07%), 99.61% (95% CI: 99.55–99.66%), 90.39% (95% CI: 90.39–95.41%),
and 85.21% (95% CI: 78.74–91.68%), respectively. The I
2values of the summary sensitivity,
Table 1. Characteristics of the studies included in the meta-analysis Author/year/ region Patients (n) Control (n) Cut-off SPG detection method Pathological type TP (n) FP (n) FN (n)
TN (n) Design Mean age of patients
(years)*
F Kitahara, 1999, Japan[19]
13 5,100 PGI<70 ng/ml and PGI: PGII<3.0
RIA GC (cardia/non cardia: 1/12)
11 1352 2 3,748 Cohort 52.3
Abraham M. Y. Nomura, 2005, Hawaii[20]
250 334 PGI30 ng/ml RIA GC (cardia/non
cardia: 29/221)
96 65 154 169
Case-control
70.7
Masahira Haneda, 2012,
Japan[21]
47 214 PGI:PGII4.5 CLIA GC 26 62 21 152
Case-control
57
Ryousuke Kikuchi, 2011,
Japan[22]
122 179 PGI30 ng/ml
and PGI: PGII2.0
CLIA GC 95 68 27 109
Case-control
68.2
KENTARO SHIKATA, 2012,
Japan[6]
69 2,377 PGI59 ng/ml
and PGI: PGII3.9
RIA GC 49 731 20 1,646 Cohort 57.3
Rafael Lomba-Viana, 2012,
Portugal[23]
9 505 PGI70 ng/ml
and PGI: PGII3.0
ELISA GC (cardia/non cardia: 0/9)
6 268 3 237 Cohort 64
Jung Mook Kang, 2008, South
Korea[24]
380 686 PGI:PGII3.0 L-TIA GC 225 268 155 418
Case-control
57.6
Xiao-mei Zhang, 2014, China[25]
82 142 PGI<70 ng/ml ELISA GC 56 25 26 117
Case-control
NR
SHIGETO MIZUNO, 2009,
Japan[26]
19 12,101 PGI30 ng/ml
and PGI: PGII2.0
CLIA GC (cardia/non cardia: 1/18)
7 486 12 11,615 Cohort 57
Yu-Yan Huang, 2013, China[27]
55 211 PGI73.14 ng/ml ELISA GC 50 58 5 153
Case-control
60
Zhong-Lin Yu, 2008, China[28]
148 2,520 PGI70 ng/ml
and PGI: PGII3.0
ELISA GC 28 96 27 443 Cohort NR
Metin Agkoc, 2010, Turkey[31]
50 30 PGI<25 ng/ml and PGI: PGII<3.0
RIA GC 41 1 9 29
Case-control
65.42
Masaharu Yoshihara, 1998,
Japan[29]
25 3157 PGI50 ng/ml
and PGI: PGII3.0
RIA GC 21 2028 4 1129 Cohort Null
F.-Y. CHANG, 1992, Taiwan[30]
192 70 PGI<70 ng/ml RIA GC 124 12 68 58
Case-control
Null
Kazuo Aoki,1997, japan
[32]
59 97 PG I<40 ng/ml and PG I:PG
II<3.0
RIA GC 38 13 21 84
Case-control
64
A. Oksanen, 2000, Finland[33]
90 54 PGI<84.4 ng/ml ELISA AG 15 0 75 54 Cohort 55
Cai-yun He, 2011, China[34]
1,556 466 PGIFF1E8.25
ng/ml
ELISA AG 1099 136 457 330 Cohort 53.16
Diana Aulia, 2009, Indonesia
[35]
26 37 PGI<119 ng/ml ELISA AG 18 18 8 19
Case-control
47.6
Metin Agkoc, 2010, Turkey[31]
30 30 PGI<25 ng/ml and PGI: PGII<3.0
RIA AG 27 0 3 30
Case-control
32.86
summary specificity, summary DLR+, and summary DLR- for studies of AG were 93.67%
(95% CI: 91.58–95.76%), 97.57% (95% CI: 96.98–98.17%), 93.82% (95% CI: 93.82–96.69%),
and 96.57% (95% CI: 95.63–97.51%), respectively. The results indicated high heterogeneity in
the sampled studies. Therefore, a random-effects model was performed. The resulting
sum-mary sensitivity, sumsum-mary specificity, sumsum-mary DLR+, and sumsum-mary DLR- for studies of GC
were 0.69 (95% CI: 0.60–0.76), 0.73 (95% CI: 0.62–0.82), 2.57 (95% CI: 1.82–3.62), and 0.43
(95% CI: 0.34–0.54) (Fig 3), respectively. The resulting summary sensitivity, summary
specific-ity, summary DLR+, and summary DLR- for studies of AG were 0.69 (95% CI: 0.55–0.80), 0.88
(95% CI: 0.77–0.94), 5.80 (95% CI: 3.06–10.99), and 0.35 (95% CI: 0.24–0.51) (Fig 4),
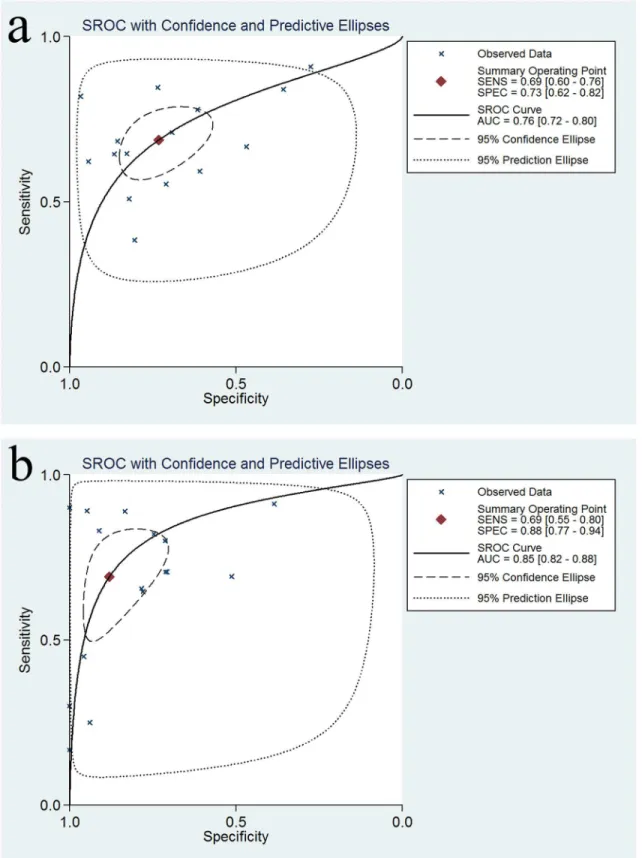
respec-tively. The SROC graphs with a 95% confidence region and a 95% prediction region are
pre-sented in
Fig 5
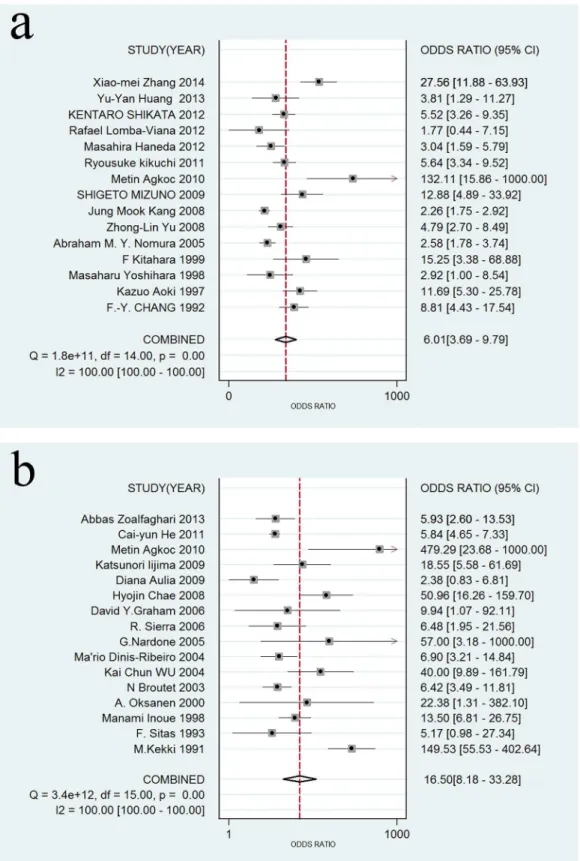
and the forest plots of DOR are presented in
Fig 6. For GC, the AUC was 0.76
(95% CI: 0.72–0.80), and the DOR was 6.01 (95% CI: 3.69–9.79). For AG, the AUC was 0.85
(95% CI: 0.82–0.88), and the DOR was 16.50 (95% CI: 8.18–33.28). In our study, we performed
Spearman’s correlation analysis to explore possible threshold effects. Spearman’s correlation
coefficient for GC was 0.486 (P = 0.066), and Spearman’s correlation coefficient for AG was
Table 1. (Continued) Author/year/ region Patients (n) Control (n) Cut-off SPG detection method Pathological type TP (n) FP (n) FN (n)
TN (n) Design Mean age of patients
(years)*
Katsunori Iijima, 2009, Japan[36]
20 142 PGI70 ng/ml
and PGI: PGII2.0
ELISA AG 9 6 11 136 Cohort 55
Hyojin Chae, 2008, Korea[37]
59 67 PGI:PGII<4.0 L-TIA AG 49 6 10 61 Cohort 50.8
R. Sierra, 2006, Costa Rica[38]
34 400 PGI:PGII<3.4 ELISA AG 31 246 3 154 Cohort 46
Ma ´rio Dinis-Ribeiro, 2004,
Portugal[39]
61 74 PGI:PGII<3.05 ELISA AG with IM 40 16 21 58 Cohort 61
Kai Chun WU, 2004, China[40]
27 54 PGI:PGII<8.1 ELISA AG 24 9 3 45 Cohort 64.8
N Broutet, 2003, Finland[41]
62 222 PGI:PGII<5.6 RIA AG 40 49 22 173 Cohort 43.5
Abbas Zoalfaghari, 2013, Iran [42]
51 59 PGI:PGII<4.0 ELISA AG 36 17 15 42 Cohort 51.4
David Y Graham, 2006 Mexico [12]
5 122 PGI:PGII<6.7 ELISA AG 4 35 1 87 Cohort NR
M. Kekki, 1991, Finland [43]
46 654 PGI<30 ng/ml RIA AG 41 34 5 620 Cohort 47
G. Nardone, 2005, Italy [44]
30 64 PGI:PGII<3.0 ELISA AG 9 0 21 64 Cohort 56
Manami Inoue, 1998, japan [45]
117 83 PGI70 ng/ml
and PGI: PGII3.0
RIA AG 96 21 21 62 Cohort 60.5
F. Sitas, Netherlands,
1993 [46]
28 33 PGI:PGII<1.5 ELISA AG 7 2 21 31
Case-control
47.4
Note: RIA, radio-immunity assay; ELISA, enzyme-linked immunosorbent assay; CLIA, chemiluminescent immunoassay; L-TIA, latex-enhanced turbidimetric immunoassay; NR, no report.
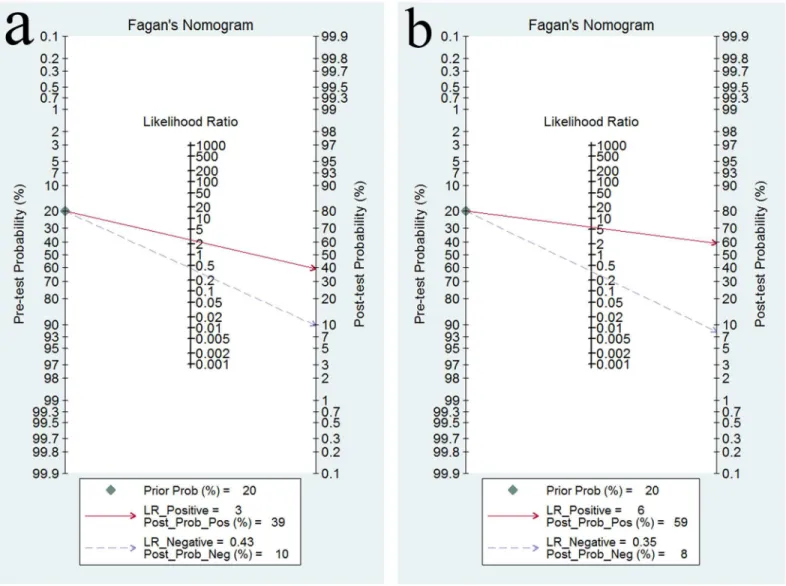
0.362 (P = 0.169), indicating no threshold effects. To assess the clinical utility of the index test,
a Fagan’s nomogram was generated to compare the prior and posterior probabilities (Fig 7).
For GC, when a prior probability of 20% was specified, the posterior probability positivity
increased to 39%, with a DLR+ of 3.00. In addition, the posterior probability negativity
decreased to 10.00%, with a DLR- of 0.43. A similar result was observed in AG diagnosis: when
a prior probability of 20% was specified, the posterior probability positivity increased to 59%,
with a DLR+ of 6.00, and the posterior probability negativity decreased to 8.00%, with a
DLR-of 0.35. These findings suggest a moderate value for SPG in the diagnosis DLR-of GC and AG.
Meta-regression and subgroup analysis
To explore the potential sources of inter-study heterogeneity, a meta-regression was performed
for both GC and AG. The results indicated that the scale of the included patients could
repre-sent a potential source of heterogeneity for GC diagnosis (P = 0.0080), whereas the study
design (P = 0.0295), SPG detection method (P = 0.0343) and measurement of SPG (P = 0.0334)
were the major sources of heterogeneity for the SPG assay in AG detection. Consequently, we
performed subgroup analyses, as shown in
Table 2
and
Table 3. For GC, the results indicated
Fig 2. Quality assessment of the included studies using Quality Assessment of Diagnostic Accuracy Studies-2 (QUADAS-2) criteria.(a) Risk of bias and applicability concerns graph: review authors’judgements about each domain presented as percentages across the included studies for GC; (b) Risk of bias and applicability concerns summary: review authors’judgements about each domain for each included study for GC; (c) Risk of bias and applicability concerns graph: review authors’judgements about each domain presented as percentages across the included studies for AG; (d) Risk of bias and applicability concerns summary: review authors’judgements about each domain for each included study for AG.
that studies with less than 50 patients exhibited an increased diagnostic accuracy of SPG
detec-tion compared with studies with greater than 50 patients. Similar findings were obtained in
subgroups with the following characteristics: the use of ELISA method, the use of combination
of concentration of PGI and the ratio of PGI:PGII as measurement of SPG, studies with
appro-priate interval between standard and index test, case-control design and studies not containing
clearly defined inclusion and exclusion criteria. A latex-enhanced turbidimetric immunoassay
(L-TIA) was commonly used to quantify serum proteins[47], and Huang M et al. established
the use of reference intervals (RIs) for SPG in a healthy Chinese population using L-TIA[48].
We did not identify a sufficient number of studies to evaluate the diagnostic accuracy of the
L-TIA test; therefore, we did not include the L-TIA in our subgroup analysis for GC. For AG,
the diagnostic accuracy of SPG testing was higher in studies using combination of
concentra-tion of PGI and the ratio of PGI:PGII as the measurement of SPG than in studies with other
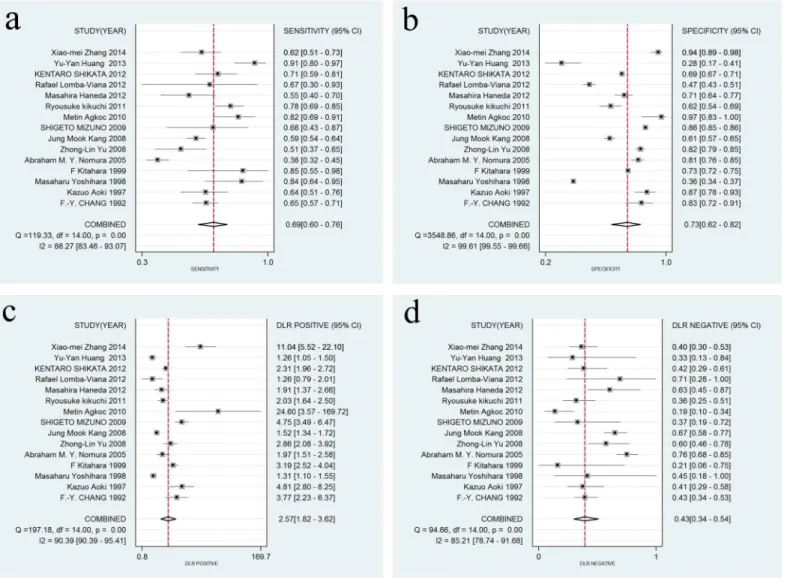
Fig 3. Forest plots of sensitivity, specificity, DLR+, and DLR- for SPG detection in GC.(a) The summary sensitivity was 0.69 (95% CI: 0.60–0.76; I2 = 88.27%; n = 15); (b) The summary specificity of all articles was 0.73 (95% CI: 0.62–0.82; I2 = 99.61%; n = 15); (c) The summary DLR+ of all articles was 2.57 (95% CI: 1.82–3.62; I2 = 90.39%; n = 15); (d) The summary DLR- of all articles was 0.43 (95% CI: 0.34–0.54; I2 = 85.21% n = 15).
measurements of SPG. Similar findings were also found in studies with cohort design, unclearly
defined inclusion and exclusion criteria and the use of RIA method. The summary diagnostic
accuracies of studies with the use of L-TIA method or concentration of PGII as measurement
of SPG were not calculated because of an insufficient number of studies.
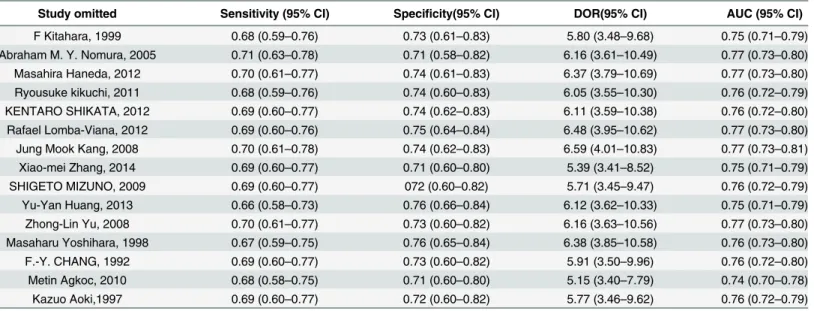
Sensitivity analysis
We performed a sensitivity analysis to evaluate the effects of each individual study on the
sum-mary accuracy of SPG detection for GC and AG, as shown in
Table 4
and
Table 5. After each
study was separately removed, the summary sensitivity, specificity, DOR and AUC ranges with
95% CIs were calculated. We found a relatively stable diagnostic accuracy of SPG detection for
GC and AG in each group.
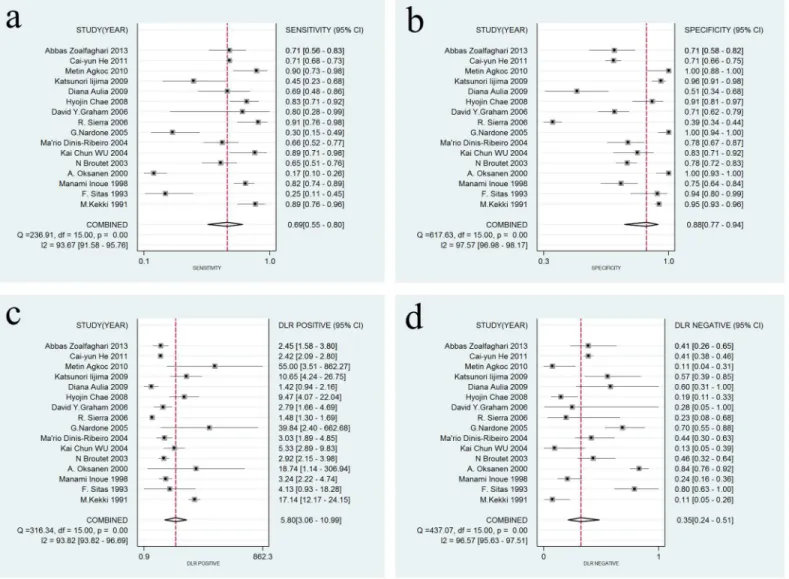
Fig 4. Forest plots of sensitivity, specificity, DLR+, and DLR- for SPG detection in AG.(a) The summary sensitivity was 0.69 (95% CI: 0.55–0.80; I2 = 93.67%; n = 16); (b) The summary specificity of all articles was 0.88 (95% CI: 0.77–0.94; I2 = 97.57%; n = 16); (c) The summary DLR+ of all articles was 5.80 (95% CI: 3.06–10.99; I2 = 93.82%; n = 16); (d) The summary DLR- of all articles was 0.35 (95% CI: 0.24–0.51; I2 = 96.57% n = 16).
Fig 5. Summary ROC curve (SROC) with 95% confidence region and 95% prediction region.(a) SROC for SPG in the diagnosis of GC; (b) SROC for SPG in the diagnosis of AG.
Fig 6. Forest plots of DOR for SPG detection in GC and AG.(a) For GC detection, the DOR was 6.01 (95% CI: 3.69–9.79); (b) For AG detection, the DOR was 16.50 (95% CI: 8.18–33.28).
Publication bias
To analyze the publication bias of the included studies, Begg’s funnel plot was constructed. As
shown in
Fig 8, the P value was 0.002 for GC and
<
0.001 for AG, indicating potential
publica-tion bias among the studies.
Discussion
GC was the world’s third leading cause of cancer mortality in 2012 and was responsible for
723,100 deaths [49,
50]. Korea, Japan, and China are among the areas with increased risk of
GC[51]. Despite the decreased incidence rate of GC observed around the world, its prognosis
remains poor. To effectively improve the survival rate of GC, improved large-scale screening
tools for earlier diagnosis of GC and the identification of people at high risk for GC must be
developed. Precancerous lesions of GC include AG, IM, and dysplasia, and it has been
esti-mated that 0%–1.8%, 0%–10%, and 0%–73% of patients with AG, IM, and dysplasia,
respec-tively, progress to GC annually[52]. Several noninvasive tests, including photofluorography,
serum levels of PGI and PGII and
H
.
pylori
serology, are performed to screen for GC or
precan-cerous lesions of GC. However, photofluorography has several disadvantages, such as X-ray
exposure for individuals who are screened and low sensitivity in detecting early GC [10].
H
.
pylori
serology is also not advantageous as a single screening modality because of its low
speci-ficity in distinguishing precancerous lesions [53]. SPG is a biomarker used to identify AG, and
its potential utility in the diagnosis of GC has been demonstrated by numerous studies.
Subse-quently, cancer screening programs in Japan have accepted the measurement of SPG as a
non-invasive screening test of GC. The measurement of SPG may detect AG or IM in a nonnon-invasive
manner, which is helpful to reduce the related morbidity and mortality of GC. In addition, the
cost for the detection of a single cancer case by SPG is much less than that for conventional
screening ($37,360 by conventional screening vs. $19,282 by SPG testing)[14]. However, only a
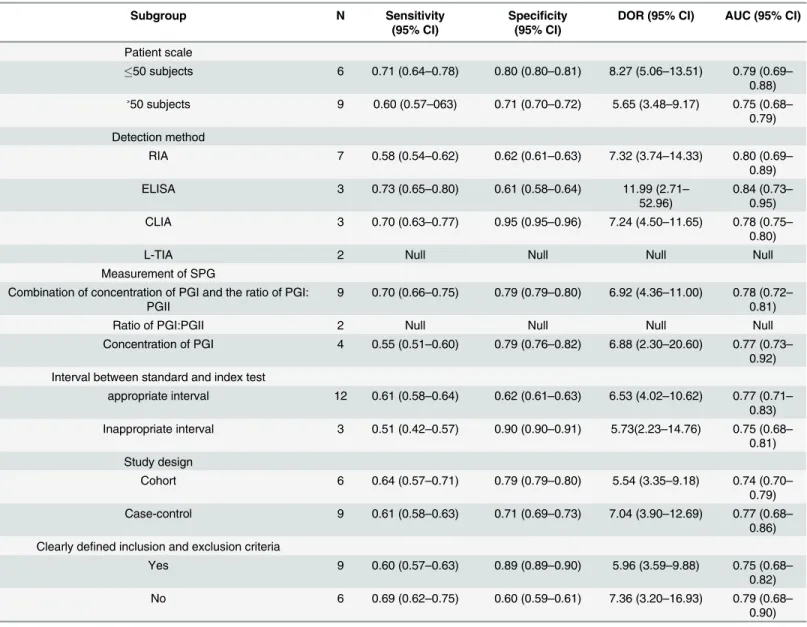
Table 2. Subgroup analysis of the included studies for GC.
Subgroup N Sensitivity
(95% CI)
Specificity (95% CI)
DOR (95% CI) AUC (95% CI)
Patient scale
50 subjects 6 0.71 (0.64–0.78) 0.80 (0.80–0.81) 8.27 (5.06–13.51) 0.79 (0.69–
0.88)
˃50 subjects 9 0.60 (0.57–063) 0.71 (0.70–0.72) 5.65 (3.48–9.17) 0.75 (0.68–
0.79) Detection method
RIA 7 0.58 (0.54–0.62) 0.62 (0.61–0.63) 7.32 (3.74–14.33) 0.80 (0.69–
0.89)
ELISA 3 0.73 (0.65–0.80) 0.61 (0.58–0.64) 11.99 (2.71–
52.96)
0.84 (0.73– 0.95)
CLIA 3 0.70 (0.63–0.77) 0.95 (0.95–0.96) 7.24 (4.50–11.65) 0.78 (0.75–
0.80)
L-TIA 2 Null Null Null Null
Measurement of SPG
Combination of concentration of PGI and the ratio of PGI: PGII
9 0.70 (0.66–0.75) 0.79 (0.79–0.80) 6.92 (4.36–11.00) 0.78 (0.72– 0.81)
Ratio of PGI:PGII 2 Null Null Null Null
Concentration of PGI 4 0.55 (0.51–0.60) 0.79 (0.76–0.82) 6.88 (2.30–20.60) 0.77 (0.73– 0.92) Interval between standard and index test
appropriate interval 12 0.61 (0.58–0.64) 0.62 (0.61–0.63) 6.53 (4.02–10.62) 0.77 (0.71– 0.83) Inappropriate interval 3 0.51 (0.42–0.57) 0.90 (0.90–0.91) 5.73(2.23–14.76) 0.75 (0.68–
0.81) Study design
Cohort 6 0.64 (0.57–0.71) 0.79 (0.79–0.80) 5.54 (3.35–9.18) 0.74 (0.70– 0.79) Case-control 9 0.61 (0.58–0.63) 0.71 (0.69–0.73) 7.04 (3.90–12.69) 0.77 (0.68–
0.86) Clearly defined inclusion and exclusion criteria
Yes 9 0.60 (0.57–0.63) 0.89 (0.89–0.90) 5.96 (3.59–9.88) 0.75 (0.68–
0.82)
No 6 0.69 (0.62–0.75) 0.60 (0.59–0.61) 7.36 (3.20–16.93) 0.79 (0.68–
Table 3. Subgroup analysis of the included studies for AG.
Subgroup N Sensitivity
(95% CI)
Specificity (95% CI)
DOR (95% CI) AUC (95% CI)
Measurement of SPG
Ratio of PGI:PGII 9 0.69 (0.52–0.83) 0.84 (0.68–0.93) 11.51 (6.14–21.56) 0.83 (0.80– 0.86) Combination of concentration of PGI and the ratio of PGI:
PGII
3 0.79 (0.72–0.85) 0.89 (0.85–0.93) 24.64 (6.95–87.37) 0.87 (0.81– 0.92)
Concentration of PGI 3 0.46 (0.38–0.54) 0.93 (0.91–0.95) 19.86 (0.86–
456.91)
0.86 (0.52– 1.00)
Concentration of PGII 1 Null Null Null Null
Detection method
ELISA 11 0.67 (0.65–0.69) 0.68 (0.65–0.70) 7.51 (4.96–11.37) 0.77 (0.75– 0.80)
RIA 4 0.80 (0.75–0.85) 0.89 (0.87–0.91) 35.01 (7.31–
167.66)
0.86 (0.69– 0.96)
L-TIA 1 Null Null Null Null
Study design
Cohort 13 0.69 (0.67–0.71) 0.77 (0.75–0.78) 14.69 (8.33–25.91) 0.85 (0.80–
0.91)
Case-control 3 0.62 (0.51–0.71) 0.80 (0.71–0.87) 12.40 (1.02–
150.57)
0.82 (0.52– 1.00) Clearly defined inclusion and exclusion criteria
Yes 10 0.69 (0.64–0.73) 0.67 (0.64–0.70) 8.77 (5.35–14.38) 0.81 (0.75–
0.87)
No 6 0.69 (0.67–0.71) 0.86 (0.84–0.88) 30.35 (8.12–
113.43)
0.90 (0.79– 0.96) Note: AUC, area under the summary receiver operating characteristic curve; DOR, diagnostic odds ratio; RIA, radio-immunity assay; ELISA, enzyme-linked immunosorbent assay; L-TIA, latex-enhanced turbidimetric immunoassay; CI, confidence interval
doi:10.1371/journal.pone.0142080.t003
Table 4. Sensitivity analyses for the diagnostic accuracy of SPG for GC.
Study omitted Sensitivity (95% CI) Specificity(95% CI) DOR(95% CI) AUC (95% CI)
F Kitahara, 1999 0.68 (0.59–0.76) 0.73 (0.61–0.83) 5.80 (3.48–9.68) 0.75 (0.71–0.79)
Abraham M. Y. Nomura, 2005 0.71 (0.63–0.78) 0.71 (0.58–0.82) 6.16 (3.61–10.49) 0.77 (0.73–0.80)
Masahira Haneda, 2012 0.70 (0.61–0.77) 0.74 (0.61–0.83) 6.37 (3.79–10.69) 0.77 (0.73–0.80) Ryousuke kikuchi, 2011 0.68 (0.59–0.76) 0.74 (0.60–0.83) 6.05 (3.55–10.30) 0.76 (0.72–0.79) KENTARO SHIKATA, 2012 0.69 (0.60–0.77) 0.74 (0.62–0.83) 6.11 (3.59–10.38) 0.76 (0.72–0.80)
Rafael Lomba-Viana, 2012 0.69 (0.60–0.76) 0.75 (0.64–0.84) 6.48 (3.95–10.62) 0.77 (0.73–0.80)
Jung Mook Kang, 2008 0.70 (0.61–0.78) 0.74 (0.62–0.83) 6.59 (4.01–10.83) 0.77 (0.73–0.81) Xiao-mei Zhang, 2014 0.69 (0.60–0.77) 0.71 (0.60–0.80) 5.39 (3.41–8.52) 0.75 (0.71–0.79)
SHIGETO MIZUNO, 2009 0.69 (0.60–0.77) 072 (0.60–0.82) 5.71 (3.45–9.47) 0.76 (0.72–0.79)
Yu-Yan Huang, 2013 0.66 (0.58–0.73) 0.76 (0.66–0.84) 6.12 (3.62–10.33) 0.75 (0.71–0.79)
Zhong-Lin Yu, 2008 0.70 (0.61–0.77) 0.73 (0.60–0.82) 6.16 (3.63–10.56) 0.77 (0.73–0.80) Masaharu Yoshihara, 1998 0.67 (0.59–0.75) 0.76 (0.65–0.84) 6.38 (3.85–10.58) 0.76 (0.73–0.80)
F.-Y. CHANG, 1992 0.69 (0.60–0.77) 0.73 (0.60–0.82) 5.91 (3.50–9.96) 0.76 (0.72–0.80)
Metin Agkoc, 2010 0.68 (0.58–0.75) 0.71 (0.60–0.80) 5.15 (3.40–7.79) 0.74 (0.70–0.78)
Kazuo Aoki,1997 0.69 (0.60–0.77) 0.72 (0.60–0.82) 5.77 (3.46–9.62) 0.76 (0.72–0.79)
few meta-analyses on the accuracy of SPG for predicting GC or precancerous lesions of GC are
available. Our study performed a meta-analysis to clarify the diagnostic value of SPG.
The present study, including a total of 3,785 patients, identified a moderate capacity for
SPG to detect GC and AG; the summary sensitivity and summary specificity for GC diagnosis
were 0.69 (95% CI: 0.60–0.76) and 0.73 (95% CI: 0.62–0.82), respectively. Concurrently, the
summary sensitivity and summary specificity for AG diagnosis were 0.69 (95% CI: 0.55–0.80)
and 0.88 (95% CI: 0.77–0.94), respectively. The AUC values were calculated to evaluate the
dis-criminating ability of this diagnostic method[54]. DOR combines sensitivity and specificity to
assess diagnostic accuracy. The AUC and DOR of the SPG test for GC diagnosis were 0.76
(95% CI: 0.72–0.80) and 6.01 (95% CI: 3.69–9.79), respectively. For AG, the AUC and DOR
were 0.85 (95% CI: 0.82–0.88) and 16.50 (95% CI: 8.18–33.28), respectively. A Fagan plot
indi-cated that the use of SPG could moderately improve the GC and AG detection rate, confirming
a moderate efficiency of SPG detection in GC and AG diagnosis. Nevertheless, we believe that
SPG detection has a potentially significant role in GC mass screening, especially in the
identifi-cation of populations at high risk for GC [25]. The study conducted by Jennifer M Yeh and
col-leagues suggested that targeting high-risk smokers for SPG screening might be a cost-effective
strategy to reduce intestinal-type non-cardia GC mortality [55]. If combined with an additional
GC screening method, such as serum MG7-Ag, serum gastrin-17, serum ghrelin and serum
tre-foil factor family 3 (TFF-3), the efficiency of GC screening could be improved. The
combina-tion of serum IgG anti-
H
.
pylori
antibody, gastrin, PG I and PG II was identified to be useful
for predicting the presence of GC[56]. Susumu Aikou et al demonstrated that serum TFF-3
could be an effective marker of GC with sensitivity of 80.9% and specificity of 81.0%, while the
combination of serum TFF-3 and SPG statistical significantly improved tumor detection as
compared to TFF3 or SPG alone[57]. Zhigang Huang and colleagues also suggested that the
combined testing of serum TFF-3 and SPG could farther improve the efficacy of GC screening
[58]. In addition, Combinations of SPG, gastrin-17 and
H
.
pylori
antibody can also identify AG
more effectively [59,
60]. The plasma levels of ghrelin was indicated to be correlated well with
Table 5. Sensitivity analyses for the diagnostic accuracy of SPG for AG.
Study omitted Sensitivity (95% CI) Specificity (95% CI) DOR (95% CI) AUC (95% CI)
Manami Inoue,1998 0.68 (0.53–0.80) 0.90 (0.77–0.95) 17.00 (7.88–36.70) 0.85 (0.82–0.88)
F. Sitas, 1993 0.72 (0.59–0.82) 0.88 (0.75–0.95) 17.89 (8.47–37.79) 0.86 (0.82–0.88)
A. Oksanen, 2000 0.73 (0.61–0.82) 0.86 (0.74–0.92) 15.94 (7.70–31.37) 0.85 (0.82–0.88) Cai-yun He, 2011 0.69 (0.54–0.81) 0.89 (0.77–0.95) 18.27 (8.61–38.76) 0.86 (0.83–0.89)
Diana Aulia, 2009 0.69 (0.54–0.81) 0.89 (0.79–0.95) 18.68 (9.26–37.69) 0.87 (0.83–0.89)
Metin Agkoc, 2010 0.67 (0.53–0.79) 0.87 (0.75–0.94) 13.56 (7.33–25.08) 0.84 (0.80–0.87) Katsunori Iijima, 2009 0.71 (0.56–0.82) 0.87 (0.74–0.94) 16.42 (7.70–35.03) 0.86 (0.82–0.88) Hyojin Chae, 2008 0.68 (0.53–0.80) 0.88 (0.75–0.95) 15.25 (7.36–31.61) 0.85 (0.81–0.87)
R. Sierra, 2006 0.67 (0.53–0.78) 0.90 (0.80–0.95) 17.32 (8.31–36.12) 0.86 (0.83–0.89)
Ma ´rio Dinis-Ribeiro, 2004 0.69 (0.55–0.81) 0.89 (0.77–0.95) 18.00 (8.42–38.47) 0.86 (0.83–0.89) Kai Chun WU, 2004 0.67 (0.53–0.79) 0.89 (0.76–0.95) 15.88 (7.32–33.52) 0.84 (0.81–0.87) N Broutet, 2003 0.70 (0.55–0.81) 0.89 (0.77–0.95) 18.17 (8.52–38.76) 0.86 (0.83–0.89)
Abbas Zoalfaghari, 2013 0.69 (0.54–0.81) 0.89 (0.77–0.95) 18.07 (8.51–38.34) 0.86 (0.83–0.89)
David Y Graham, 2006 0.68 (0.54–0.80) 0.89 (0.77–0.95) 17.43 (8.24–36.86) 0.86 (0.82–0.88)
M. Kekki, 1991 0.67 (0.53–0.79) 0.87 (0.74–0.94) 13.55 (7.14–25.74) 0.84 (0.80–0.86)
G. Nardone, 2005 0.71 (0.58–0.82) 0.86 (0.74–0.92) 14.75 (7.39–29.46) 0.85 (0.82–0.88) Note: AUC, area under the summary receiver operating characteristic curve; DOR, diagnostic odds ratio; CI, confidence interval.
the serum levels of PGI as well as the PGI/II ratio in AG patients, suggesting that it could be an
intriguing non-invasive marker for AG[61]. Inverse associations between ghrelin and GC was
observed, suggesting a potential role for serum ghrelin as a biomarker of GC [62]. Based on the
rapidly growing research area of proteomics, promising serum GC and AG biomarkers will
hopefully be developed in the near future[63]. These studies may provoke more detailed
inves-tigations leading to identification of a panel of diagnostic serological markers applicable to GC
surveillance programmes.
Substantial heterogeneity was noted in the interpretation of the results of the 11 included
studies for GC: (1) Potential sources of heterogeneity derived from the different scales used for
the patients were explored by meta-regression. Some studies focused on the screening value of
SPG detection for GC, leading to the inclusion of fewer patients and more controls, whereas
others focused on confirming the diagnostic value of SPG detection. Studies with smaller
num-bers of patients may have found a lower reliability of SPG as a diagnostic test. (2) 3 studies did
not exhibit an appropriate interval between the reference standard and the index test. In this
setting, if SPG was detected long before endoscopy, the patient's condition would progress. If
patients with positive SPG detection received special treatment before undergoing endoscopy
and biopsy, this condition might have interfered with the diagnostic test results. The unclear
interval between SPG detection and endoscopic biopsy potentially constitutes a source of
het-erogeneity. (3) Two of the 15 included studies exclusively enrolled early GC patients, and the
SPG concentrations of early GC patients might differ from those of advanced GC patients, thus
constituting another potential source of heterogeneity. (4) Seven of the 15 included studies
used RIA to detect SPG, 3 used ELISA, 3 used CLIA, and only 2 used L-TIA. These different
detection methods could have generated different normal ranges and cut-off values of SPG.
Although the present study indicated that SPG detection using ELISA exhibited an increased
diagnostic accuracy, this difference might induce potential heterogeneity. For AG diagnosis,
the study design, SPG detection method and measurement of SPG constitute significant
sources of heterogeneity among the studies. Thirteen of 16 studies had cohort design, whereas
3 had case-control design. The different study designs may influence the diagnostic accuracy.
Eleven of the 16 studies used ELISA to detect SPG, whereas 4 used RIA, and 1 used L-TIA. An
excellent correlation was observed between ELISA and RIA for SPG detection[64], but the
dif-ferent methods yielded difdif-ferent cut-off values, which led to difdif-ferent diagnostic accuracies.
Nine studies used the ratio of PGI:PGII as the measurement of SPG, 3 used both the
concentra-tion of PGI and the ratio of PGI:PGII, 3 used the concentraconcentra-tion of PGI, and 1 used the
concen-tration of PGII. PGI
<
70 ng/ml and PGI:PGII
<
3.0 are widely accepted as the cut-off points for
GC screening in Japan[19], but the ratio of PGI:PGII has mostly been used in AG diagnosis.
Several potential limitations of the present study must be acknowledged. First, although a
serum PGI concentration of
<
70 ng/ml and a PGI:II ratio of
<
3.0 have been widely accepted as
be different from patients with gastric non-cardia cancer. Due to the absence of sufficient data
about subtypes of GC, the assessment of diagnostic value of SPG for GC detection is limited. In
addition, serum levels of PGI and the ratio of PGI:II decreased more significantly in AG
patients with IM than in AG patients without IM.
H
.
pylori
infection status can also affect the
concentration of SPG in AG patients and GC patients. These unrecorded differences in the
patients of the selected studies potentially contributed to the observed heterogeneity[65].
Because these details were not available, our ability to explore the source of heterogeneity was
restricted. However, a more homogeneous analysis may have resulted in selection bias. Third,
potential publication bias was observed among the included studies, suggesting that the
diag-nostic value of SPG in both GC and AG detection may be overestimated because of selective
reporting. Studies with favorable results are more likely to be published. Fourth, some of the
studies had a case-control design, which may be prone to overstating the accuracy of a
diagnos-tic trial [66]. Fifth, even though increasing the detection rate of early GC could improve the
overall prognosis[67], only 2 studies in the present analysis focused on the early detection of
GC. There is a great need to conduct clinical trials to better identify the validity of SPG in the
early detection of GC in the future. Sixth, most of the included studies for GC were based in
Asian countries; only two eligible studies originated in Europe. This geographically limited
dis-tribution could also introduce sampling bias in GC diagnosis. It remains urgent to validate
whether the value of SPG detection for GC screening applies to different populations
worldwide.
In conclusion, SPG has the potential to play an important role in the identification of
patients with AG, which are precancerous lesions of GC. SPG also constitutes a crucial
compo-nent in GC screening for the susceptible population, although this biomarker only exhibits a
moderate diagnostic value for identifying GC. Given the limitations and heterogeneity of the
chosen studies, large-scale and well-designed prospective studies should be conducted to
vali-date the clinical value of SPG in GC screening and the diagnosis of precancerous lesions of GC
(AG, IM and dysplasia), especially in European and American
Supporting Information
S1 Checklist. PRISMA 2009 Checklist.
(DOC)
S2 Checklist. QUADAS-2 Checklist.
(PDF)
Author Contributions
Conceived and designed the experiments: J-CY. Performed the experiments: Y-KH. Analyzed
the data: Y-KH S-BT CY. Contributed reagents/materials/analysis tools: W-MK Z-QM XY.
Wrote the paper: Y-KH.
References
1. Wang K, Liang Q, Li X, Tsoi H, Zhang J, Wang H, et al. MDGA2 is a novel tumour suppressor cooperat-ing with DMAP1 in gastric cancer and is associated with disease outcome. Gut. 2015. doi:10.1136/ gutjnl-2015-309276PMID:26206665
2. Correa P, Piazuelo MB, Camargo MC. The future of gastric cancer prevention. Gastric cancer: official journal of the International Gastric Cancer Association and the Japanese Gastric Cancer Association. 2004; 7(1):9–16. doi:10.1007/s10120-003-0265-0PMID:15052434
the Japanese Gastric Cancer Association. 2013; 16(4):498–504. doi:10.1007/s10120-013-0232-3 PMID:23371255
4. Nashimoto A, Nakajima T, Furukawa H, Kitamura M, Kinoshita T, Yamamura Y, et al. Randomized trial of adjuvant chemotherapy with mitomycin, Fluorouracil, and Cytosine arabinoside followed by oral Fluorouracil in serosa-negative gastric cancer: Japan Clinical Oncology Group 9206–1. Journal of clini-cal oncology: official journal of the American Society of Cliniclini-cal Oncology. 2003; 21(12):2282–7. doi: 10.1200/JCO.2003.06.103PMID:12805327
5. Pasechnikov V, Chukov S, Fedorov E, Kikuste I, Leja M. Gastric cancer: Prevention, screening and early diagnosis. World journal of gastroenterology: WJG. 2014; 20(38):13842–62. doi:10.3748/wjg. v20.i38.13842PMID:25320521; PubMed Central PMCID: PMC4194567
6. Shikata K, Ninomiya T, Yonemoto K, Ikeda F, Hata J, Doi Y, et al. Optimal cutoff value of the serum pep-sinogen level for prediction of gastric cancer incidence: the Hisayama Study. Scandinavian journal of gastroenterology. 2012; 47(6):669–75. doi:10.3109/00365521.2012.658855PMID:22428879 7. Choi IJ. Endoscopic gastric cancer screening and surveillance in high-risk groups. Clin Endosc. 2014;
47(6):497–503. doi:10.5946/ce.2014.47.6.497PMID:25505714; PubMed Central PMCID: PMC4260096
8. Samloff IM. Immunologic studies of human group I pepsinogens. Journal of immunology. 1971; 106 (4):962–8. PMID:4396533
9. Nasrollahzadeh D, Aghcheli K, Sotoudeh M, Shakeri R, Persson EC, Islami F, et al. Accuracy and cut-off values of pepsinogens I, II and gastrin 17 for diagnosis of gastric fundic atrophy: influence of gastri-tis. PloS one. 2011; 6(10):e26957. doi:10.1371/journal.pone.0026957PMID:22066020; PubMed Cen-tral PMCID: PMC3204997
10. Miki K, Urita Y. Using serum pepsinogens wisely in a clinical practice. J Dig Dis. 2007; 8(1):8–14. doi: 10.1111/j.1443-9573.2007.00278.xPMID:WOS:000256831800002
11. Samloff IM, Varis K, Ihamaki T, Siurala M, Rotter JI. Relationships among serum pepsinogen I, serum pepsinogen II, and gastric mucosal histology. A study in relatives of patients with pernicious anemia. Gastroenterology. 1982; 83(1 Pt 2):204–9. Epub 1982/07/01. PMID:7084603
12. Graham DY, Nurgalieva ZZ, El-Zimaity HM, Opekun AR, Campos A, Guerrero L, et al. Noninvasive ver-sus histologic detection of gastric atrophy in a Hispanic population in North America. Clin Gastroenterol Hepatol. 2006; 4(3):306–14. doi:10.1016/j.cgh.2005.11.003PMID:16527693
13. Correa P. Human gastric carcinogenesis: a multistep and multifactorial process—First American Can-cer Society Award Lecture on CanCan-cer Epidemiology and Prevention. CanCan-cer Res. 1992; 52(24):6735– 40. PMID:1458460
14. Mukoubayashi C, Yanaoka K, Ohata H, Arii K, Tamai H, Oka M, et al. Serum pepsinogen and gastric cancer screening. Intern Med. 2007; 46(6):261–6. PMID:17379991
15. Zeng Z, Fu S, Hu P, Zhao L, Zhang H, Tang X, et al. The diagnostic value of monoclonal gastric cancer 7 antigen: a systematic review with meta-analysis. Clinical and experimental medicine. 2014; 14 (3):337–43. doi:10.1007/s10238-013-0246-5PMID:23797567
16. Du Y, Li J, He F, Lv Y, Liu W, Wu P, et al. The diagnosis accuracy of PLA2R-AB in the diagnosis of idio-pathic membranous nephropathy: a meta-analysis. PloS one. 2014; 9(8):e104936. doi:10.1371/ journal.pone.0104936PMID:25136841; PubMed Central PMCID: PMC4138154
17. Bowden J, Tierney JF, Copas AJ, Burdett S. Quantifying, displaying and accounting for heterogeneity in the meta-analysis of RCTs using standard and generalised Q statistics. BMC medical research meth-odology. 2011; 11:41. doi:10.1186/1471-2288-11-41PMID:21473747; PubMed Central PMCID: PMC3102034
18. Zamora J, Abraira V, Muriel A, Khan K, Coomarasamy A. Meta-DiSc: a software for meta-analysis of test accuracy data. BMC medical research methodology. 2006; 6:31. doi:10.1186/1471-2288-6-31 PMID:16836745; PubMed Central PMCID: PMC1552081
19. Kitahara F, Kobayashi K, Sato T, Kojima Y, Araki T, Fujino MA. Accuracy of screening for gastric cancer using serum pepsinogen concentrations. Gut. 1999; 44(5):693–7. Epub 1999/04/16. PMID:10205207; PubMed Central PMCID: PMCPMC1727514
20. Nomura AM, Kolonel LN, Miki K, Stemmermann GN, Wilkens LR, Goodman MT, et al. Helicobacter pylori, pepsinogen, and gastric adenocarcinoma in Hawaii. The Journal of infectious diseases. 2005; 191(12):2075–81. doi:10.1086/430353PMID:15897993
22. Kikuchi R, Abe Y, Iijima K, Koike T, Ara N, Uno K, et al. Low serum levels of pepsinogen and gastrin 17 are predictive of extensive gastric atrophy with high-risk of early gastric cancer. The Tohoku journal of experimental medicine. 2011; 223(1):35–44. PMID:21222340
23. Lomba-Viana R, Dinis-Ribeiro M, Fonseca F, Vieira AS, Bento MJ, Lomba-Viana H. Serum pepsinogen test for early detection of gastric cancer in a European country. European journal of gastroenterology & hepatology. 2012; 24(1):37–41. doi:10.1097/MEG.0b013e32834d0a0aPMID:21989121
24. Kang JM, Kim N, Yoo JY, Park YS, Lee DH, Kim HY, et al. The role of serum pepsinogen and gastrin test for the detection of gastric cancer in Korea. Helicobacter. 2008; 13(2):146–56. doi: 10.1111/j.1523-5378.2008.00592.xPMID:18321304
25. Zhang XM, Li JX, Zhang GY, Li XH, Gu H. The value of serum pepsinogen levels for the diagnosis of gastric diseases in Chinese Han people in midsouth China. BMC gastroenterology. 2014; 14:3. Epub 2014/01/05. doi:10.1186/1471-230x-14-3PMID:24383519; PubMed Central PMCID:
PMCPMC3893538
26. Mizuno S, Kobayashi M, Tomita S, Miki I, Masuda A, Onoyama M, et al. Validation of the pepsinogen test method for gastric cancer screening using a follow-up study. Gastric cancer: official journal of the International Gastric Cancer Association and the Japanese Gastric Cancer Association. 2009; 12 (3):158–63. Epub 2009/11/06. doi:10.1007/s10120-009-0522-yPMID:19890696
27. Huang YY, Cheng WC, Gao N, Ye N, Qian YT. The diagnostic value of serum pepsinogenⅠ,Ⅱfor gastric cancer and precancerous lesions of gastric cancer detection. Chinese Journal of Internal Medicine. 2013; 52(4):332–3. doi:10.3760/cma.j.issn.0578-1426.2013.04.017
28. Yu ZL, Ji M, Yang X, Zhang PT, Huang XJ, Zhang ZY, et al. Serum pepsinogen detection in gastric can-cer screening. Chinese journal of digestive endoscopy. 2008; 25(10):512–5. doi:10.3760/cma.j.issn. 1007-5232.2008.10.003
29. Yoshihara M, Sumii K, Haruma K, Kiyohira K, Hattori N, Kitadai Y, et al. Correlation of ratio of serum pepsinogen I and II with prevalence of gastric cancer and adenoma in Japanese subjects. Am J Gastro-enterol. 1998; 93(7):1090–6. doi:10.1111/j.1572-0241.1998.00335.xPMID:9672336
30. Chang FY, Lai KH, Wang TF, Lee SD, Tsai YT, Tsay SH. Location and type of gastric carcinoma in rela-tion to pepsinogen I level in blood. Scandinavian journal of gastroenterology. 1992; 27(10):884–8. PMID:1439542
31. Agkoc M, Dursun H, Albayrak F, Yilmaz O, Kiziltunc A, Yilmaz A, et al. Usefulness of serum pepsinogen levels as a screening test for atrophic gastritis and gastric cancer. Eurasian J Med. 2010; 42(1):15–8. doi:10.5152/eajm.2010.05PMID:25610111; PubMed Central PMCID: PMC4261308
32. Aoki K, Misumi J, Kimura T, Zhao W, Xie T. Evaluation of cutoff levels for screening of gastric cancer using serum pepsinogens and distributions of levels of serum pepsinogen I, II and of PG I/PG II ratios in a gastric cancer case-control study. Journal of epidemiology / Japan Epidemiological Association. 1997; 7(3):143–51. PMID:9337512
33. Oksanen A, Sipponen P, Miettinen A, Sarna S, Rautelin H. Evaluation of blood tests to predict normal gastric mucosa. Scandinavian journal of gastroenterology. 2000; 35(8):791–5. PMID:10994615 34. He CY, Sun LP, Gong YH, Xu Q, Dong NN, Yuan Y. Serum pepsinogen II: a neglected but useful
bio-marker to differentiate between diseased and normal stomachs. Journal of gastroenterology and hepa-tology. 2011; 26(6):1039–46. doi:10.1111/j.1440-1746.2011.06692.xPMID:21303408
35. Aulia D, Manz GO, Simadibrata M. Pepsinogen I concentration in organic dyspepsia patients at Gastro-enterology Division, Department of Internal Medicine, Cipto Mangunkusumo Hospital. Acta Med Indones. 2009; 41(3):107–14. PMID:19752481
36. Iijima K, Abe Y, Kikuchi R, Koike T, Ohara S, Sipponen P, et al. Serum biomarker tests are useful in delineating between patients with gastric atrophy and normal, healthy stomach. World journal of gastro-enterology: WJG. 2009; 15(7):853–9. PMID:19230047; PubMed Central PMCID: PMC2653386 37. Chae H, Lee JH, Lim J, Kim M, Kim Y, Han K, et al. [Clinical utility of serum pepsinogen levels as a
screening test of atrophic gastritis]. Korean J Lab Med. 2008; 28(3):201–6. doi:10.3343/kjlm.2008.28. 3.201PMID:18594172
38. Sierra R, Une C, Ramirez V, Gonzalez MI, Ramirez JA, de Mascarel A, et al. Association of serum pep-sinogen with atrophic body gastritis in Costa Rica. Clinical and experimental medicine. 2006; 6(2):72– 8. doi:10.1007/s10238-006-0098-3PMID:16820994
39. Dinis-Ribeiro M, da Costa-Pereira A, Lopes C, Barbosa J, Guilherme M, Moreira-Dias L, et al. Validity of serum pepsinogen I/II ratio for the diagnosis of gastric epithelial dysplasia and intestinal metaplasia during the follow-up of patients at risk for intestinal-type gastric adenocarcinoma. Neoplasia. 2004; 6 (5):449–56. doi:10.1593/neo.03505PMID:15548353; PubMed Central PMCID: PMC1531649 40. Wu KC, Li HT, Qiao TD, Li CN, Ji WS, Tian FQ, et al. Diagnosis of atrophic body gastritis in Chinese
41. Broutet N, Plebani M, Sakarovitch C, Sipponen P, Megraud F, Eurohepygast Study Group. Pepsinogen A, pepsinogen C, and gastrin as markers of atrophic chronic gastritis in European dyspeptics. Br J Can-cer. 2003; 88(8):1239–47. doi:10.1038/sj.bjc.6600877PMID:12698190; PubMed Central PMCID: PMC2747577
42. Zoalfaghari A, Aletaha N, Roushan N, Taslimi R, Foroutan H, Faridnia B. Accuracy of pepsinogens for early diagnosis of atrophic gastritis and gastric cancer in Iranian population. Med J Islam Repub Iran. 2014; 28:150. PMID:25695008; PubMed Central PMCID: PMC4322333
43. Kekki M, Samloff IM, Varis K, Ihamaki T. Serum pepsinogen I and serum gastrin in the screening of severe atrophic corpus gastritis. Scand J Gastroenterol Suppl. 1991; 186:109–16. PMID:1759117 44. Nardone G, Rocco A, Staibano S, Mezza E, Autiero G, Compare D, et al. Diagnostic accuracy of the
serum profile of gastric mucosa in relation to histological and morphometric diagnosis of atrophy. Ali-ment Pharmacol Ther. 2005; 22(11–12):1139–46. doi:10.1111/j.1365-2036.2005.02734.xPMID: 16305728
45. Inoue M, Kobayashi S, Matsuura A, Hamajima N, Tajima K, Tominaga S. Agreement of endoscopic findings and serum pepsinogen levels as an indicator of atrophic gastritis. Cancer Epidemiol Biomark-ers Prev. 1998; 7(3):261–3. PMID:9521444
46. Sitas F, Smallwood R, Jewell D, Millard PR, Newell DG, Meuwissen SG, et al. Serum anti-Helicobacter pylori IgG antibodies and pepsinogens A and C as serological markers of chronic atrophic gastritis. Cancer Epidemiol Biomarkers Prev. 1993; 2(2):119–23. PMID:8467246
47. Thakkar H, Davey CL, Medcalf EA, Skingle L, Craig AR, Newman DJ, et al. Stabilization of turbidimetric immunoassay by covalent coupling of antibody to latex particles. Clinical chemistry. 1991; 37(7):1248– 51. Epub 1991/07/01. PMID:1855297
48. Huang M, Tang AG, Mu S, Yang JJ, Xiang ZY, Liu B, et al. Serum pepsinogen reference intervals in apparently healthy Chinese population with latex enhanced turbidimetric immunoassay. Journal of clini-cal pathology. 2014; 67(4):350–4. doi:10.1136/jclinpath-2013-201942PMID:24170207
49. Torre LA, Bray F, Siegel RL, Ferlay J, Lortet-Tieulent J, Jemal A. Global cancer statistics, 2012. CA: a cancer journal for clinicians. 2015; 65(2):87–108. doi:10.3322/caac.21262PMID:25651787 50. Huang YK, Yu JC. Circulating microRNAs and long non-coding RNAs in gastric cancer diagnosis: An
update and review. World journal of gastroenterology: WJG. 2015; 21(34):9863–86. doi:10.3748/wjg. v21.i34.9863PMID:26379393; PubMed Central PMCID: PMC4566381
51. Shin HR, Won YJ, Jung KW, Kong HJ, Yim SH, Lee JK, et al. Nationwide cancer incidence in Korea, 1999~2001; first result using the national cancer incidence database. Cancer research and treatment: official journal of Korean Cancer Association. 2005; 37(6):325–31. Epub 2005/12/01. doi:10.4143/crt. 2005.37.6.325PMID:19956367; PubMed Central PMCID: PMCPMC2785938
52. de Vries AC, Haringsma J, Kuipers EJ. The detection, surveillance and treatment of premalignant gas-tric lesions related to Helicobacter pylori infection. Helicobacter. 2007; 12(1):1–15. doi: 10.1111/j.1523-5378.2007.00475.xPMID:17241295
53. Ley C, Mohar A, Guarner J, Herrera-Goepfert R, Figueroa LS, Halperin D, et al. Screening markers for chronic atrophic gastritis in Chiapas, Mexico. Cancer Epidemiol Biomarkers Prev. 2001; 10(2):107–12. PMID:11219766
54. Tian SB, Yu JC, Kang WM, Ma ZQ, Ye X, Cao ZJ, et al. Combined detection of CEA, CA 19–9, CA 242 and CA 50 in the diagnosis and prognosis of resectable gastric cancer. Asian Pacific journal of cancer prevention: APJCP. 2014; 15(15):6295–300. Epub 2014/08/16. PMID:25124614
55. Yeh JM, Hur C, Ward Z, Schrag D, Goldie SJ. Gastric adenocarcinoma screening and prevention in the era of new biomarker and endoscopic technologies: a cost-effectiveness analysis. Gut. 2015. doi:10. 1136/gutjnl-2014-308588PMID:25779597
56. Park CH, Kim EH, Jung DH, Chung H, Park JC, Shin SK, et al. The new modified ABCD method for gas-tric neoplasm screening. Gasgas-tric cancer: official journal of the International Gasgas-tric Cancer Association and the Japanese Gastric Cancer Association. 2015. doi:10.1007/s10120-015-0473-4PMID: 25663259
57. Aikou S, Ohmoto Y, Gunji T, Matsuhashi N, Ohtsu H, Miura H, et al. Tests for serum levels of trefoil fac-tor family proteins can improve gastric cancer screening. Gastroenterology. 2011; 141(3):837–45 e1-7. doi:10.1053/j.gastro.2011.05.040PMID:21699780; PubMed Central PMCID: PMC3163741
58. Huang Z, Zhang X, Lu H, Wu L, Wang D, Zhang Q, et al. Serum trefoil factor 3 is a promising non-inva-sive biomarker for gastric cancer screening: a monocentric cohort study in China. BMC gastroenterol-ogy. 2014; 14:74. doi:10.1186/1471-230X-14-74PMID:24720760; PubMed Central PMCID: PMC4012276
60. McNicholl AG, Forne M, Barrio J, De la Coba C, Gonzalez B, Rivera R, et al. Accuracy of GastroPanel for the diagnosis of atrophic gastritis. European journal of gastroenterology & hepatology. 2014; 26 (9):941–8. doi:10.1097/MEG.0000000000000132PMID:25014624; PubMed Central PMCID: PMC4232299
61. Suzuki H, Masaoka T, Hosoda H, Nomura S, Ohara T, Kangawa K, et al. Plasma ghrelin concentration correlates with the levels of serum pepsinogen I and pepsinogen I/II ratio—a possible novel and non-invasive marker for gastric atrophy. Hepatogastroenterology. 2004; 51(59):1249–54. PMID:15362725 62. Sadjadi A, Yazdanbod A, Lee YY, Boreiri M, Samadi F, Alizadeh BZ, et al. Serum ghrelin; a new surro-gate marker of gastric mucosal alterations in upper gastrointestinal carcinogenesis. PloS one. 2013; 8 (9):e74440. doi:10.1371/journal.pone.0074440PMID:24098650; PubMed Central PMCID:
PMC3787044
63. Penno MA, Klingler-Hoffmann M, Brazzatti JA, Boussioutas A, Putoczki T, Ernst M, et al. 2D-DIGE analysis of sera from transgenic mouse models reveals novel candidate protein biomarkers for human gastric cancer. Journal of proteomics. 2012; 77:40–58. doi:10.1016/j.jprot.2012.07.002PMID: 22789672
64. Pals G, Rasanen V, Meuwissen SG, Frants RR, Kostense PJ, Eriksson AW. Enzyme-linked immuno-sorbent assay and radioimmunoassay of serum pepsinogen A. Scand J Clin Lab Invest. 1987; 47 (1):29–33. PMID:3554488
65. Yang SK, Xiao L, Zhang H, Xu XX, Song PA, Liu FY, et al. Significance of serum procalcitonin as bio-marker for detection of bacterial peritonitis: a systematic review and meta-analysis. BMC infectious dis-eases. 2014; 14:452. Epub 2014/08/26. doi:10.1186/1471-2334-14-452PMID:25145785; PubMed Central PMCID: PMCPMC4155125
66. Leeflang MM. Systematic reviews and meta-analyses of diagnostic test accuracy. Clinical microbiology and infection: the official publication of the European Society of Clinical Microbiology and Infectious Dis-eases. 2014; 20(2):105–13. doi:10.1111/1469-0691.12474PMID:24274632