Comparison of Two SPME Fibers for Differentiation
of Coffee byAnalysis of Volatile Compounds
2001,54,647-652
A. M. Costa Freitas 1. / C. Parreira 2 / L.Vilas-Boas 3
1 Centro de Quimica Fina e Biotecnologia, Departamento de Quimica, Faculdade de Ci6ncias e Tecnologia, Universidade Nova de Lisboa,
2825 Monte da Caparica, Portugal; E-Maih [email protected]
2 Dias de Sousa Lda. Praceta Anibal Faustino, 6 B
2625 P6voa de St. Iria, Portugal
3
InstitutoSuperior T6cnico, Av. Rovisco Pais
1096 Lisboa Codex, Portugal
Key Wards
Gas chromatography
Solid-phase microextraction
Fiber selection
Coffee aroma compounds
Summary
Solid-phase microextraction (SPME)
isbased on the affinity of different headspace compounds
for the coating on a fiber. In the work described in this paperwe evaluated and compared f,,vo
different coatings, a medium polarity coating, Carbowax divinylbenzene (CW-DVB), and an
apolar coating, polydimethylsiloxane (PDMS), for the analysis and classification of coffee. PCA
(principal-component analysis) was used to evaluate the results obtained by use of the l",,vo fi-
bers and, at the same time, to determine their suitability for use for the classification and differ-
entiation of coffee. When PCA
isused as a method of classification, using the 30 major peaks
as variables, the results obtained with the CW-DVB fiber enable classification according to
geographic origin; those obtained with the PDMS fiber enable classification based on variety
(Arabica or Robusta).
Introduction
Solid-phase microextraction was devel- oped in 1989 by Pawliszyn and marketed in 1993 by Supelco [1]. The field of appli- cation has since been expanded. The method is of great relevance for applica- tion to different types of solid, liquid, or gaseous matrix [2 11]. When compared with other extraction techniques SPME has the advantages of being solvent-free; this avoids the need for the tedious and er- ror-prone elimination of the solvent which is characteristic of liquid-liquid and/or so- lid-liquid extraction [12]. In SPME, ana-
lytes are either absorbed or adsorbed by the fiber coating, i. e. the solutes either dis- solve or become partitioned in the bulk of the fiber coating material in the first me- chanism or become bound to the fiber sur- face in the second mechanism. Two condi- tions are combined when using the head- space (HS) technique coupled with SPME sampling and analysis headspace tem- perature and exposure time (the time the fiber is in contact with the headspace) [13]. The key component of SPME techniques is the piece of fused silica fiber (ca 1-cm long) coated with a polymeric stationary phase the characteristics of which influ-
ence the extraction [14, 15]. Analysis of volatile compounds by different techni- ques can yield different quantitative and even qualitative results, depending on the experimental design and the conditions being used [16]; SPME analysis performed with different fibers reflects the same phe- nomena [14, 17].
Coffee classification has been achieved by use of HS-SPME-GC for roasted cof- fee and LS (liquid sampling)-SPME-GC (on a polydimethylsiloxane, or PDMS, fi- ber) for coffee beverages [11]. SPME with a PDMS coating and PCA analysis was the method used. In this work we com- pared two fibers a medium polarity coat-
ing, Carbowax-divinylbenzene (CW-
DVB), 651xm, and an apolar coating, PDMS, 100 ixm. CW-DVB is a porous so- lid, which thus extracts analytes by ad- sorption. PDMS is an apolar viscous li- quid coating, extracting analytes mainly by absorption rather then adsorption [15, 18]. Absorption is a much weaker process then adsorption [18]. The purpose of this study was to evaluate how the different extraction mechanisms of the different fi- bers can influence the classification re- sults. Results were evaluated by PCA ana- lysis.
Experimental
Sample Preparation
Roasted Arabica and Robusta coffee beans were used in our analyses. Arabica coffees were produced in Brazil, Colom- bia, Guatemala (America), and Kenya (A
Original
0009-5893/00/02
Chromatographia
2001,
54, November (No. 9/10)647- 06 $ 03.00/0 9 2001 Friedr. Vieweg & Sohn Verlagsgesellschaft mbH
,,0E.07
- i ;
6 , 0 E + 0 7 1 . , 4 0 E + 0 7 5 , 0 E § ~ c 1 , 2 0 E + 0 7 ~- c 4 , 0 E + 0 7 .... ~-'-" d 1 , 0 0 E + 0 7 ~ c [ 3 , 0 E + 0 7 - - - a - - e 8 , 0 0 E + 0 6 - ~ = - - - 9 2 , 0 E + 0 7 ----,,-.-~ f 6 , 0 0 E + 0 6 " f 4 , 0 0 E + 0 6 1 , 0 E + 0 7 ~ ' g 2 , 0 0 E + 0 6 '_ _ ~ 0 , 0 E + 0 0 ~-- - , ~ = ~ , = 9 ,! ' h 0 , 0 0 E + 0 0 . . . . - " " 4 0 = 6 0 '= 8 0 0 1 0 0 ~ 1 2 0 ~ 4 0 % ; 6 0 = C 80=C 1 0 0 ~ 1 2 0 o CFigure
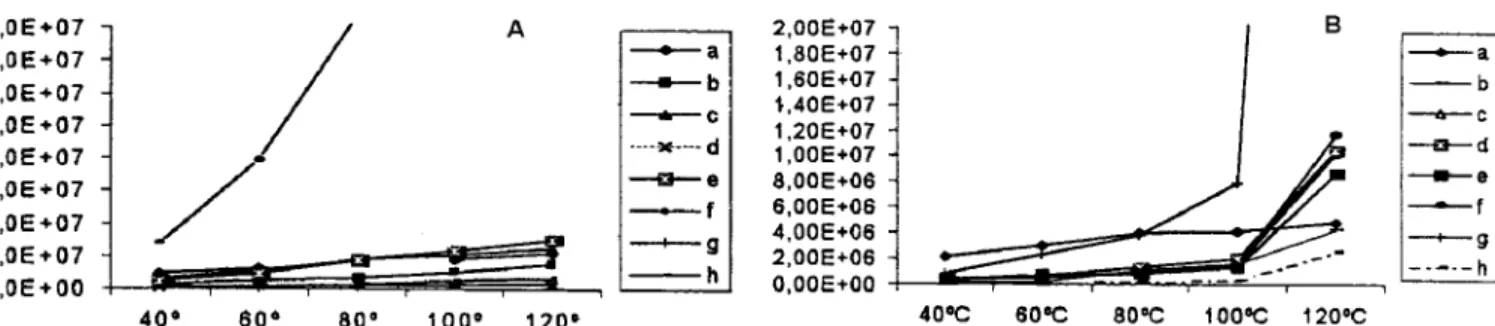
1. Plot of compound peak area against headspace development temperature for the key compounds used for optimization of SPME conditions.A. CW-DVB fiber; B. PDMS fiber. Peak identification: a = pyridine (variable 1); b = methylpyrimidine (variable 4); c = ethylmethylpyrazine (variable 10); d = 3-ethyl-2,5-dimethylpyrazine (variable 10); e = ethyl butyrate (variable 16); f = furanomethanol acetate; g = 2-furfurylthiol (variable 31); h = 5- methyl-2-furancarboxaldehyde.
and B; Africa). Robusta coffees came f r o m Angola, Ivory Coast, U g a n d a , and Zaire (Africa). Samples were delivered in poly- propylene-aluminum-polypropylene packages hermetically sealed under va- cuum. Immediately after sampling the bags were again sealed under the same conditions.
The samples were ground for 3 min (medium grade) immediately before ana- lysis using a coffee mill. The coffee (2.5 g) was placed in a 20-mL vial capped with a Teflon-lined septum and a screw cap. Three replicate analyses by H S - S P M E - G C and H S - S P M E - G C - M S were per- formed on each sample, so the total num- ber of samples analyzed was 27.
Headspace Conditions for Solid-
Phase Microextraction (SPME)
Headspace analysis was performed for each fiber at 40, 60, 80, 100, and 120 ~ Sampling was performed for 1, 3, 5, 7, 10, and 20 min. A G C oven was used for headspace thermostatting. C o m p o u n d s were thermally desorbed at 250 ~ in a Carlo E r b a (CE) Instruments split/split- less injection port.
Gas Chromatography
Gas c h r o m a t o g r a p h y was performed with a Carlo E r b a Vega series instrument equipped with an F I D and a split/splitless injector. Splitless injection was performed with a 1-mL liner; the split vent was closed for 60 s. C o m p o u n d s were separated on a 30 m • 0.25 m m i. d., 0.25 ixm film thick- ness, D B w a x capillary column. H e l i u m was used as carrier gas, at a pressure of 90 kPa. The oven temperature was held at 60 ~ for 5 min after injection then pro- g r a m m e d linearly at 3 ~ min 1 to 110 ~
which was held for 3 min, and then line- arly at 5 ~ 1 to 200 ~ Detector and injector temperatures were 250 ~
G a s C h r o m a t o g r a p h y - M a s s S p e c t r o m e t r y
G C - M S was performed under the same conditions with a Fisons MD800 instru- m e n t also equipped with split/splitless in- jector. Interface and ion-source tempera- tures were 200 ~ Ionization was by elec- tron-impact (EI) at an electron energy of 70 eV. The scan time was 1 s.
D a t a T r e a t m e n t
Multivariate analysis of G C data was ac- complished with U n s c r a m b l e r V5.03 for Windows, from Trondheim, N o r w a y , on an I B M 486 personal c o m p u t e r (PC). All peaks in the G C c h r o m a t o g r a m with re- producible, measurable areas were used to perform P C A analysis. Routine statistical analysis was performed to ensure repro- ducibly measurable areas for all the sam- ples under investigation. Peak areas were processed on a Shimadzu C R 3 A comput- ing integrator and introduced manually to the PC for statistical analysis. D a t a had a m e d i u m RSD of approximately 6.8%. Principal-component analysis (PCA) was used for data evaluation.
SensoryAnalysis
Sensory tests were performed at N o v a D e l - ta by a certified panel according to the Portuguese Rules N P 4258 (1993), N P 4263 (1994), and ISO 6658 (1985). Coffee was prepared by lightly roasting until a " k r a f t " color was achieved. Grinding was rough. The coffee was tasted in transpar- ent glass cups (in accordance with NP)
placed on a rotating table. Ten replicates are tasted. All tasters used the same cup. Approximately 10 g coffee was placed in each cup and boiling water was added. Tasting was performed after settling of the powder. A small spoon was used for tasting (in accordance with N P ) and after a r o m a evaluation the infusion was swal- lowed from the spoon. The spoon was kept hot by immersion in hot water. R o o m humidity and temperature were kept at 60% and 22 ~ respectively.
Results and Discussion
To optimize the extraction process, fac- tors which might influence the solid and the headspace between the analytes in the sample and their extraction by the fiber were taken into account. Extraction is af- fected by time and temperature. Agitation was n o t considered, because it is always less i m p o r t a n t when solid samples are used. Always using the same degree of cof- fee grounding minimized matrix effects.
Because two different extraction me- chanisms were under evaluation for S P M E optimization, eight peaks belong- ing to seven different chemical families were r a n d o m l y chosen from the G C chro- m a t o g r a m .
F o r fiber evaluation the 30 m a j o r peaks obtained were used as variables. We always used area percentage values and n o t absolute areas, because RSD was higher if absolute areas were used, prob- ably because of operator errors, particu- larly m a n u a l injection. A l t h o u g h we were able to observe this problem mainly with the P D M S fiber, it does not seem to be a consequence of S P M E analysis, because others have already reached similar con- clusions using different sampling methods [16].
g,OE+07 7,0E+07 5,0E+07 3,0E+07 1,0E+07 A B 5,0E+06 b 4,0E+06 --m.-- b r 3,0E+06 ~ c 9 - - M - - d ~ d "-='- 9 2,0E+06 ~ = ~ ] ] ; Z : L ~ M ~ " --=--e - - - f 1,0E+06 ~ : : ~ I L = ~ ' ~ ~ ~ f "-'*-- g O,0E+OO , - "-+'- g .1,0E-,,-O7 1' 3' 5' 7' 113' 20' 30' ~ h 1' 3' 5' 7' 10' 20' 30' ~ h
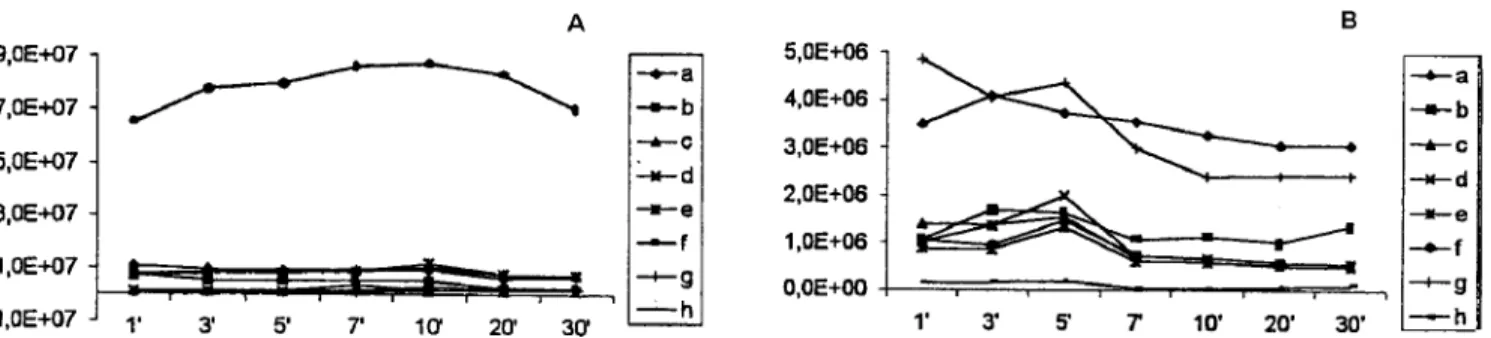
Figure 2. Plot of compound peak area against sampling time for the key compounds used for optimization of SPME conditions. A. CW-DVB fiber; B. PDMS fiber. Peak identification: a = pyridine (variable 1); b = methylpyrimidine (variable 4); c = ethylmethylpyrazine (variable 10); d = 3-ethyl-2,5 dimethylpyrazine (variable 10); e = ethyl butyrate (variable 16); f = furanomethanol acetate; g = 2-furfurylthiol (variable 31); h = 5-methyl-2-furancar- boxaldehyde.
S t u d y o f E x t r a c t i o n C o n d i t i o n s
To optimize the extraction conditions eight peaks from seven different chemical families were chosen (Figures 1 and 2).
The first parameter optimized was tem- perature. The release of a r o m a com- pounds f r o m the matrix is substantially affected by temperature. Because water release was not a problem (roasted coffee contains approximately 6% water) 120 ~ was the limit, because it is k n o w n that above 130 ~ coffee starts to turn b r o w n and above 150~ roasting starts again [19], thus changing the composition of the headspace. Five temperatures were evalu- ated 40, 60, 80, 100, and 120 ~ (Figure 1). Because of these considerations, and knowing that, in general, the highest tem- perature yielding satisfactory sensitivity should be used [20], the temperature was fixed at 100 ~ Better recovery with the C W - D V B fiber was expected, because of the polar character of the eight molecules used for optimization.
After selection of headspace tempera- ture exposure time was optimized. The same c o m p o u n d s were used and extrac- tion time was varied from 1 to 30 min. Fig- ure 2 shows a plot of area against com- p o u n d during time optimization; expo- sure time was fixed at 5 min. A l t h o u g h smaller times have been used [11] with the P D M S fiber we observed that after equili- brium was reached the a m o u n t extracted decreased; this p h e n o m e n o n has already been reported by others [21]. A l t h o u g h this behavior has n o t been clearly ex- plained, it has been suggested that the c o m p o u n d s were released by the fiber as it became hot and the fiber-headspace parti- tion coefficient was reduced [21]. The headspace volume was minimized, be- cause only 1/3 of the vial was empty. I f only the C W - D V B fiber was considered, 1 min exposure time was sufficient. Long-
er times do not, however, seem to affect the a m o u n t extracted when this fiber is used; this avoids changing sampling con- ditions when both fibers are compared.
F i b e r E v a l u a t i o n
Fixing the best operating conditions, does n o t m e a n we were extracting the ideal c o m p o u n d s for coffee differentiation and/ or evaluation [22, 23]. Different com- pounds have been used, and different ex- traction conditions. H S c o m p o u n d s mainly characterize the aroma; taste im- pressions can be added by studying differ- ent fractions [11]. The same might be ap- plied to different extracts of the same headspace but obtained with different fi- bers.
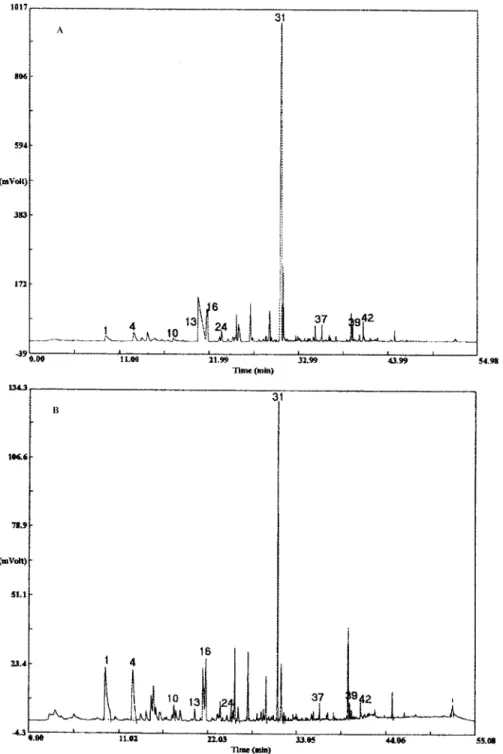
Figure 3 shows typical gas c h r o m a t o - grams obtained from coffee a r o m a by use of both fibers. The G C patterns obtained f r o m the fibers indicate that the main dif- ferences were quantitative rather then qualitative.
It has already been shown that the P D M S fiber can be used to separate and differentiate between coffee samples [11]. Different classification was obtained when HS and/or LS (liquid sampling) were used. The C W - D V B fiber has not yet been used with this sample.
Our intention was to determine which changes relevant to differentiation oc- curred (or even if any differentiation oc- curred) when an extraction procedure with a different mechanism was used. W i t h P D M S fibers absorption is affected mainly by molecular size, polarity, and p H [14]. Because absorption is the rele- v a n t process, analytes are n o t retained on the active surface but partitioned [18] whereas with the C W - D V B fiber, for which the mechanism is adsorption, mole- cules with greater affinity tend to displace those with lower affinity, especially when
the concentrations of the latter are low [15]. Thus absorption is, by definition, a non-competitive process whereas adsorp- tion is a competitive process in which m o - lecules 'fight' for the active sites of the sur- face [24].
To choose between the two fibers for extracting the 'best' c o m p o u n d s for coffee differentiation and/or evaluation, the re- suits f r o m chromatographic analysis of the fiber extract were treated by P C A ana- lysis. P C A is a well established tool for in- terpretation of chemical data, and several examples of its applications and basic fea- tures are available in the literature [23, 25, 26].The c h r o m a t o g r a m s obtained by use of b o t h fibers revealed, as expected, a mul- titude of peaks (more than 100). F r o m this set of data 45 peaks account for m o r e then 90% of the total area. O f these 45 peaks the 30 m a j o r peaks with reproducible measurable areas were used as variables. The areas of these 30 peaks, expressed as a relative percentage of the 45 integrated peaks, were used as variable vectors for multivariate analysis of the data gathered to establish similarities and differences be- tween samples.
The first stage of P C A is choice of the similarity measure. The similarity mea- sure chosen was the covariance matrix. The values obtained are a measure of the a m o u n t of association between variables. The values were normalized using the z- transform.
The next stage in P C A is extraction of eigenvectors from the matrix to obtain the so-called principal components (uncorre- lated variables). Principal components are linear combinations of the original vari- ables and expand the m a x i m u m variance in the variables. The P C loadings are coef- ficients of the correlation between the variable vectors and the principal compo- nents. The P C scores are the coordinates of the samples points on the PC. W h e n
1 0 1 7 31 806 ~ 9 4 (reVolt) 3 8 3
,,2
Fi
6
i ~
- 3 9 O , , 11.0~ 2 1 . 9 9 3 2 . 9 9 4k3.99 5 4 , 9 Q T i m e ( r a i n ) L 3 & 331
11~.6 78.9 (reVolt)I
I
~.4 I 4 16J
i
I
- r t I " I ' i t "nine (=~)Figure 3. SPME-GC-MS chromatograms obtained from coffee samples extracted with, A, the CW- DVB fiber and, B, the PDMS fiber. Peak identification is as given in Table II.
these scores are plotted against the PC, si- milar samples tend to group together.
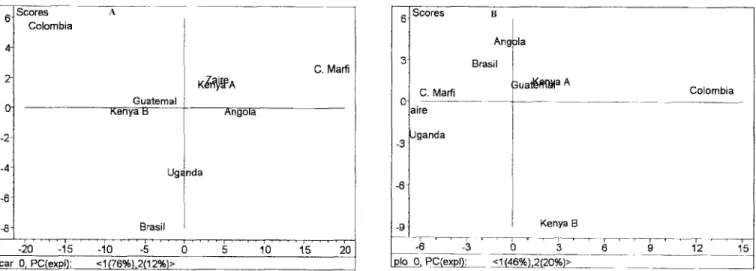
Figure 4 shows plots of variable load- ings and Figure 5 the plot of the scores ob- tained for the two first principal compo- nents of the Arabica and Robusta coffees. The data obtained by PCA analysis when the CW-DVB fiber was used indicated that the first two principal components explained more than 66% of sample varia- tion. The loadings (Figure 5) show that variables 31, 13, 24, and 37 are sufficient to describe the samples (variables are
identified in Table II). When the PDMS fiber was used the first two principal com- ponents explained 88% of sample variabil- ity and variables 1, 39, 16, 10, 4, and 42 were sufficient to describe this set of data. From Figure 5 it seems that the CW-DVB fiber can be used to differentiate the cof- fees according to their origin the African coffees being located on the right of the plot and the American varieties at the left. Uganda coffee is the only African coffee more related to the American varieties. With these results we were unable to see
any difference between Arabica and Ro-
busta varieties. The Kenya B variety (Ara- bica from Africa) that failed the sensory
tests (Table I) was mixed with the Ameri- can varieties. Because the purpose is to identify compounds that account for the classification when the different fibers are used, compounds that affect classification were tentatively identified by GC-MS (Table II). For classification (Figure 4) we might say that variables 31 and 13 are those that account for geographic differ- entiation. Variable 31 characterizes mainly the American coffees and variable 13 the African coffees. Both compounds are considered as impact odorants of roasted coffee [25, 26]. Variables 24 and 37 are those responsible for the variance observed along the 2nd PC. These results are similar to those obtained by use of LS- SPME-GC [11], by use of which three cof- fees from Kenya, Colombia, and Guate- mala, roasted under the same conditions, were separated by PCA according to geo- graphic origin.
When the PDMS fiber was used for sampling very different results were ob- tained. The fermented sample from Kenya (Kenya B) was clearly separated from the others. Variable 4-(3-hydroxy-2-buta- none) seemed to be responsible for this. In this analysis the coffees, instead of being separated according to geographic origin, were separated into the Arabica or Robus-
ta varieties; this result is in agreement with
the fact that different blends were sepa- rated when HS-SPME-GC and PCA were used for coffee characterization [11 ]. Ken- ya A, an African variety, is completely mixed with the American Arabica vari- eties. Arabica varieties seem to be differen- tiated by variables 39, 16, and 31 whereas the Robusta varieties are characterized by variables 1, 42, and 10 (the variables are identified in Table II). Once again vari- able 31, 2-furfurylthiol, and variable 10, an alkylpyrazine, play important roles in this differentiation [27]. This is an impor- tant result, because separation according to variety is very important for coffee blends [28, 29].
C o n c l u s i o n
SPME is an effective and clean method for extraction and analysis of coffee aro- ma headspace. The fiber used is very im- portant if the results obtained are to be used to separate coffee types according to variety, as is needed for coffee blends. Use
6 : 4 2 : 0 i - 4 Scores Colombia Guatemal F, enya Ug,~ Brasil
KZ-~.eA
n d a A n g o l a C. Marfi 6t Scores B 9 Ang ~la 3] Brasil ; u a t l ~ a A C. Marfi Colombia e q . a l r e 3 pganda 8~ 9 ] Kenya a . L ~ , , -20 -15 -10 -5 0 5 10 15 20 -6 -3 0 3-- 6 ~) 12 1'5car 0, PC(expl): <1(76%),2(12%}> plo O, PC(expl): <1 ( 4 6 ~ 2 0 % ) >
Figure 4. Plot of factor loadings for the test set of coffee samples extracted by SPME with, A, the CW-DVB fiber and, B, the PDMS fiber.
0.84 Loadings A 0.64 0.44 0.2t 13 31
}3
-0.2 -0.4 -0.8 -0.6 -0.4 -0.2 0 0.2 0.4 0.6 0.8 car 0, PC(expl)L _ <1(76%),2(12%)> 0.84 Loadings o.64 1 0.44 0.24 04 3.24 3.44 3.64 42 10 1~3 16 31 39 32 25 i , , , i , , , i , , r r ' ' - - ' I ' ' , q ' , . I ' ' ' I -0.6 -0.4 -0.2 0 0.2 0.4 0.6 0.8 !pie 0, PC(expl): <1(46%),2(20%)>Figure 5. Extracted principal components as a function of thirty variables for the coffee samples analyzed, projected in the plane defined by the first two PCs. A. CW-DVB fiber; PC1 = 76%, PC2 = 12%; B, PDMS fiber; PC1 = 46%, PC2 = 20%.
Table I. Panel classification of the coffees studied (taste conditions: temperature 22 ~ RH 60%). 1
Variety Origin Flavour Classification 2
Robusta Angola 3 18.1 Ivory Coast 3 17.9 Uganda 3 17.9 Zaire 3 17.9 Arabica Brazil 4 18.1 Colombia 4 18.1 Guatemala 4 18.1 Kenya A 5 18.7
Kenya B Failed; abnormal Failed; abnormal Panel results were from the same organization that provided the coffee samples. The attributes con- sidered were: A, organoleptic color and visual impression; B, aroma;C, taste impressions acidity, sweetness, metallic, salty, astringency, fermented; D, odor impressions; E, overall impressions body and flavour; F, persistence residual and persistence.
2 The coffee panel considers all Robustas with a global classification _> 17.00 and all Arabicas with a
flavor classification _> 4 to be 'very good'.
Table II. Tentative identification by GC-MS of the variables that account for the observed dif- ferentiation when PCA analysis is performed.
Variable Compound no. name 1 4 10 13 16 24 31 37 39 42 Pyridine 3 -Hydroxy-2-butanone Ethylmethylpyrazine Ethyldimethylpyrazine 1-acetyl(oxy)-2-propanone Propanoic acid 2-Furfurylthiol 1H-Pyrrole- 1 (2-furanyl- methyl) Acetylpyrrole Methyl-2-pyrrole carboxaldehyde
o f the P D M S fiber is b e t t e r for this pur- pose, because the a n a l y t i c a l results ob- t a i n e d e n a b l e d i f f e r e n t i a t i o n b e t w e e n Ara- bica a n d Robusta varieties w h e n HS-
S P M E - G C is used. W h e n d e t e r m i n a t i o n o f g e o g r a p h i c origin is the m a i n p u r p o s e
H S - S P M E - G C w i t h the C W - D V B fiber c a n be used. T h e differences o b s e r v e d clearly d e m o n s t r a t e the need of m e t h o d e v a l u a t i o n w h e n e v e r a new m e t h o d / m a - trix is p r o p o s e d .
Acknowledgments
The a u t h o r s wish to t h a n k D e l t a Caf6s in C a m p o M a i o r , P o r t u g a l for the gift o f the coffee samples a n d for the results f r o m sensory testing, a n d F u n d a g ~ o p a r a a
Ci6ncia e Tecnologia P/AGR/1116/98 for funding.
References
[1] Arthur, C.L.; Killam, L.M.; Buchholz, K.D.; Pawliszyn, J.; Berg, J.R. Anal.
Chem. 1992, 64, 1960 1966.
[2] Lanenfeld, J.J.; Hawthorne, S.B.; Miller, D.J. Anal. Chem. 1996, 68, 144 155. [3] van der Kooi, M.M.E.; Noij, Th.H.M.
16th int. Syrup. Capillary Chromatogra- phy, Riva del Garda, Italy, 1994, pp
1087 1098.
[4] Yang, X.; Peppard, T. J. Agric. Food
Chem. 1994, 42, 1925 1930.
[5] Garcia, D.D.C.; Magnaghi, S.; Reichen- bacher, M.; Danzer, K. J. High Resol.
Chromatogr. 1996, 19, 257 262. [6] Garcia, D.D.C.; Magnaghi, S.; Reichen-
bacher, M.; Danzer, K.; Hurlbeck, C; Bartzsch, C.; Feller, K.H.J. High Resol.
Chromatogr. 1998,21,373 377. [7] Hawthorne, S.B.; Miller, D.J.; Pawliszyn,
J.; Arthur, C.L. Z Chromatogr. 1992, 603, 185 191.
[8] Page, B.D.; Lacroix, G. J. Chromatogr.
1993,648, 199 211.
[9] Matich, A.J.; Rowan, D.D.; Banks, N.H.
Anal. Chem. 1996,68,4114 4118.
[10] Miller, K.G.; Poole, C.F.; Pawlowski, T.M.P. Chromatographia, 1996, 42, 639 646.
[11] Bicchi, C.P.; Panero, O.M.; Pellegrino, G.M.; Vanni, A.C. Z Agric. Food Chem. 1997, 45, 4680 4686.
[12] Arthur, C.L.; Pawliszyn, J. Anal. Chem. 1990, 62, 2145 2148.
[13] Pawliszyn, J. In Solid-phase Microextrac-
tion Theory and Practice, Wiley-VCH, New York, 1997.
[14] Yang, X.; Peppard, T. LC-GC, 1995, 13, 882 886.
[15] Zhang, Z.; Pawliszyn, J. Anal. Chem. 1993, 65, 1843 1852.
[16] Valero, E.; Villasenor, M.J.; Sanz, J.; Cas- tro, I.M. Chromatographia 2000, 52, 340 344.
[17] Garcia, D.D.C.; Reichenbacher, M.; Dan- zer, K.; Hurlbeck, C.; Bartzsch, C.; Feller, K.H. Z High Resol. Chromatogr. 1997, 20, 665 668.
[18] Baltussen, E.; Sandra, P.; David, F.; Cra- mers, C. Z Microcolumn Sep. 1999, 11, 737 747.
[19] Faria, J.M. Alimentar 1988, 12, 9 10. [20] Pawliszyn, J. In Applications of Solid-
phase Microextraction: Pawliszyn, J., Ed., The Royal Society of Chemistry, UK, 1999.
[21] Namera, A.; Yashiki, M.; Kojima, T. In:
Applications of Solid-phase Microextrac-
tion: Pawliszyn, J., Ed., The Royal Society of Chemistry, UK, 1999.
[22] Biggers, R.E.; Hilton, J.J.; Gianturco, M.A. Z Chromatogr. Sci. 1969, 17, 453 468.
[23] Bicchi, C.P.; Binello, A.E.; Pellegrino, G.M.; Vanni, A.C.J. Agric. Food Chem. 1995,43, 1549 1555.
[24] Gorecki, T. In: Applications of Solid-phase
Microextraction: Pawliszyn, J., Ed., The Royal Society of Chemistry, UK, 1999. [25] Hernandez, C.V.; Rutledge, D.N. Analyst
1994,119, 1171 1176.
[26] Martin, M.J.; Pablos, F.; Gonzalez, A.G.
Anal. Chim. Acta 1996, 320, 191 197. [27] Czerny, M.; Mayer, F.; Grosch, W. J. Ag-
ric. Food Chem. 1999, 47, 695 699. [28] Czerny, M.; Grosch, W. J. Agric. Food
Chem. 2000, 48, 868 872.
[29] Frega, N.; Bocci, F.; Lercker, G. J. High
Resol. Chromatogr. 1994, 17, 303.
Received: May 21, 2001 Revised manuscript received: Jul 11, 2001 Accepted: Aug 21, 2001