THE INDEX OF CONSCIOUSNESS AS A TOOL TO ACCESS DEPTH OF ANESTHESIA IN DOGS: A CLINICAL STUDY
Dissertação de Mestrado Integrado em Medicina Veterinária
Diana Luísa Pires Lourenço
Orientador: Professor Doutor David Orlando Alves Ferreira Co-orientador: Professor Doutor José Eduardo Teixeira Pereira
THE INDEX OF CONSCIOUSNESS AS A TOOL TO ACCESS DEPTH OF ANESTHESIA IN DOGS: A CLINICAL STUDY
Dissertação de Mestrado Integrado em Medicina Veterinária
Diana Luísa Pires Lourenço
Orientador: Professor Doutor David Orlando Alves Ferreira Co-orientador: Professor Doutor José Eduardo Teixeira Pereira
THE INDEX OF CONSCIOUSNESS AS A TOOL TO ACCESS DEPTH OF ANESTHESIA IN DOGS: A CLINICAL STUDY
Dissertação de Mestrado Integrado em Medicina Veterinária
Diana Luísa Pires Lourenço
Orientador: Professor Doutor David Orlando Alves Ferreira Co-orientador: Professor Doutor José Eduardo Teixeira Pereira
Composição do Júri:
“It is the supreme art of the teacher to awaken joy in creative expression and knowledge.” Albert Einstein
ii
Resumo
Durante as últimas três décadas, investigações têm sido feitas com o intuito de melhorar a monitorização da profundidade anestésica. O desenvolvimento de novas tecnologias permitiu o surgimento de novos monitores tais como electrocardiogramas, pulsioxímetros e capnógrafos, os quais podem ser usados em pacientes veterinários e fornecer medidas objectivas de variáveis fisiológicas. Contudo, está em falta um monitor que possa ajudar a avaliar a actividade eléctrica cerebral em animais sob anestesia geral. Esta questão não é de fácil acesso, e requer monitores de elevada sensibilidade ao EEG, que possam correlacionar profundidade anestésica com a administração de drogas hipnóticas durante procedimentos cirúrgicos. Aceder à profundidade anestésica num paciente veterinário pode ser conseguido analisando parâmetros subjetivos, sendo eles a posição do olho, o tamanho pupilar, o reflexo corneal, o reflexo palpebral, o tónus muscular e a resposta a um estímulo nociceptivo, os quais são indicadores indirectos da quantidade de hipnóticos que alcançam o cérebro.
Em medicina humana há diferentes monitores de electroencefalograma usados para recolha e avaliação da actividade eléctrica cerebral, o que, também, podem ser uma ferramenta útil para aceder à profundidade anestésica em animais. O objectivo deste trabalho é estudar o desempenho do monitor Index of consciousness (IoC), um monitor de profundidade anestésica humana, no acesso à profundidade anestésica em cães durnate uma anestesia geral com sevoflurano.
iii
Abstract
During the last three decades, researches had been made in order to improve monitoring depth of anesthesia. The development of new technology allowed the emergence of new monitors such as electrocardiographs, pulseoximeters, oscillometers and capnographs, which can be used in veterinary patients and give objective measurements of physiologic variables. It is missing a monitor that could help to evaluate the central brain electric activity in animals under general anesthesia. This issue is not easy, and requires very sensitive EEG monitors that can correlate anesthetic depth with hypnotic drug administration during surgical procedures. Accessing the depth of anesthesia in a veterinary patient can be performed by analyzing subjective parameters such as eyeball position, pupil size, corneal reflex, palpebral reflex, muscular tone and nociceptive response to a noxious stimulus, which are indirect indicators of the amout of hypnotics that reach the brain.
There are different human EEG monitors available used to record and analyse the brain electrical activity electroencephalogram, which can be an useful tool to access anesthetic depth also in animals. The aim of this study is to study the performance of the Index of consciousness (IoC) monitor, a human depth of anesthesia monitor, in accessing depth of anesthesia in dogs after general anesthesia with sevoflurane.
iv
Index
Index ... iv CHAPTER I - Introduction ... 1 1.1 - DEPTH OF ANESTHESIA ... 1 1.2 - EEG ... 1 1.3 - SIGNAL ACQUISITION ... 4 1.4 - ARTIFACTS ... 4 1.4.1 - Artifact Recognition ... 4 1.4.2 - Extracerebral artifacts ... 5 1.4.3 - Intracerebral artifacts ... 5 1.5 - AMPLIFIERS ... 61.6 - THE ELECTRODES PLACEMENT ... 6
1.7 - QUANTITATIVE ELECTROENCEPHALOGRAPHIC MONITORS ... 7
1.7.1 - Bispectral Index ... 8
1.7.2 - Cerebral State Index ... 10
1.7.3 - Index of consciousness ... 11
1.7.3.1 - Definition of IoC ... 11
1.7.3.2 - IoC-view scale ... 12
1.7.3.3 - Indications for use ... 12
1.7.3.4 - How this monitor record the EEG? ... 13
1.7.3.5 - Electrode position... 13
1.7.3.6 - Signal quality Index SQI (range= 0-100) ... 13
1.7.3.7 - Electromyography ... 13
1.7.4 - Narcotrend Index ... 14
1.7.5 - Spectral Entropy ... 16
v
1.8 - THE NONANESTHETIC FACTORS INTERFERING WITH THE EEG ... 17
1.9 - THE ANESTHETIC FACTORS INTERFERING WITH THE EEG ... 18
1.9.1 - Intravenous Anesthetics ... 19
1.9.2 - Volatile anesthetics ... 20
1.10 - OBJECTIVES OF THE THESIS ... 21
CHAPTER II – Material and General Methodology ... 22
2.1- PATIENTS AND HEMODYNAMIC MONITORING ... 22
2.2 - CEREBRAL MONITORING ... 23
2.3 – THE ELECTRODES PLACEMENT ... 24
2.4 - HOW THE EEG DATA WERE RECORDED?... 25
2.5 - ANESTHETIC PROTOCOL ... 25
2.6 - STATISTICS ... 26
CHAPTER III - Results ... 27
CHAPTER IV - Discussion ... 31
CHAPTER V – Conclusion ... 36
vi
Index of tables
Table 1.1 - The definition of the IoC scale vs The clinical state of the Patient while awake
and during anesthesia (Adapted from Morpheus Medical)……….…..13
Table 1.2 - This table corresponds to an adaptation of Webber et al. 2005 and represents the
Narcotrend Index and Narcotrend stages, corresponding important electroencephalogram (EEG) features, and clinical description………..….15
Table 3.1 - Description of the ten animals according to their sex, breed, surgery submitted
and mean duration of the surgery……….….28
Table 3.2 - Respiratory, haemodynamic, analytics and temperature baseline values (before
anaesthetic pre-medication) for each individual patient………..….28
Table 3.3 - Values obtained from each individual patient in the beginning of the study
(moment when the volatile anesthetic administration was stopped)……….……29
Table 3.4 - Values obtained from each individual patient in the moment of awake. The time
vii
Index of figures
Figure 1.1 - Electrodes assembles……….….7 Figure 1.2 - This figure adapted from Johansen J. 2006 represents a BIS display screen…...10 Figure 1.3 - Adapted from Morpheus Medical. This figure shows a representation of the
IoC-view monitor……….………12
Figure 1.4 - This figure corresponds to an adaptation of Kreuer & Wilhelm 2006 about The
Narcotrend stage, actual value and trend (‘cerebrogram’) and raw electroencephalogram (EEG) signal, as well as a power spectrum and several derived EEG parameters…………...16
Figure 2.1 - This picture shows a representation of the animal and some of the equipment
used during the study presented………23
Figure 2.2 - Representation of IoC – View………..…23 Figure 2.3 - Representation of the electrodes placement: in the middle of the forehead/frontal
bone the positive electrode ( + ), to the left side of the forehead near the lateral eye socket the reference electrode ( ref ), and over left zygomatic bone the negative electrode ( - )………..24
Figure 2.4 - This picture represents the mechanical ventilator ( Siemens Ventilator 710 ) used
during this study………....26
Figure 3.1 - Trend in heart rate and mean arterial pressure during the beginning of the
anaesthetic procedure until the moment of the individual patient waked up.………...…….31
Figure 3.2 - Trend of IoC and End-tidal Sevoflurane (%) from the beginning of the study
until the animal waked up. The blue colour corresponds to the among serie of values about IoC and the red colour represents the serie of values about Etsev………..….31
Figure 3.3 - Correlation between IoC and the End- tidal of sevoflurane(%) during the study
period. “R” corresponds to the value of the coeficient of correlation between these two variables………32
viii
Glossary
AP – Action Potentials
CNS – Central Nervous System ECG – Electrocardiography EEG – Electroencephalogram EMG – Electromiography
ESR – Electroencephalogram suppression rate ETSevo – End-tidal Sevoflurane
IM – Intramuscular
IoC – Index of consciousness
MAC – Minimum alveolar concentration R – Coeficient of correlation
SD – Symbolic dynamics SD – Standard deviation SQI – Signal quality index
ix
Acknowledgements
Ao Centro Hospitalar Veterinário e a toda a sua equipa, mais especificamente ao Dr. André Pereira, Dr. Hugo Gregório, Dra. Sara Peneda e ao Dr. Lénio Ribeiro, por toda a ajuda, disponibilidade, preocupação e incentivo que sempre demonstraram comigo .
Ao Dr. Lénio Ribeiro, mais particularmente, por ter tido sempre aqu ela vontade inata de ensinar e aprender contagiante, que muito me incentivou a progredir, e por ter sido o meu tutor, professor e até mesmo amigo.
À Dra. Catarina Araújo que, para mim, é, acima de tudo, uma amiga. Foi um prazer ter-me voltado a cruzar com ela e, nunca, ter-me hei-de esquecer das vezes que ter-mesmo cansada ficava comigo na sala de cirurgia a ajudar-me a recolher os dados e a incentivar-me a não desistir quando algo não corria bem. A ela, especialmente, um muito obrigado.
Ao Dr. Carlos Adrega que com a sua boa disposição contagiava tudo e todos, e que só me deu motivos de orgulho por ter trabalhado com ele porque apesar de ser muito grande é muito humilde e acessível.
Ao meu orientador, o Professor David Ferreira por ter permitido que eu fizesse este trabalho, que de trabalhoso teve de prazeroso.
Ao Professor Luís Antunes por, prontamente, ter fornecido o Monitor IoC, sem o qual não teria sido possível este trabalho.
Ao Hospital Veterinário Montenegro que permitiu que eu desse os primeiros passos neste mundo da Medicina Veterinária.
Ao meu irmão Diogo que foi e sempre será o maior impulso que tenho para avançar e ultrapassar os obstáculos que vão surgindo no meu percurso.
À minha mãe, que, sem dúvida, é a melhor mãe neste mundo por me aturar o que mais ninguém me atura.
À minha querida amiga Ana Martins que viveu tão intensamente os meus dramas e frustrações quanto eu, e que sem o seu imenso apoio tudo teria sido mais dif ícil de ultrapassar e resolver.
Ao meu namorado Eduardo que me ouviu, acompanhou, ajudou e sempre conseguiu transmitir-me uma sensação de serenidade e tranquilidade indescritível.
Às minhas amigas Filipa, Dorita, Eliana e Joana que tantos momentos de aprendizagem, trabalho, animação e diversão me proporcionaram enquanto colegas de estágio, e que só por elas este percurso já valeu a pena.
x
À minha Nelma, que apesar de só nos termos conhecido no Centro Hospitalar Veterinário, mostrou ser uma grande amiga de longa data por compreender -me tão bem e por ter sido um apoio imensamente grande nesta fase.
À minha doce amiga Paulinha que tantas vezes me desencaminhou e me deu “uma lufada de ar fresco” nesta fase.
Ao Moisés e à Pretinha que são duas criaturinhas perfeitas e que me dão alento para continuar a gostar tanto de animais.
1
CHAPTER I - Introduction
1.1 - DEPTH OF ANESTHESIAIn the recent years the veterinary anesthesia had a great developments and one of the main objectives of this “modern” anaesthesia is to ensure adequate depth of anaesthesia to prevent overfilling the patients with potent anesthetic drugs. During the task of some anesthesiologists sometimes they have problems to understand if is necessary administrating more or less of a particular drug, as balanced anesthesia is a more difficult technique to learn, in spite of being associated with several advantages (Jacoby, Hamelberg et al. 1960).
In veterinary literature (Haskins 1992, Lumb and Jones 1996, Hall, Clarke et al. 2001) related to depth of anesthesia are normally extrapolated from human anesthesia. Guedel, in 1937 (Guedel 1937) described the classical signals of ether anesthesia for humans, which have been applied to animals in a first effort to characterized the depth of anesthesia (Soma 1971, Hall, Clarke et al. 2001). This evaluation of depth of anesthesia was based on observation of ocular reflexes, muscle tone, and respiration. Haskins described a variety of signs that can be helpful to evaluate the depth of anesthesia in dogs (Haskins 1992).
Furthermore, resorting only the clinical signs, as the unique way to assess depth of anesthesia, seems to be unpredictable because it is essentially established on evaluation of muscle activity and autonomic reflexes, by itself the responses are interfered in various forms by various anesthetics (Cullen et al. 1972).
1.2 - EEG
The electroencephalogram (EEG) is liking a resurgence of interest as a clinical monitoring instrument during anesthesia and sedation. This resurgence is the consequence of two recent events. The first one, the use of EEG gives information for confirming deep surgical anesthesia to the assessment of lighter or sedative levels, and the second one, new technologic progresses that have created tangible progress in the conception of a monitor of "anesthetic depth".
The electroencephalogram (EEG), such as all bioelectric potential noted on the skin happen by the flow of ion-based electrical currents within the volume of the body (Rampil 1998).
2
In a more particular way, the EEG is made by a summation of excitatory and inhibitory postsynaptic potentials created in cortical grey matter (Miller 2005). Following the example of the electrocardiogram (ECG), these macroscopic currents are the net summation of microscopic currents contributed by large populations of individual, electrically active cells (Rampil 1998). Richard Caton in 1875, a physician in Liverpool, was the first that detected electrical oscillations on the uncovered cortical superficie of animals.
The definition of the traditional EEG tells that it is a time domain recording of spontaneous electrical signals created by the summation of neurons’ activity in the cerebral cortex (Tooley et al. 1984, Gugino et al. 2004). Excitatory and inhibitory post-synaptic potentials in large pyramidal neurons, which are located in the lower layers of the cerebral cortex, produces this neurons´ activity (Prince & Shanzer 1966, Tooley et al. 1984, Rampil 1998).
The electrical activity of neurons may be divided into two categories: regenerative action potentials (AP) and postsynaptic potentials (PSP). This postsynaptic potentials happen when the liberty of certain neurotransmitters by a presynaptic neuron change the permeability of ion channels in the postsynaptic membrane cell of the neuron, changing its transmembrane ionic concentration gradients and thus its transmembrane voltage. The magnitude of an isolated PSP is proportional to the number of postsynaptic receptors that have bound agonist. Such as the neurotransmitter release is a localized phenomenon, the consequential changes in latent membrane potential also tend to be focal, with the magnitude of the voltage change decreasing exponentially with distance from the synapse (Rampil 1998). Focal areas of altered membrane potential, known as synaptic activity, and ionic current flow happens between these disturbances (Rampil 1998).
The measurement of the electrical signal such as amplitude and frequency are modulated by afferent inputs transmitted from sensory-specific thalamic nuclei serving as gates between receptors and the cortex and by ‘epicentres’ within cortical areas (John & Prichep 2005). The EEG frequency bands frequently applied for monitoring depth of anaesthesia are the delta (d) (0–4 Hz), theta (u) (4–8 Hz), alpha (a) (8–13 Hz) and beta (b) (13–30 Hz) bands (Kaieda et al. 1989, Schwender et al. 1996).
3
The electroencephalographic signal is described by using three basic parameters: 1. Amplitude is the size, or voltage of the recorded signal and ranges from 5 μV to 500 mV (Miller 2005).
2. Frequency is the number of times per second the signal oscillates or crosses the zero voltage line (Stanski 2000). It is very interesting that the fluctuations are in a relatively narrow range from 0.5 Hz to 50 Hz, with most of the frequencies below 30 Hz (Holliday and Colette 1999).
3. Time is the duration of the sampling of the signal (Miller 2005). The set of sequential samples is named an epoch, and the collection of all possible epochs from an EEG is entitle ensemble (Rampil 1998). The 2 seconds epochs have been recommended for monitoring the patients’ EEG during surgical procedures. The advantage of averaging the epochs is the reduction of the power spectrum variance. In contrast the averaging could obliterate the characteristics of the EEG pattern (Levy, Shapiro et al. 1980). Contamination of the signal could be introduced by artifacts frequencies produced by the abrupt transitions at the epochs’ end (Rampil 1998). Otto has been studying in dogs the effects of the different averaging on the EEG analysis in dogs and conclude that quantification EEG analysis in response to noxious stimulation are significantly depending of the number of epochs subjected to averaging. The average of 20 to 30 second period could be the best for detecting changes in EEG data when an intense noxious stimulus is applied (Otto 2007).
The EEG such as an objective quantity of depth of anesthesia represents one useful pathway to avoid waking during surgery or overdosage, which contributes to the improvement of experiments. As the EEG is the consequence of the cortical electrical activity, it could represent a clinically real measure of the depth of cerebral depression after the administration of anesthetic drugs (Silva, Antunes 2012).
In 1984, Stanski DR et al., said that the EEG monitoring for drug effect represents, of the Central Nervous System active agents, a quantitative utensil for the pharmacologic study. Furthermore, in 1986, Nussmeier NA et al., contributed for the application of the EEG monitoring telling that the assessment of metabolic suppressive effect like the dose control of thiopental when EEG burst suppression happens. For the last one, Glass PSA et al., in 1996, assumed that the valuation of CNS functional suppression (depth of sedation or anesthesia) can be reached in the EEG monitoring.
4
The consequence on the EEG, of numerous anaesthetic drugs, sedative and analgesic agents, has been concluded in various studies in human and different animal species. These works showed dose-dependent alterations in the EEG spectrum for different intravenous and volatile anesthetics (Otto 2008).
1.3 - SIGNAL ACQUISITION
The EEG, such as an ionic current, is converted into an electronic current by a metal needle or gel electrodes working as transducers. Then, this electronic current may be further processed by the EEG monitoring equipment. It makes helpful measure the electrical activity of the cortex at several locations on the scalp such as this activity is topographically heterogeneous (Rampil 1998).
For the other side, to resort a clear electrographic signal, the recording electrode impedances should be less than 5 kΩ and accorded to each other, which may array from 5 to 500 mV. If electrode impedance increases exceeding the value written before or becomes mismatched, significant signal loss happens, and background electrical “noise” starts to make the electroencephalographic signal unclear. So, to avoid this and trying to keep the electrode impedance low, through gold cup electrodes with silver-silver chloride electrolyte gel placed between the scalp and the electrode.
There are other factors which interfere with the Signal Acquisition. These factors could be divided into nonanesthetic factors and anesthetic factors. The nonanesthetic factors remains to pathophysiologic factors such as hypoxemia, hypotension, hypothermia, hypercarbia, hypocarbia and metabolic factors. The anesthetic factors are directly relational with the fact all anesthetic drugs do not produce exactly the same changes in electroencephalographic pattern as anesthesia deepens (Miller 2005).
1.4 - ARTIFACTS
1.4.1 - Artifact Recognition
Artifactual contamination should not be forgotten in EEG analysis. Besides the trained observer, artifact still present in EEG analysis and a lot of true EEG resembles noise. There are some artifacts that seem to be commons. One of them is represented by signals that exceeded the dynamic range of the amplifier (voltage too big because of improper amplifier
5
settings or movement of the electrodes on the skin). Furthermore, the presence of an additional signal that is outside the frequency range of the EEG represents another common type of artifact. Usually this signal includes electromyogram activity or power line pickup. If the sampling rate is fast enough to avoid aliasing, these kinds of artifacts may be filtered out, leaving a still usable EEG signal. In commercially available EEG monitors, epochs with artifact may be identified but still processed and excluded from further processing (Rampil 1998).
1.4.2 - Extracerebral artifacts
In this type of artifacts it could exists artifacts from outside the head and, for the other side, from the head outside the brain.
In the first case electrical artifact happens when electronic circuits surgically implanted, such as pacemakers, electrocardiogram or the vagus nerve stimulator produce unwanted signals internally that contaminate the EEG recording (Handbook of EEG interpretation).
On the other side, the artifacts from the head outside the brain could be represented by different sources. The eye blink artifact which is produced by vertical movement of the eye. Another one is the electroretinogram that represents the normal response of the retina to photic stimulation; this signal could become the EEG less clear. A myogenic (muscle) artifact represents another artifact. The electromyography (EMG) activity could be produced during a seizure, during a muscle contraction or during movements, and may occur individually or become continuous obscuring the EEG (Handbook of EEG interpretation).
Some studies have been taken in order to understand the effect in dogs of a noxious stimulus produced by electrical stimulation. The fact observed was that after a stimulation the BIS increased significantly in all treatments but, Campagnol et al. founded a high correlation between BIS and EMG. So, the changes in BIS may not be related to awareness but to EMG response (Campagnol, Teixeira Neto et al. 2007).
1.4.3 - Intracerebral artifacts
It is not easy to describe artifacts with origin in the brain in veterinary anesthesia. It is difficult to determine the alteration in the EEG due to artifacts that are in the brain. In human anesthesia low amplitude of EEG sometimes motivated by analgesic or volatile agents, seizure activity and post-ictal state which can happen due abnormal physiology, cerebral
6
pathology or drugs, inconstant activity during stable anesthesia unrelated with surgical stimulation. Paradoxal activity arises in one third of the human patients, noxious stimulus may produce an increase in slow waves. For the last one the cerebral pathology and systemic problems such as hypovolemia, hypoglycemia, and cardiac arrest could slow the EEG waves (Bennett, Voss et al. 2009).
1.5 - AMPLIFIERS
The EEG is not the only voltage waveform present on the scalp. Three other signals, at least, created by physiologic processes are present on the scalp. Rampil described the ECG (from the R-wave vector sweeping through the neck), electromyogram (EMG, from electromechanical activity of scalp muscle), and the electrooculogram (EOG, generated by movement of the electrical dipoles within the globes as the eyes move). Furthermore, the body tends to catch the power line signal radiated by the cables in nearby walls and ceilings. If these signals are present they distort and interfere with the EEG signal (Rampil 1998).
1.6 - THE ELECTRODES PLACEMENT
There are different electrodes assembles described in dogs. The first one, at the frontal-occipital position (Campagnol, Teixeira Neto et al. 2007; Ribeiro, Ferreira et al. 2009) all the electrodes are in the midline, Electrode 1 is placed 1 cm dorsal to an imaginary line connecting the medial canthi of the eyes, and electrode 3 was placed on the occipital crest. Because of the design of the sensor, electrodes 2 (ground), and 4 (reference) were placed at 2-cm distance from each other (Campagnol, Teixeira Neto et al. 2007). The second one, at the bifrontal position (Carrasco-Jimenez, Martin Cancho et al. 2004) electrodes 1 and 3 were placed 1 cm caudal to the lateral canthus of each eye. Electrode 4 (reference) was placed on the midline, and electrode 2 (ground) was placed between electrodes 1 and 4 (Campagnol, Teixeira Neto et al. 2007). The last one, the frontal-temporal position (Campagnol, Teixeira Neto et al. 2007) the electrode 1 was placed in the midline on the rostral third portion of an imaginary line connecting the zygomatic process of the frontal bone, and the caudal portion of the frontal crest. Electrodes 2 (ground) and 4 (reference) were each placed at an angle of 15o to 30o to the transverse plane. As a result of this placement, electrode 2 remained dorsal to the eyelid, whereas electrode 4 was placed caudodorsal to the lateral canthus of the left eye.
7
Electrode 3 was placed on the zygomatic process, cranial to the base of the left ear (Campagnol, Teixeira Neto et al. 2007).
All the positions are showed in the following figure.
Figure 1.1 - Electrodes assembles At the left side represents the frontal-occipital position, at
the middle represents the bifrontal position and at the right side represents the frontal-temporal position of electrodes (Campagnol, Teixeira Neto et al. 2007).
In several studies it had been compared patch electrodes and subdermal electrodes using a modified cable of the ECG using three 29 gauge platinum needles. They reached the conclusion that both types of electrodes had equal skin impedance and the values founded are not statistically important. Furthermore the ECG clamp electrodes are also used because there application brings some advantages such as the reduction of the cost of EEG monitoring and, for the other side, the EEG clamp electrodes are easy to apply during routine clinical use (Seitsonen, Yli-Hankala et al. 2000; Akavipat, Dumrongbul et al. 2006).
1.7 - QUANTITATIVE ELECTROENCEPHALOGRAPHIC MONITORS
The level of hypnosis and consciousness is mainly challenging in animals and, so, monitoring anesthetic depth becomes difficult. Though, two methods are currently frequent. The bispectral index (BIS) is a variable derived from the passively recorded electroencephalogram (EEG). Auditory evoked potentials (AEP) signify the EEG response to an auditory stimulus, returning the latency and amplitude of wave forms. Monitors using the AEP can also return a numerical variable. Both approaches have been evaluated in animals (Bollen & Saxtorph 2006).
The use of BIS for monitoring the depth of anesthesia has been reported in cats (March & Muir 2003; Lamont et al. 2004), dogs (Muir et al. 2003; Greene et al. 2002, 2003), pigs (Martin-Cancho et al. 2003), goats (Antognini et al. 2000) and horses (Haga & Dolvik 2002) while the use of AEPs has been reported in dogs (Murrell et al. 2004; Pypendop et al. 1999), mini-pigs (Andrews et al. 1990) and rats (Antunes et al. 2003; Haberham et al. 2000; Jensen
8
et al. 1998). Generally, these studies reveal that considerable variation in BIS or AEP indices exists between individual animals.
1.7.1 - Bispectral Index
The first monitor scientifically validated and commercially supported for notice an anesthetic drug effect on CNS was Bipectrsl Index (BIS; Aspect Medical Systems Inc., Natick, MA). This monitor, BIS, incorporates four EEG parameters (BetaR, SynchFastSlow, QUAZI, BSR) into a single variable. The EEG is digitized and processed to identify and eliminate artifacts. The signal is then analyzed for suppression detection and also for fast Fourier transform. The suppression is used to compute the burst suppression ratio (BSR). The fast Fourier transform is used to compute a relative beta ratio (BetaR) and also to compute bispectrum, from which SynchFastSlow is derived. All of these components are combined by discriminant analysis, with the result scaled from 0 to 100. However, the BIS machine displays only BSR and BIS values.
EEG signal was obtained from A-1050 monitor; BetaR and SynchFastSlow were calculated by software that can implement power spectral analysis and bispectral analysis of EEG.
This monitor of depth of consciousness creates a scale from 0 to 100 by processing the electroencephalogram (EEG). A BIS of 100 indicates an awake and responsive subject. When hypnotics are administered, BIS decreases, and a BIS value of 0 represents EEG silence. The recommended values of BIS for general anesthesia were between 40 to 60.
At BIS more than 60 BetaR was linearly correlated with BIS. BetaR is the logarithm of the ratio of the EEG spectral power in the 30 to 47 Hz to the 11 to 20 Hz. Compared with pre-induction, a decrease in spectral power between 30 and 47 Hz and an increase in 11 and 20 Hz was observed after induction of anesthesia. Importance of so-called gband EEG has been highlighted as a marker of conscious state. BetaR reflects the loss of gband EEG and is a good indicator for tracking the patient’s level of consciousness during anesthesia.
At a BIS range of 30–80, SynchFastSlow was linearly correlated with BIS. Bispectral analysis is an advanced signal processing technique that quantifies phase coupling among the components of a signal. SynchFastSlow is a bispectrum-derived variable that is a logarithm of a ratio of 40 to 47 Hz and 0.5 to 47 Hz. To observe the character of SynchFastSlow, we also evaluated the relationship between BIS and SEF which is a conventional processed EEG
9
parameter derived from power spectral analysis. SEF was also correlated with BIS at a BIS range of 30 to 80. Consequently were evaluated the relationship between SynchFastSlow and SEF from the data at BIS range of 30–80. These two parameters correlated well. In conclusion, at BIS range of 30–80, changes in BIS correlate well with SynchFastSlow and SEF.BSR is the percentage of suppression period against time. BSRN40 was linearly correlated with BIS in the range of 30–0 (Morimoto et al. 2005).
The Bispectral Index (BIS) monitor was approved in 1996 by the US Food and Drug Administration for use in the setting of general anesthesia to aid in assessing the depth of anesthesia on adults. In conclusion, traditional power spectral analysis decomposes raw EEG signal into a function of power (amplitude) and frequency. The BIS incorporates the phase-coupling relationship (bispectral analysis) into a conventional frequency ⁄ power analysis of the EEG (Disma et al. 2009).
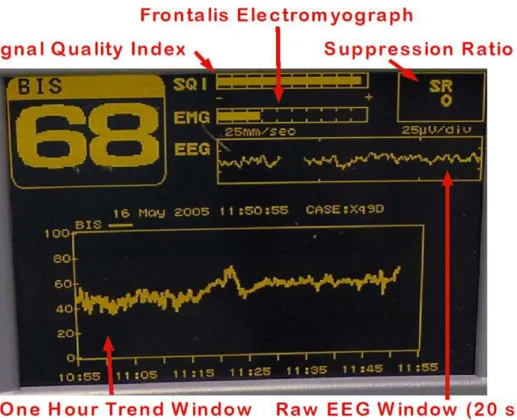
Figure 1.2 - This figure adapted from Johansen J. 2000 represents a BIS display screen. BIS index (0–100) is
shown in upper left. BIS is trended versus time in the lower window. Raw EEG is shown (w20 seconds) above this. Suppression ratio (SR) represents the cumulative percent of cortical silence over the last 65 seconds. Data reliability may be assessed by evaluating the bar graphs for signal quality index (SQI; global parameter incorporating electrode impedance and artifact detection) and electromyographic activity (EMG) of the frontalis muscle in the 70–110 Hz band (dB). EMG activity over 1/3 of total bar height (30–50 dB) may represent contamination of EMG below 50 Hz and artifactual elevation of BIS value.
10
Using the BIS as a monitor of depth of anesthesia takes some advantages explained in 2002 for Morimoto et al., this monitor should speed the recovery time. For the other side decrease the incidence of intra-operative awareness and improves the mortality of the patient (Morimoto et al. 2005).
For the other side, the use of this monitor could be influenced by hypothermia and cerebral hypo-perfusion Artifact to EEG may increase the BIS value. When anesthetics concentration is altered, BIS sometimes does not variation between 30 and 40 or a paradoxical increase is observed. Harder stimuli could produce paradoxical arousal (Morimoto et al. 2005).
1.7.2 - Cerebral State Index
The Cerebral State Index (CSI) is a recently introduced EEG derived monitor. This monitor of depth of anesthesia determines an index from the raw EEG signals using an algorithm established on power analysis of the beta, alpha, and beta-alpha ratio. The monitor also evaluates the amount of instantaneous burst suppression (BS) in each 30-s period of EEG (Disma et al. 2009). EEG burst suppression consists of transient sequences of high voltage slow waves combined with sharp waves, alternating with periods of depressed background activity, and is encountered during the deep anesthesia (Schaul 1998). In experimental studies, the BSR has been applied as a measure of anesthetic depth (Vijn & Sneyd 1998).
The cerebral state monitor (CSM) is a compact battery-powered device, which has a wireless connection to a computer for data collection and analyses. The device is compact and so can readily be attached to the collar of conscious dogs. The CSM collects the EEG and electromyogram (EMG) and from the former calculates the cerebral state index (CSI) and the burst suppression ratio (BSR). The CSI is a numerical value based on analyses of the frequency of the EEG signal using a fuzzy logic classifier, whereas BSR is calculated as the percentage of an isoelectric EEG signal present during a 30-second period (Danmeter 2004).
The CSI has also been evaluated in humans (Rodriguez et al. 2004; Anderson et al. 2005) although published information is limited. Initial results from comparative studies with CSI show that the index is comparable with BIS, and can differentiate between the two lowest scales of an observer’s assessment of alertness and sedation (OAAS), indicating the two deepest levels of sedation (Bollen & Saxtorph 2006).
11 1.7.3 - Index of consciousness
1.7.3.1 - Definition of IoC
The index of consciousness (IoC) is demonstrated by the IoC-View. By using a logistic regression function oriented for indistinct rules which makes the bridge between the linear parameters (spectral analysis) and non-linear parameters (symbolic dynamics) from the raw EEG collected. The IoC-View, used to monitor the level of consciousness, converts the EEG samples into a series of symbols. The symbolic dynamics functions by dividing these EEG signals in a finite number of partitions and labeling each partition with a symbol. This method is, therefore, based on the variation of symbols. It consists on converting a time series into a symbol sequence. Through a space of sequences, this symbol sequence provides a model for the orbits of the dynamical system. This method is particularly important because it separates the non-linear and linear components of the EEG and could also distinguish the EEG from the EMG (Revuelta et al. 2008).
Moreover, besides the symbolic dynamics identify the EEG´s complexity, the Ioc-View also integrates the beta-ratio during the superficial anaesthesia and the amount of suppression of the EEG in a deeper stage. Then, these three factors are mixed through a discriminatory function defining the Index of Consciousness (Revuelta et al. 2008).
From the surface EEG are extracted three parameters, that is, the beta-ratio, the symbolic dynamics, and the ESR. Method used to calculate the IoC. SD, symbolic dynamics (0-30 Hz); Beta, beta-ratio (11-42 Hz); ESR, EEG suppression rate (equivalent to Burst Suppression) (Revuelta et al. 2008).
Figure 1.3 - Adapted from Morpheus Medical. This figure shows a representation of the IoC-view monitor.
Alarm Bluetooth IoC Index Index EEG Signal Battery indicator EMG bar % SQI bar ESR EEG scale
12 1.7.3.2 - IoC-view scale
The IoC-view is a continuous processed EEG parameter that correlates to the patient’s level of hypnosis where decreasing IoC-view values correspond to gradually loss of consciousness and a deepening of the level of anesthesia (User Manual of IoC).
Making use of a unitless scale from 99 to 0, when the monitor shows an index of 99 this indicates an awake patient and an index of 0 indicates a flat EEG. The IoC, like other monitor of depth´s anesthesia, the number of IoC should not be used as the unique parameter for adjusting the anesthetic dose. (Revuelta et al. 2008)
Table 1.1 The definition of the IoC scale vs The clinical state of the Patient
while awake and during anesthesia (Adapted from Morpheus Medical).
IoC Clinical state
99 80 Awake Sedation 60 40 General Anesthesia Deep Anesthesia 0 Isoelectric EEG
1.7.3.3 - Indications for use
The IoC-View has been designed to be used in the monitoring of the level of consciousness of a person during the application of general anesthesia or in intensive care. This is accomplished by registering the electroencephalographic signal (EEG) by means of surface electrodes which is then analyzed by a digital process. This monitor is commercialized by Morpheus Medical (Barcelona, Spain).
As a result of the applied calculation, an index “IoC” is obtained, which serves as guidance to the experts who use it to determine the level of consciousness of the patient during surgery (User Manual of IoC).
13 1.7.3.4 - How this monitor record the EEG?
The IoC-view monitor noted the EEG from three surface electrodes middle forehead (+), left forehead (ref ), and over left zygomatic bone ( Revuelta et al. 2008). In order to better understand, the EEG is recorded by placing two electrodes on the patient´s forehead and by placing a reference electrode on the cheek in an ordinary position (Silva and Antunes 2012). It is necessary take care with the skin, preparing it carefully before attaching the electrodes. Moreover, in order to avoid interferences the electrodes should not be in contact in any side (Revuelta et al. 2008).
1.7.3.5 - Electrode position
The IoC-view monitor requires a special position of the electrodes. So, it makes use of three silver–silver chloride surface electrodes on the face of the patient. The positive (+) is positioned middle forehead, the reference (ref) left forehead, and the negative (2) is positioned approximately 2 cm below the line passing the middle of the eye. The electrodes can be positioned on each side of the head.
1.7.3.6 - Signal quality Index SQI (range= 0-100)
The SQI is a measure of the signal quality for the EEG and it is calculated based on impedance data, artifact, and other variables. It is displayed in the form of a simple bar graph in blue located at the left of the display screen (User Manual of IoC).
1.7.3.7 - Electromyography
The monitor includes an EMG filter that eliminates most of the potential interfering EMG activity. The EMG bar shows the energy of the EMG level in the 30–45 Hz frequency band. The bar is situated on the left side of the display in blue color. EMG activity can increase due to:
(i) reflex reactions to painful stimuli during the procedure; (ii) need of muscular relaxation;
(iii) muscular rigidity.
The EMG bar should be checked frequently, especially in the case of a sudden increase in the IoC index. If the increase in the IoC is accompanied by an increase in muscular activity,
14
there is a risk that EMG is causing interference. When this happens, special attention must be paid to the clinical signs of the patient during surgery (User Manual of IoC).
1.7.4 - Narcotrend Index
The Narcotrend (MT Monitor Technik, Bad Bramstedt, Germany), is an electroencephalographic monitor designed to amount the effects of anesthetics on the brain in terms of ‘depth of anesthesia’. During the last years has been marketed in Europe. Like the Bispectral Index Monitor (BIS; Aspect Medical Systems, Natick, MA, USA), the Narcotrend accomplishes a computerized analysis of the electroencephalogram (EEG). The analysis of the EEG by this EEG monitor results in an index indicating the hypnotic component of anesthesia, the so-called Narcotrend Index (NI), ranging from 100 (fully awake) to 0 (very deep hypnosis). Otherwise, the monitor provides a categorical scale (Narcotrend stages A–F), which is more common than the NI, but less appropriate for scientific determinations (Webber et al. 2005).
The Narcotrend has been developed at the University Medical School of Hannover, Germany, and has been commercially available for 5 years and has, in the meantime, received US Food and Drug Administration approval (Kreuer & Wilhelm 2006).
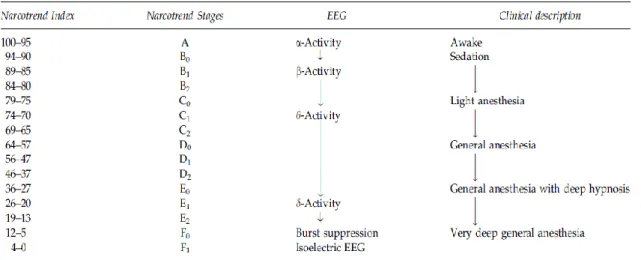
Table 1.2 - This table corresponds to an adaptation of Webber et al. 2005 and represents the Narcotrend Index and Narcotrend stages, corresponding important electroencephalogram (EEG) features, and clinical description.
Although The Narcotrend algorithm is based on pattern recognition of the raw electroencephalogram (EEG) and classifies the EEG traces into different stages from A (awake) to F (increasing burst suppression down to electrical silence).
15
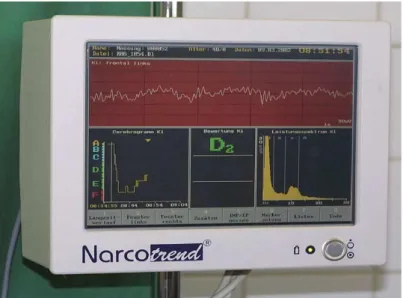
The latest Narcotrend software version includes a dimensionless Narcotrend index from 100 (awake) to 0 (electrical silence). The raw EEG signal can be recorded by standard electrocardiogram electrodes for single- and double-channel registration. The Narcotrend monitor provides a vast amount of information: the actual Narcotrend stage and index, the trend (‘cerebrogram’), the raw EEG signal and a power spectrum and several derived EEG parameters ( Kreuer & Wilhelm 2006 ).
Figure 1.4 - This figure corresponds to an adaptation of Kreuer & Wilhelm 2006 about The Narcotrend stage, actual value and trend (‘cerebrogram’) and raw electroencephalogram (EEG) signal, as well as a power spectrum and several derived EEG parameters.
Subsequently an automatic artefact analysis, the raw EEG signal is processed by the Narcotrend using a multivariate analysis algorithm and is then assigned to defined EEG stages. The Narcotrend algorithm is in part based on a classification of the sleep EEG and differentiates six EEG stages from A (awake) to F (burst suppression to down cortical silence), with 15 substages. In addition, a Narcotrend index is displayed with a range from 100 (awake) to 0 as had been shown in the table before (Webber et al. 2005).
16 1.7.5 - Spectral Entropy
The spectral entropy (E-Entropy, GE Healthcare, Helsinki, Finland) is a depth-of-anesthesia monitor derived from EEG. It has been developed to amount the effects of anesthetics on the neurophysiological function of the frontal cerebral cortex (Kaskinoro et al.2011).
This monitor measures irregularity in spontaneous brain and facial muscular activity. It uses an exclusive algorithm to process EEG and frontal electromyography data to produce two values that indicate the depth of anesthesia, response entropy (RE) and state entropy (SE). Highly irregular signals with variation of wavelength and amplitude over time produce high entropy values and may indicate conscious and alert state. More ordered signals with less variation in wavelength and amplitude over time produce low or zero entropy values, indicating suppression of brain electrical activity produced by deeper levels of hypnosis. The RE scale ranges from 0 (no brain activity) to 100 (fully awake) and the SE scale ranges from 0 (no brain activity) to 91 (fully awake). The target range for entropy values is 40–60. RE and SE values near 40 indicate a low probability of awareness with recall cortex (Kaskinoro et al.2011).
1.7.6 - Comparision between Monitors, advantages and disadvantages
Nowadays, an increasing number of monitors created to determine anesthetic depth is introduced into clinical practice. Evaluation of these monitors suggests many difficulties and is associated with the need to measure surrogate parameters, e.g. clinical endpoints such as loss of consciousness, reduction of recovery times or drug consumption. Temporarily, the bispectral index scale has been studied in a large number of investigations and must now be considered as the main competitor for all new devices developed in this field. The Narcotrend is a new EEG monitor, commercially available in Europe since 2000 and based upon a 6-letter classification of the depth of anesthesia from A (awake) to F (general anesthesia with increasing burst suppression). Kreuer et al. (2013) in his study indicate that increasing depth of anesthesia as measured by the BIS is accompanied by a corresponding effect as displayed by the Narcotrend stages. In a more particular way, during general anesthesia with BIS values between 64 and 40, the corresponding Narcotrend stages will be D or E in 93.5% of the cases. Furthermore, Kreuer et al. (2013) were able to demonstrate that even changes of one Narcotrend substage (e.g. from C2 to D0) were associated with a significant reduction of the corresponding mean BIS value (Kreuer et al. 2013).
17
Comparing the Bispectral Index (BIS; Aspect Medical Systems, Newton, MA) with Cerebral State Monitor (CSM; Danmeter, Odense, Denmark), which shows the cerebral state index (CSI), is a low-cost and compact alternative to the BIS. According to the respective manufacturers, both the CSI and the BIS are scored as 0–100, and they have the same target value ranges for adequate sedation during general anesthesia. The BIS employs a particularly complex algorithm that was developed from data collected on 1500 patients under anesthesia, while the algorithm for the CSI is based on a more straightforward Fourier analysis of the EEG. The CSI is calculated from raw EEG signals using an algorithm based on power analysis of the beta, alpha, and beta–alpha ratio in conjunction with an estimation of burst suppression. Due to these different calculation algorithms, these indices may be different during anesthesia (Nishiyama & Komatsu 2010).
1.8 - THE NONANESTHETIC FACTORS INTERFERING WITH THE EEG
Unfortunately, lack of cooperation, pain, anxiety or even aggressive behavior often prevents EEG examination in animals, and chemical restraint or anesthesia is necessary. Whichever agent is used, a dose-related slowing of the dominant frequency of the EEG and the loss of usual individual variability of the EEG activity is usually noted. Moreover, different drugs can produce widely different dominant EEG frequencies and peculiar EEG patterns. The available information on EEG patterns of normal dogs under anesthesia is controversial and unclear and data have been collected under different recording conditions, using various techniques and derived from dogs of different breeds, various ages and often unknown clinical story (Bergamasco et al. 2003).
Hypoxia
Hypoxia results from an inadequate delivery of oxygen to the cerebral cortex generating EEG. The initial stage of hypoxemia could be compensating by an increase in blood flow and it may not represent electroencephalographic alterations. If the hypoxemia becomes harder, further increases in flow are impossible and electroencephalographic changes occur. Those electroencephalographic changes are characterized by a loss in fast frequencies and increase in low frequencies. It is possible the abolishment of the EEG if the brain shuts down electrical activity and diverts all oxygen delivered to the maintenance of cellular integrity (Miller 2005).
18
Hypotension
Electroencephalographic alterations associated with hypotension can be identified, but when the hypotension is induced slowly and associated with changes in anesthetic drugs (e.g., use of isoflurane to reduce blood pressure), the changes are very difficult to interpret. Electroencephalographic changes are not very pronounced and are bilateral.
Hypothermia
Complete electroencephalographic suppression usually develops at 15°C to 18°C.
Hypercarbia and Hypocarbia
Hyperventilation activates excitable seizure foci, and in rare cases, it may produce electroencephalographic evidence of cerebral ischemia even in awake subjects. Hypoventilation, unless severe and associated with hypoxemia, has only indirect effects resulting from increased CBF. In the anesthetized patient, hypoventilation-associated increases in CBF may have effects similar to those seen with increasing end-tidal tension of volatile anesthetics.
1.9 - THE ANESTHETIC FACTORS INTERFERING WITH THE EEG
All anesthetic drugs used in anesthesia have different action in the EEG. In a more specific way, anesthetic drugs affect the frequency and amplitude of electroencephalographic waveforms. Although each drug class and each specific drug has some explicit, dose-related electroencephalographic effects, some basic anesthesia-related electroencephalographic patterns may be described. Subanesthetic doses of intravenous and inhaled anesthetics usually produce an increase in frontal β activity and abolish the α activity normally seen in the occipital leads in the awake, relaxed patient with the eyes closed. As the patient goes to sleep with general anesthesia, the brain waves become larger in amplitude and slower in frequency.
19 1.9.1 - Intravenous Anesthetics
Barbiturates, Propofol, and Etomidate
In spite of all different potencies and durations of action, all of the intravenous anesthetics cause the same electroencephalographic patterns. These drugs all follow the basic anesthesia-related electroencephalographic pattern, with initial activation followed by dose-related depression.
Ketamine
Ketamine does not follow the basic anesthesia-related electroencephalographic pattern. Anesthesia with ketamine is characterized by frontally dominant rhythmic, high-amplitude theta activity. Increasing doses produce intermittent polymorphic δ activity of very large amplitude interspersed low-amplitude β activity. Electrocortical silence cannot be produced with ketamine. Electroencephalographic activity may be very disorganized and variable at all doses. Ketamine has also been associated with increased epileptiform activity.
Benzodiazepines
Despite different potencies and durations of actions, benzodiazepines also follow the basic anesthesia-related electroencephalographic pattern. As a class, however, these drugs are incapable of producing burst suppression or an isoelectric EEG.
Opioids
As a class, opioids do not follow the basic anesthesia-related electroencephalographic pattern. In general, opioids produce a dose-related decrease in frequency and increase in amplitude of the EEG. If no further doses of opiates are given, α and β activity will return as drug redistribution occurs. Complete suppression of the EEG cannot be obtained with the opioids. Epileptiform activity occurs in humans and in animals receiving large to supraximal clinical doses of opioids.
20 1.9.2 - Volatile anesthetics
Isoflurane, Sevoflurane, Enflurane, Halothane and Desflurane
Potent inhaled anesthetics follow the basic anesthesia related electroencephalographic pattern. For example, isoflurane initially causes an activation of the EEG, followed by a slowing of the electroencephalographic activity that escalates with increasing dose. Isoflurane begins to produce periods of electroencephalographic suppression at 1.5 minimum alveolar concentration (MAC), which become longer with increasing dose until electrical silence is produced at 2 to 2.5 MAC. Sometimes, isolated epileptiform patterns can be seen during intersuppression activity at 1.5 to 2.0 MAC of isoflurane. Sevoflurane causes similar dose-dependent electroencephalographic effects. Equi-MAC concentrations of sevoflurane and isoflurane cause similar electroencephalographic changes.
Clinical studies have demonstrated that the EEG of inhalational anesthetic agents is influenced by age and baseline electroencephalographic characteristics. Older patients and those with electroencephalographic slowing at baseline were more sensitive to the electroencephalographic effects of isoflurane and desflurane. As anesthesia was deepened, similar electroencephalographic pattern changes were observed, but these changes occurred at lower end-tidal anesthetic concentrations (Miller 2005).
21
1.10 - OBJECTIVES OF THE THESIS
The objectives of this current thesis are to evaluate the performance of the Index of Consciousness as a tool to collect the electroencephalogram in dogs during recovering from general anesthesia in dogs submitted to general anesthesia with sevoflurane. Additionally, haemodynamic variables will be analysed and compared with the Index of Consciousness.
22
CHAPTER II – Material and General Methodology
2.1- PATIENTS AND HEMODYNAMIC MONITORINGAfter research committee approval and informed consent of the owners, ten healthy dogs were submitted to programed routine surgical procedures. Five involved in this study were female and were submitted to ovariohisterectomy. About the others animals: one was submitted to an orquiectomy, two were submitted to a nodulectomy, another one to a hemilaminectomy and the last one was submitted to a splenectomy.
The all dogs were admitted in the Centro Hospitalar Veterinário in the early morning and the firstly point observed were the physical examination, which consists on the mucosal examination such as color and time of capillary repletion, the blood rate, the respiratory rate and examination of the superficial nodes which includes the consistence and the size of those nodes. The temperature was measured and evaluated. Secondly, a blood sample was taken and after evaluated cell volume, total protein, blood urea, blood creatinine and a hepatic enzyme (ALT).
Furthermore, all dogs were considered healthy based on its clinical history, clinical examination and packed cell volume, total protein, blood urea, blood creatinine, ALT and an ASA score of one. No medications were administered prior to the study.
A cannula was inserted in the cephalic vein for drug and fluid administration. A three way stopcock was used to connect the intravenous catheter to the propofol and sodium chloride 0.9% delivery lines. A Braun infusion pump (Braun, Melsungen, Germany) was used for the administration of sodium chloride at a constant infusion rate of 10 ml kg hr-1 during the entire study period.
A S/5 Datex monitor (Datex-Ohmeda; Helsinki, Finland) was used for monitoring the hemodynamic parameters. The blood pressure was measured non-invasively in the cranial metatarsal region of the left hindlimb. Cuff width was choosing to be around 40% of circumference of the limb. The capnography and pulsioximentry were also monitorizied during the study.
23
Figure 2.1 – This picture shows a representation of the animal and some of the equipment used during the study presented. In the right side there is a representation of the S/5 Datex monitor. These pictures were gently offered by the Centro Hospitalar Veterinário in Oporto, 2013.
2.2 - CEREBRAL MONITORING
During this study has been used The IoC as a monitor of depth of anesthesia.
Figure 2.2 – Representation of IoC – View. This picture was gently offered by Centro Hospitalar Veterinário in Oporto, 2013.
24
The Ioc, frontal EMG activity and SQI data were collected every ten seconds from an IoC – View monitor (IoC, Morpheus medical, Barcelona – Spain).
2.3 – THE ELECTRODES PLACEMENT
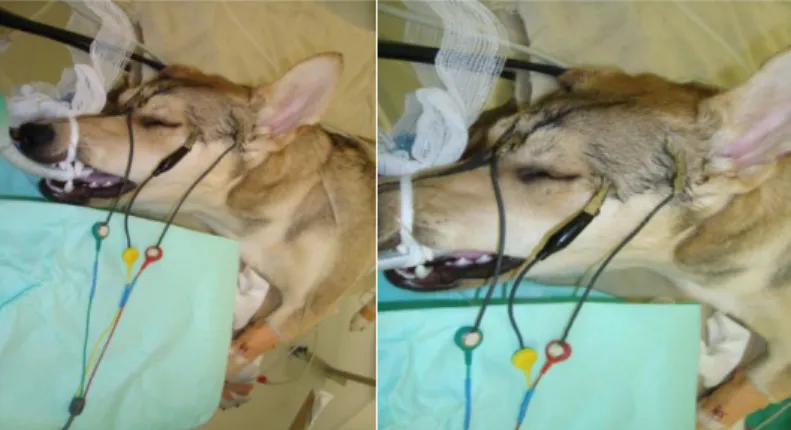
The electrodes placement was made according to the manufacturer´s instructions for human IoC monitoring, which was been explained in an previously chapter. In a more particular way in the middle of the forehead/frontal bone the positive electrode (+), to the left side of the forehead near the lateral eye socket the reference electrode (ref), and over left zygomatic bone the negative electrode (-). The EEG waveform was derived from the signal recorded between the positive and negative electrodes.
The type of electrodes used in the current study was not the original recommended by the manufacture. Earlier studies, performed by Anderson et al., show the possibility to replace the manufacture electrodes for ECG electrodes (Anderson et al. 2007) or, for the other side, Ribeiro et al. concluded that is possible the use of crocodile clamps to record the EEG achieving good values of impedance and the quality of the signal collected too (Ribeiro et al. 2009). So, a modified ECG cable with clamp electrodes was connected to the IoC cable. The use of ECG clamp electrodes facilitates the clinical use, by avoiding the necessity of shaving the dog´s head, and reduces the cost of EEG monitor (Seitsonen, Yli-Hankala et al. 2000; Akavipat, Dumrongbul et al. 2006). Before the application of the three clamp electrodes the skin was cleaned with alcohol 70% with 5 minutes before the data collection to allow drying and it has been used conductive gel in the interface between the skin and the electrodes, in order to promise good conditions in the data collected such as the signal acquired, artifact detections and the impedance produced between the skin and the electrodes.
Figure 2.3 – Representation of the electrodes placement: in the middle of the forehead/frontal bone the positive electrode (+), to the left side of the forehead near the lateral eye socket the reference electrode (ref), and over left zygomatic bone the negative electrode (-).
25
2.4 - HOW THE EEG DATA WERE RECORDED?
The electrodes used to record de EEG were connected to the IoC-view monitor by the Patient cable and the connection was established between the animal and the IoC-view monitor. All the data obtained with the IoC-view monitor could be sent via Bluetooth to a handheld or a PC where they could be presented and recorded. Although in this study, the data (IoC, SQI and EMG) were recorded manually, through the IoC-view monitor, each ten seconds.
The IoC firstly measures the impedance, which should be less than 5 kΩ according to the manufacturer, and the adequate values were between 1-3 kΩ. This value of impedance was measured automatically by the monitor when artifacts compromise the quality of the signal collected. When the impedance was checked by the monitor, the connection between the skin and the electrodes was evaluated by adding more conductive gel or putting back the electrodes. After established an adequate connection, values of the index of consciousness were collected, and at the same time values of EMG and SQI. The EMG represents the muscular electrical activity and the values were between 0 and 100%. The signal quality index measures the quality of the EEG signal acquired, which was directly relationship to the numbers of artifacts detected. In a more particular way, values of impedance of 1 kΩ acquired for the positive and negative electrodes without artifacts, represents a SQI of 100%. If the impedance increased at 5 kΩ, the SQI decreased gradually, and the ideal SQI of 100% won´t be reached.
2.5 - ANESTHETIC PROTOCOL
All dogs were premedicated with 1 mg/kg morphine sulphate (Morphine injection; Martindale Pharmaceuticals) and with 0.03 mg/kg acepromazine IM (Vetoquinol; Univete), thirty minutes before to the beginning of the induction of anesthesia. Anesthesia was induced with propofol 1% to performed traqueal intubation thereafter the anesthesia was maintained with sevoflurane until the end of the surgery.
After the end of the surgery the sevoflurane is off and we started to collect data from IOC (values of IoC, SQI and EMG), ETsevoflurane, FI Sevoflurane, blood pressure and heart rate every ten seconds. During this time period the CO2 was maintained between 35 mmHg and 45mmHg.
26
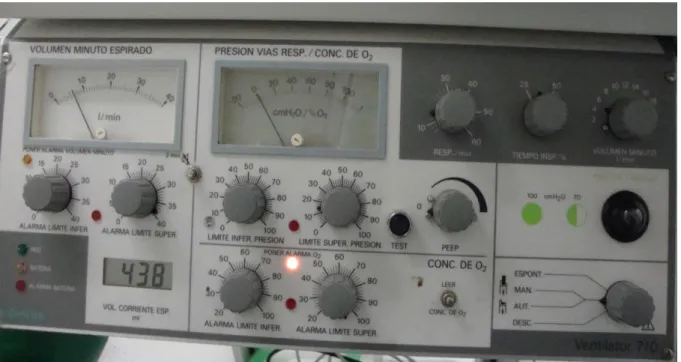
The dogs are under mechanical ventilation (Siemens Ventilator 710), during all the surgery and after the end of the surgery, until start to react to the ventilator, and are able to maintain to spontaneous ventilation.
The oxygen flow for mechanical ventilation during the collection of data was maintained between 100-200 L/min in a closed breathing circuit.
Figure 2.4 - This picture represents the mechanical ventilator (Siemens Ventilator 710) used during this study. This picture was gently offered by Centro Hospitalar Veterinário.
2.6 - STATISTICS
Data was tested for normal distribution and for homogeneity of variance using the Shapiro Wilk and the Levene tests respectively. The IoC and Et sevoflurane data, collected at ten-second intervals after the end of surgery, were compared using Spearman Rank correlation analysis. Statistical analysis was performed using SPSS v.13.0 for Windows. Data are expressed in mean±sd; P<0.05 was considered statistically significant.
27
CHAPTER III - Results
Ten mixed-breed dogs, five of which female, aged 3.9 ± 3.0 years and weighing 11.0 ± 3.5 Kg were analysed (table 3.2). The physical examination was performed and all of the animals were in healthy conditions to be enrolled in the study.
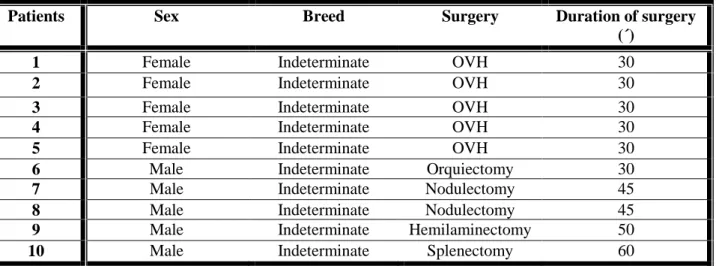
Table 3.1 - Description of the ten animals according to their sex, breed, surgery submitted and mean duration of the surgery.
Patients Sex Breed Surgery Duration of surgery
(´)
1 Female Indeterminate OVH 30
2 Female Indeterminate OVH 30
3 Female Indeterminate OVH 30
4 Female Indeterminate OVH 30
5 Female Indeterminate OVH 30
6 Male Indeterminate Orquiectomy 30
7 Male Indeterminate Nodulectomy 45
8 Male Indeterminate Nodulectomy 45
9 Male Indeterminate Hemilaminectomy 50
10 Male Indeterminate Splenectomy 60
Legend: P – Patient, OVH – Ovariohysterectomy; ´: minutes.
All the respiratory, haemodynamic, analytics and temperature baseline values (before anaesthetic pre-medication) are displayed in the table 3.2.
Table 3.2 - Respiratory, haemodynamic, analytics and temperature baseline values (before anaesthetic pre-medication for each individual patient.
Legend: bpm: beats per minute, rpm: respirations per minute, ALT: alaninaaminotransferase; FA: fusfatase alkaline; BUN: urea; mg/dl: miligram per deciliter; ºC: degrees celsius; SD: standard deviation; Temp: temperature; Creat: creatinine.
Patients Heart Rate (bmp) Respiratory rate (rpm) MAP Temp (ºC) ALT FA BUN Creat (mg/dl) 1 110 30 103 38.5 70 65 10 1.0 2 130 32 90 39 70 50 20 1.0 3 100 30 83 39.2 80 60 23 1.2 4 96 30 93 39 100 100 12 1.0 5 100 28 100 38 77 110 12 0.9 6 100 32 105 38.1 65 80 18 1.0 7 98 35 103 38.2 110 90 20 0.9 8 120 35 100 38.5 110 100 15 1.21 9 98 32 83 39.2 85 65 12 1.0 10 120 35 105 39.3 110 75 18 1.4 Mean ±SD 107.2± 12.04 31.9± 2.47 96.5± 8.64 38.75± 0.5 87.7± 18.15 79.5± 19.92 16± 4.40 1±0
28
The SQI is a measure of the signal quality index for the EEG and it is calculated based on impedance data, artifact, and other variables. In this study The SQI collected is 100±0.
The EMG filter eliminates most of the potential interfering EMG activity, and in this study is 43.75± 34.7.
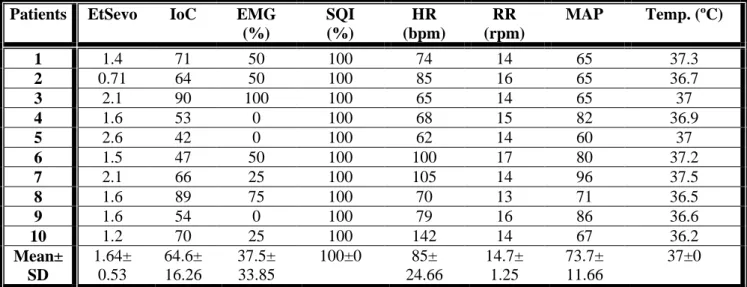
Table 3.3: Values obtained from each individual patient in the beginning of the study (moment when the volatile anesthetic administration was stopped).
Patients EtSevo IoC EMG (%) SQI (%) HR (bpm) RR (rpm) MAP Temp. (ºC) 1 1.4 71 50 100 74 14 65 37.3 2 0.71 64 50 100 85 16 65 36.7 3 2.1 90 100 100 65 14 65 37 4 1.6 53 0 100 68 15 82 36.9 5 2.6 42 0 100 62 14 60 37 6 1.5 47 50 100 100 17 80 37.2 7 2.1 66 25 100 105 14 96 37.5 8 1.6 89 75 100 70 13 71 36.5 9 1.6 54 0 100 79 16 86 36.6 10 1.2 70 25 100 142 14 67 36.2 Mean± SD 1.64± 0.53 64.6± 16.26 37.5± 33.85 100±0 85± 24.66 14.7± 1.25 73.7± 11.66 37±0
Legend: P – Patient, ET Sevo – End-tidal of Sevoflurane, IoC – Index of consciousness, SQI - Signal quality Index, EMG - Electromyography, HR – Heart rate, RR – Respiratory rate, MAP - Mean arterial pressure, Temp – Temperature, ºC: degrees celsius.
The data recorded at awakening in each individual patient is displayed in table 3.4
Table 3.4: Values obtained from each individual patient in the moment of awake. The time since stopping the sevoflurane administration and the awakening is also showed.
Patients EtSevo IoC EMG (%) SQI (%) HR (bpm) RR (rpm) MAP Temp. (ºC) Time to wake up (´´) 1 0.54 88 75 100 110 20 65 37.5 270 2 0.17 83 25 100 120 22 70 37.3 300 3 0.16 58 0 100 100 25 65 37.2 140 4 0.47 88 25 100 92 15 80 37.1 430 5 0.10 95 0 100 98 17 65 37 440 6 0.22 94 100 100 120 20 75 37.4 380 7 0.49 90 0 100 96 15 88 37.6 170 8 0.47 94 75 100 75 15 65 36.6 280 9 0.72 91 85 100 82 18 75 36.6 240 10 0.59 90 25 100 134 12 79 36.3 290 Mean± SD 0.39± 0.21 87.1± 10.83 41± 38.79 100±0 102.7± 18.31 17.0± 3.90 72.± 8.04 37.06± 0.43 294± 100.02
Legend: : P – Patient, EtSevo – End-tidal of Sevoflurane, IoC – Index of consciousness, SQI - Signal quality Index, EMG - Electromyography, HR – Heart rate, RR – Respiratory rate, MAP - Mean arterial pressure, temperature and Time to wake up.
29
The trend in mean arterial pressure and in heart rate during the entire anaesthetic procedure is displayed in figure 3.1.
Figure 3.1- Trend in heart rate and mean arterial pressure during the beginning of the anaesthetic procedure
until the moment of the individual patient waked up.
Figure 3.2 represents the trend in the IoC and in Sevoflurane concentrations during the study period. The correlation between these two variables is displayed in figure 3.3.
Figure 3.2 - Trend of IoC and End-tidal Sevoflurane (%) from the beginning of the study until the animal waked up. The blue colour corresponds to the among serie of values about IoC and the red colour represents the serie of values about Etsev.
30 50 70 90 110 130 150 0 0 0 0 0 30 30 30 33 35 37 45 48 50 60 min HR MAP 0 0,5 1 1,5 2 2,5 0 20 40 60 80 100 1 2 3 4 5 6 7 Etsev IoC minutes