A Work Project, presented as part of the requirements for the Award of a Master Degree in Finance from the
NOVA – School of Business and Economics.
WIRELESS HIGH SUSTAINABLE GROWTH
CATARINA LEITE DE CASTRO ANACORETA
CORREIA 23801 & RITA DE CARVALHO E SOUSA
PINTO DA SILVA 33831
A Project carried out on the Master in Finance Program, under the supervision of:
Nuno Quartin Bastos de Vasconcelos e Sá
Abstract
This is an equity research on Verizon Communications. Verizon is a
telecommunication company that operates mainly in the
US, being one of the leaders of this market. Moreover, the
company’s revenue is primarily driven by its wireless
service, which represents around 70% of its total revenues.
Moreover, we are also presenting an overview of the company’s business, the
industry of telecommunications, the financial
performance of the company and the risks our valuation
may face.
Verizon
Wireless service
Telecom drivers
5G impact
This work used infrastructure and resources funded by Fundação para a Ciência e a Tecnologia
(UID/ECO/00124/2013, UID/ECO/00124/2019 and Social Sciences DataLab, Project 22209), POR
Lisboa (LISBOA-01-0145-FEDER-007722 and Social Sciences DataLab, Project 22209) and POR Norte
(Social Sciences DataLab, Project 22209).
MASTER IN FINANCE
THIS REPORT WAS PREPARED EXCLUSIVELY FOR ACADEMIC PURPOSES BY CATARINA CORREIA AND RITA SILVA, BOTH MASTER IN
FINANCE STUDENTS OF THE NOVA SCHOOL OF BUSINESS AND ECONOMICS.THE REPORT WAS SUPERVISED BY A NOVA SBE FACULTY
▪ We are currently issuing a BUY recommendation given
our YE20 price target of $66.90 per share, corresponding to a
general upside of 10% compared to the current price. We believe
the market is underestimating Verizon’s growth opportunities.
▪ Verizon’s total revenue grew 3.83% in 2017 and 1.85% in
2018 and it is expected to grow 3.62% in 2019 showing no signs of slowing down mainly due to wireless.
▪ 5G technology will provide a significant opportunity for
growth in the wireless service in 2020 and beyond. Although,
Verizon is expected to continue experience losses in wireline, we
do not see it as a threat to the company’s revenue growth.
▪ Valuation: We modelled the YE20 target price using a DCF
model, forecasting Verizon’s revenue and using a WACC of 6.86% and a terminal growth rate of 3.35%. Our forecasting period goes until 2028, from where we assume Verizon’s revenue will stabilize. ▪ Key risks: 1) Increased competition; 2) Ineffective digital
growth and diversification strategy; 3) Changes in regulatory environment; 4) Uncertainty of Capital Expenditures
▪ Company description
Verizon Communications, Inc. (VZ) is a telecommunication
company leader in the sector. The company provides products
and services through its two most important segments: wireline and wireless, being the last one the segment that drives most of Verizon’s revenue.
V
ERIZON
C
OMMUNICATIONS
I
NC
.
C
OMPANY
R
EPORT
TELECOMMUNICATIONS
3
JANUARY2020
S
TUDENTS:
CATARINA ANACORETA CORREIA;
RITA PINTO DA SILVA
[email protected] [email protected]
Wireless high sustainable growth
The 5G fever
Recommendation: BUY
Price Target FE20: 66.90 $
Price (as of 2-Jan-20) 61.05 $
Reuters: VZ.N, Bloomberg: VZ
52-week range ($) 52.28-62.22
Market Cap ($m) 252,490
Outstanding Shares (M) 4,136
Expected shareholder return (%) 14 %
Source: Bloomberg: Company reports: Analysts estimates
Source: Bloomberg
(Values in $ millions) 2018 2019E 2020F
Revenues 133,281 138,103 142,410
Wireless 91,734 93,624 96,418
Wireline 29,760 29,452 29,666
Corporate and Other 9,369 9,368 9,471
EBITDA 44,460 49,863 48,573
EBITDA Margin 34% 36% 34%
EBIT 22,372 28,913 27,412
Net Income 15,120 19,055 18,196
Net Debt 111,907 106,494 100,382
Source: Company reports: analysts estimates
80.0 85.0 90.0 95.0 100.0 105.0 110.0 115.0 120.0 125.0 130.0 SPX Index VZ US Equity
VERIZONCOMMUNICATIONSINC. COMPANY REPORT
Table of Contents
EXECUTIVE SUMMARY ... 3
COMPANY OVERVIEW ... 3
COMPETITORS ... 6
BOARD OF DIRECTORS AND SHAREHOLDERS STRUCTURE ... 7
VERIZON STRATEGY ... 8
RISKS TO ACHIEVING THE TARGET PRICE ... 9
THE SECTOR ...10
THE INDUSTRY ... 10
▪ Wireless service ... 11
▪ Wireline service ... 12
TELECOM: WHAT SHOULD WE EXPECT FOR THE FUTURE ... 12
REVENUE MODEL ...13
VALUE DRIVERS ... 14
▪ Wireless services estimation ... 14
▪ Wireline services estimation ... 16
▪ Corporate and other revenue estimation: ... 16
GOODWILL AND WIRELESS LICENSES ...17
FINANCIALS ...18
VALUATION ...20
DISCOUNTED CASH FLOW (DCF) ... 20
MULTIPLES ... 22
SCENARIO ANALYSIS ... 23
SENSITIVITY ANALYSIS ... 24
FINAL VALUATION REMARKS ... 25
APPENDIX ...26
REVENUE VALUE DRIVERS ... 26
FINANCIAL STATEMENTS ... 27
VERIZONCOMMUNICATIONSINC. COMPANY REPORT
Executive summary
Verizon is one of the leader players in the market of telecommunications, information and entertainment products and services offered to its clients, which can be either consumers, business companies or governmental agencies, operating in more than 150 countries.
The company is currently investing in 5G, with an expected Capex for 2020 of $17.5 billion. This investment is expected to be monetized in 2020, where the company views opportunities to growth.
In what regards Verizon’s future, the company expects to invest in different sources of revenues, driven primarily by 5G. The wireless segment, the most important source of revenues for the company, is predicted to follow its current
trend and continue to increase at a CAGR1 of 3.75%.
Company overview
Headquarter in New York, United States, Verizon Communications was created in June 30, 2000. This company is a result of a merger between Bell Atlantic Corp and GTE Corp, being one of the most important business mergers in US. Verizon began trading on the New York Stock Exchange (NYSE) under the VZ symbol on Monday, July 3, 2000. It also began trading on the NASDAQ exchange on March 10, 2010. The company had 144,500 employees as of December 31, 2018 and serves millions of costumers every day, principally in the
USA market.
This company has been the leader of the new network technology (5G) wireless
technology industry, being the first in the world to launch the 5G Home2. During
2018 these capital investments reached a value of $1.7 billion. Moreover, in 2018, it is important to highlight that Verizon generated $34.3 billion in Cash
Flow from operations, comparing to $24.3 billion in 2017 and $21.7 billion in
2016. In 2018 Verizon also reached 118 million wireless retail connections,
4.5 million videos subscribers, 6.1 million Fios internet subscribers and 1.03% churn rate in wireless services retail post-paid. The churn rate is the
average percentage of customers who terminate their monthly subscription of the company’s services and it has been relatively stable over the past few years, consistently remaining under 1.5%, which represents a benchmark in the sector.
Corporate Sustainability is also another relevant point where Verizon is taking
action. In fact, Verizon’s efforts on sustainability are in the first page of the proxy
1 Compound Annual Growth Rate
2 5G Home is the latest high-speed technology for managing a home’s Wi-Fi, music, between others
Exhibit 1: Verizon 4G LTE coverage are map (as of 10/19/2018)
Source: Company website
$21.70 $24.30 $34.30
Cashflow from operations
2016 2017 2018
Exhibit 2: VZ cashflow from operations (Values in $ billions)
VERIZONCOMMUNICATIONSINC. COMPANY REPORT
2019 statement of the company. Verizon is committed to reducing environment impact by reducing waste and supporting recycling. Verizon is also investing on renewable energy, which the company wants to represent 50% of its total electricity usage by 2025.
In terms of Revenue, Verizon’s revenue comes from three sources: Wireless, Wireline and Corporate and other.
In the Wireless segment, Verizon serves wireless communication products and services across an exhaust network in the US, in a post-paid and pre-paid basis. Wireless segment is divided in wireless service revenue, Equipment revenue and other. Wireless revenues accounts for the major part of Verizon’s revenues: 69.3% in 2018, 68.6% in 2017 and 70.0% in 2016. Wireless’ total operating revenue was $91.7 billion, an increase of 4.8%, during 2018 compared to 2017, principally as a consequence of increases in equipment and other revenues. However, this was compensated by a fall in service revenues.
The decrease in service revenue can be explained by the decrease in the company’s ARPU, which affects the average return per user in the wireless service. The company is trying to compensate this fall by increasing in Equipment revenue. In fact, equipment revenue increased 17.8%, during 2018 compared to 2017. This was a consequence of a shift to higher priced units in the various devices sold.
In the Wireline segment, the company sells communications products and enhanced services, such as video and data services, corporate networking solutions, security and network services and local long-distance voice services. Wireline segment represented 22.5% of Verizon’s total revenues in 2018, 24.0% in 2017 and 23.9% in 2016. The Wireline segment operating revenues for the year of 2018 was $29.8 billion, a decrease of 3.0%, compared to the year of 2017. This decrease is explained principally by a decreases in traditional voice, network and HSI services as a consequence not only of technology substitution and competition, but also as a decreases in demand for traditional linear video. This revenue segment is driven by two sources: Fios Revenues and other. Fios is an Internet access, telephone and television service that operates in a fiber-optic communications network. Fios allows people to enjoy a much faster speed than wireless or broadband. Verizon currently offers this Fios in ten different states in the US.
Exhibit 3: VZ Wireless revenue (as % of total revenue)
Source: Company reports
Exhibit 4: VZ Wireline revenue (as % of total revenue)
Source: Company reports
70.0% 68.6% 69.3% Total Wireless 2016 2017 2018 23.9% 24.0% 22.5% Total Wireline 2016 2017 2018
VERIZONCOMMUNICATIONSINC. COMPANY REPORT
Fios revenue is driven by: Fios internet subscribers, Fios video subscribers
and Fios digital voice subscribers. With this, we computed a Fios ARPU,
which was our main driver for the forecast.
Fios revenues reached a value of $11.9 billion, during 2018 compared to $11.7 billion during 2017. During 2018, Fios Internet subscriber increased by 3.7% and Fios Video subscriber base fall by 3.6%, compared to 2017. This decrease can be explained by the increased demand in higher broadband speeds and the ongoing shift from traditional linear video to other offerings. Moreover, service
revenues attributable to voice declined 8.5% in connections. The decline in
voice connections is principally a result of competition and technology
substitution with wireless, competing voice over Internet Protocol with and cable telephony service. For the future, we see Fios revenue increase as a percentage of a forecasted ARPU, based on past year by year data.
Finally, Corporate and other is the results of Verizon media business (the Oath brand), and other businesses, investments in unconsolidated businesses, unallocated corporate expenses, pension and other employee benefits related costs and interest and financing expenses. This segment also includes historical results of divested business and other adjustments not allocated to any
assessing segment. Moreover, Verizon Media, combines Yahoo! Inc.’s operating business with Verizon’s pre-existing Media business, and includes diverse media and technology brands that servers people around the world.
Corporate and other revenues in 2018 reached a value of $10.9 billion in 2018, an increase of 16.6% when comparing to 2017. This segment represents around 8.2% of Verizon’s revenues in 2018, 7.4% in 2017 and 6.1% in 2016. Corporate and other revenues increased principally due to an increase of $1.7 billion in revenues of Media business, branded Oath, as a result of the acquisition of Yahoo’s on June 13, 2017. This increase was compensated by the sale of 23 customer-facing data center sites in the U.S. and Latin America in the Wireline segment in May 2017.
As an overview, Verizon’s consolidated revenues are increasing throughout the years. Verizon consolidated revenues in 2018 were $130.86 billion, comparing to $126.03 billion in 2017 and $125.98 billion in 2016. We believe Verizon will continue to increase its revenues in the future, and the decrease in wireless ARPU will be offset by the increase in USA wireless subscribers, impacted by the new network: 5G.
When analysing future revenue drivers, we believe Verizon will monetize the
investment in 5G and find new sources of revenues. In fact, new telco services, due to 5G, Internet of Things (IoT), mobile payments and cloud services, will
Exhibit 5:VZ Corporate and other revenue (as % of total revenue)
Source: Company reports
Exhibit 6: VZ Operating Revenue (Values in $ millions)
Source: Company reports
6.1%
7.4%
8.2%
Corporate and Other
2016 2017 2018
$125,980 $126,034
$130,863
Operating Revenue
VERIZONCOMMUNICATIONSINC. COMPANY REPORT
have a relevant impact in 2020-23' total number of subscribers, which affects Verizon’s wireless services.
Competitors
The telecommunications industry is extremely competitive. Since Verizon has its massive operations in the United States we have considered its competitors to be the ones operating there.
Verizon primarily competes with other regional wireline and wireless service providers. As of today, in the United States, there are four mobile service providers usually described by the industry observers as “nationwide”: AT&T, Verizon, T-Mobile and Sprint. Though none of these service providers has a network covering the entire US land and population, each has a network covering a considerable portion of both and therefore we considered these three service providers to be the main competitors of Verizon. Verizon and AT&T are much larger than the others and benefit from scale advantages and better resources. In fact, AT&T in terms of operating revenues is the biggest of the four, followed by Verizon.
Besides, its rivals include several smaller regional providers, virtual mobile network operators, including Charter Communications, Inc., TracFone Wireless, Inc., Comcast Corporation and many of whom provide or plan to provide no-contract, prepaid and postpaid service plans. Competitors also include
companies offering similar forms of communication, such as data services, voice and messaging, using other tools or services.
Market saturation, customer experience, types of service and product, pricing, network investment and efficiency, technology development and deployment, and the availability of additional spectrum licenses are among the competitive factors in the telecommunications industry.
Verizon’s wireless market share3 of 35% as of 2018 surpass its competitors such
as AT&T (34%), T-Mobile (18%), and Sprint (12%). Indeed, the company’s largest and most longstanding competitor is AT&T. Extra competition comes from T-Mobile, which has a lower market share but has been attracting customers faster than any other network, and Sprint, which has introduced aggressive price promotions to move its shrinking market share.
3Market share was determined based on the size of a company relative to the total size of the industry. The size of each company and industry was measures using key metrics such as revenues and connections/subscribers.
Exhibit 7: Total operating revenues of VZ and its main competitors (Values in $ billions)
Source: Companies reports
35%
34% 18%
12%
1%
Verizon AT&T T-mobile Sprint Others
Exhibit 8: Wireless market share of VZ and its main competitors (Q3 2018)
Source: Company reports, eMarketer
2016 2017 2018 Verizon 108.6 107.1 108.5 AT&T 163.8 160.5 170.8 T-mobile 37.5 40.6 43.3 Sprint 33.3 32.4 33.6 0.0 20.0 40.0 60.0 80.0 100.0 120.0 140.0 160.0 180.0
VERIZONCOMMUNICATIONSINC. COMPANY REPORT
A service provider's churn rate4 depends on many factors such as the customer
satisfaction with their service provider, cost of switching service provider, and the competition.In 2018, Verizon had the second lowest churn rate in the
wireless segment when comparing to its main competitors (1.03%).
One of facts that Verizon and AT&T are considered very attractive companies are their dividends (T-mobile and Sprint do not currently pay a dividend). In the past ten years, Verizon has raised its dividend by nearly 32%, while AT&T has seen a slower growth rate of 24%. Currently, Verizon has a dividend yield of 4.03%, while AT&T has a yield of 5.36%. Another thing worth considering is that
Verizon’s Return on Investment (ROI) is more than double than AT&T’s
(also bigger than Sprint and T-mobile ROI) meaning it is more important for the company to keep to reinvest its earnings than to distribute them to its
shareholders. Long-term, this must yield higher returns and growth for
Verizon.
Nevertheless, Verizon Communications, Inc. is the largest wireless
communications service provider in the United States. According to the latest findings from the country's most comprehensive and empirical network
monitoring - RootMetrics5 - the gap between Verizon’s network performance and
other national wireless providers continues to grow. Verizon won, for the 12th consecutive time, RootMetrics’ overall network performance award across six categories: overall performance, reliability, speed, data, call and text.
We believe telecommunication industry is an industry with companies with global presence, which increasingly compete with Verizon’s businesses. In this sense, Verizon’s revenue may be affected by this intensified competition, that creates brand recognition and customer loyalty. Therefore, we think Verizon will still improve its services and the investment in 5G will allow the company to still be one of the reference players in the market, maintaining its market share, but since the market growing, Verizon’s revenues will grow too.
Board of directors and shareholders structure
Hans Vestberg is the chairman (since March 2019) and chief executive officer of Verizon Communications (since August 2018). Vestberg has focused ondelivering seamless experiences for costumers over network assets. Moreover, he invested in 5G, believing in its potential for the company.
Verizon ownership is significantly diluted, with no shareholder holding
4The churn measures the number of connections that are disconnected from mobile wireless service during a given period time period.
5 Rankings based on the RootMetrics US National, State, and Metro RootScore Reports: 1H 2019 1.0%1.1% 1.0%1.1%
1.2%
1.0%
1.8% 1.9%
2017 2018
Verizon AT&T T-mobile Sprint
Exhibit 9:Postpaid Wireless churn rate of VZ and its main competitors
Source: Companies reports
13.9% 8.1%9.0% -0.8% Verizon AT&T T-mobile Sprint
Exhibit 10:ROI of VZ and its main competitors as of Q3 2019
Source: Companies reports
Holder
% of Total Shares Outstanding The Vanguard Group, Inc. 7.88% BlackRock, Inc. 7.59% State Street Global
Advisors, Inc. 3.95%
Capital Research and
Management Company 2.85% W ellington Management
Group LLP 2.78%
Exhibit 11: Largest shareholders of Verizon as of 30/09/2019
VERIZONCOMMUNICATIONSINC. COMPANY REPORT
investors, mutual funds, hedge funds and institutions. Largest shareholders are Vanguard Group Inc (with 7.88%), BlackRock Inc (with 7.59%) and State Street Corp (3.95%). In fact, institutional shareholders with 67.64%, followed by public investors with 32.28% and finally individual shareholders, with only 0.03% of the company.
Verizon Strategy
Verizon has been investing in a strategy to improve and maintain its products and services updated, having the objective of guaranteeing user engagement and being able to monetize it. This strategy involves: (1) huge investments in
capital, to acquire and improve wireless services and provide additional growth
in its networks. In fact, for 2019 Verizon plans its investment to be in the range of $17.0 billion to $18.0 billion, continuing to invest in the 5G network and in fiber optic network to support the business, improving technology and data systems. From Q3 results, we can see that Verizon already invested $12 billion in capital expenditures. We believe that investments in networks and platforms will lead to innovative and updated services and products, which will make Verizon
delivering competitive products and services (2): improving customer
satisfaction (as pointed out in the annual meeting of shareholders and proxy
statement). This strategy involves gaining customer trust and responsible business practices. With this, Verizon could maintain its old clients and retain the new ones. Following this point, Verizon is also investing in customer driven models, based on customer needs. (3): Verizon will continue to be a leader in
5G, growing its Network as a Service solutions. At an investors conference,
Verizon’s CEO together with the company’s leadership team, reinforced its mission to deliver the best 5G network experiences to its customers and also delivering continued value to shareholders. Moreover, revenues from 5G Mobility and 5G Home will begin to scale in 2020 and the investment in 5G will be monetized in 2020, with new revenue opportunities. (4) Investing and growing
in Verizon Media. As an example, in 2017, Verizon acquired Yahoo as an
important acquisition for increasing its market presence with Verizon Media. In this segment, Verizon strategy highlighted in its 2018 annual report is built on providing consumers with owned and operated search properties and finance, news, sports and entertainment offerings and providing other businesses and partners access to consumers through digital advertising platforms. (5) in February 2019 Verizon’s meeting with investors, the company introduced a
long-term constant leverage target. And lastly (6) Verizon plans to reach a $10 billion cost savings plan: $1.0 billion in 2018, $3.0 billion in 2019 and $6.0
billion in 2020. This cost initiative passes through migrating customer service to Huge investments in capital Improving customer satisfaction Contnue to be a 5G leader Investing in Verizon Media Long term constant leverage target Reach $10 billion cost saving plan
Exhibit 12: Verizon Strategy for the future
Source: Company report, Verizon Investors Meeting
VERIZONCOMMUNICATIONSINC. COMPANY REPORT
an online platform, improving and automating some process, a zero-based budgeting and one change from multiple networks to 1 virtual network as a service: a software upgrade with enhanced purchasing power.
Risks to Achieving the Target Price
Verizon performed very well, and we expect it will continue to do so.There are,
however, some key threats that could compromise our outlook and predictions on the operations of Verizon if confirmed. Therefore, it is important to look at and dig into the risks that explain each one to provide a broad perspective of this
investment.
The effects of competition in the markets in which Verizon operates
As mentioned before, Verizon has the strongest market share of the US mobile
and wireless connectivity market. According to a study6 done in telecom,
competition is responsible for about 23.4% of total price decline in the past ten years. We expect the competitive landscape to have stabilized relative to the past few years, but to the extent, there is an increase in the competition, it could pressure our estimates and rating.
Ineffective digital growth and diversification strategy
According to Industry surveys done by EY, digital services are the top priority for telco leaders. On the other hand, generating growth from these services remains a challenge. As 5G moves to a centre stage some assumptions regarding revenues growth were made that may not be verified.
Changes in the regulatory environment
Reinforced by regulations such as the General Data Protection Regulation (GDPR), consumers’ worries about how their online data is used continue to escalate. Besides, given that digital trust is nowadays a hot topic for consumers and enterprises alike, and regulators prioritizing data protection, telcos such as Verizon face challenge of guaranteeing that the data and experiences of its consumers are safe and secure. Although Verizon works hard to protect personal information that they collect and store, no system is 100% secure, and they cannot guarantee that their security will prevent any unauthorized attempt to access, use or reveal personal information. This matter may affect negatively Verizon.
VERIZONCOMMUNICATIONSINC. COMPANY REPORT
Uncertainty of capital expenditures
According to GSMA (entity that represents the interests of mobile network operators worldwide), global wireless carriers have invested more than $1.3 trillion in their wireless networks since 2010. This is due primarily to the
deployment of 4G wireless technology. Analysts predict that the investment in 5G could prove to be significantly higher than prior generations mainly because carriers need new wireless spectrum, deeper fiber backhauls, particularly in key urban markets, and substantially more cell sites to deliver the benefits of 5G. Nevertheless, the returns generated on the invested are uncertain and may not be verified which represents downside risk to our estimates.
The Sector
Verizon Communications is part of the telecommunications industry, where all telecommunications companies and internet service providers belong. This industry is made of companies that transmit data into words, voice, audio, and video in a global way, where the growing in video, text and data is being higher than the growing in voice.
In terms of clients, Verizon competes not only with other big players, but also with providers of small number of telecommunications and integrated services with global operations. Verizon competes with these providers for large contracts to provide integrated services to global enterprises. Many of these companies have strong market presence, brand recognition and existing customer relationships, all of which contribute to intensifying competition that may affect Verizon future revenue growth.
The industry
The telecommunication sector, which includes fixed-network services and mobile services, had a value of around $1.4 trillion in 2017, and it is forecast to grow to
almost $1.46 trillion in size by 20207, being the biggest markets for telecom
services the Asia/Pacific region, Europe and North America. In fact, during the past decades, the telecommunications industry had showed a rapidly growing, with the new technological developments, government initiatives and economic growth. These developments created new opportunities for companies, and the competition between companies also increased. To follow this changing environment, these companies needed to develop or acquire technological resources. With this, many companies, in a strategic way, followed an acquisition or a partnership with local companies, such as Verizon did.
7 Delloite (2019). 2020 Telecommunications Industry Outlook
159 161 161 160 158 158.5 159 159.5 160 160.5 161 161.5 2017 2018 2019 2020 CAPEX
Exhibit 14: Capital expenditures of the mobile industry worldwide from 2017 to 2020 (Values in $ billions)
Source: eMarketer, Statista
15,904 17,500 15,665 16,430 16,065 11.9% 12.7% 11.0% 11.2% 10.5% 10.00% 12.00% 14.00% 16.00% 18.00% 20.00% 14,000 15,000 16,000 17,000 18,000 2018 2019F 2020F 2021F 2022F
Net Capex % revenue
Exhibit 13: Verizon Capex (Values in $ millions)
VERIZONCOMMUNICATIONSINC. COMPANY REPORT
Additionally, is a sector where services spending has showed some critical values, with a forecasted value of $1.625 billion for 2019, growing 0.63% when comparing to 2018, and $1.645 billion for 2020, an increase of 1.23%. These values are expected to follow this tendency until 2023, where the sector’s
services spending is predicted to reach a value of $2.655 billion8. Therefore, in
our valuation we forecasted that Verizon will continue to present high values of capital expenditures, in the range of $16 and $20 billion between 2017 and 2028. We believe that the pattern for future growth will be primarily driven by 5G. With new revenue opportunities, 5G is appearing as a revolution for this sector, by its potential impact on IoT, voice assisted technology, Mpayments and Mhealth. The 5G impact will impact telecoms principally in 2020 and beyond. As so, our valuation is impacted since 2020 until 2023 with 0.25% increase in total wireless carriers’ subscribers USA, due to the 5G impact. We believe 5G will impact telecom companies until 2023, and after that the market will continue to increase, but at a stable rate.
The telecommunications market is segmented into wired telecommunication carriers, wireless carriers, communications hardware manufacturers, satellite and communication resellers. To offer these services, there are small numbers of large companies with significant market share, called the players. Moreover, the smallest, but fastest growing area of this sector is wireless communications, as more communications and computing methods shift into mobile devices and cloud-based technology. Due to this high and effective competition, we
forecasted that Verizon will maintain its wireless market share of 35% from 2019 and beyond. However, this does not mean that Verizon is not growing. As the market is growing, even having the same market share, Verizon can capture more clients, which will make the company grow also.
▪ Wireless service
Wireless technology involves transmitting data and voice through wireless spectrum that is dispersed from surrounding towers. In order to acquire spectrum telecoms need to go through licensing auctions that are held by the FCC (Federal Communications Commission) or through secondary market transactions with other wireless carriers. The big focus in the wireless segment is data, with 4GLTE being the fastest speed available. The launch of 5G is expected to be 50 times faster than 4G.
The wireless industry is mature, and its services are strongly marked by its big
4 companies: Verizon, AT&T, T-Mobile and Sprint. Sprint, which is merging with
VERIZONCOMMUNICATIONSINC. COMPANY REPORT
T-Mobile, is considered the cheapest wireless carrier. These four companies have suffered years of strong competition when it comes to wireless service, but
competition has been stabilizing and revenue is returning to growth since 4Q
2017.
The forecast spending on worldwide wireless telecom for 2019 is expected to achieve $904 billion, compared to $887.4 billion in 2018. By looking at the above values of telecom spending, we can see that this service represents around 50% of the total industry.
Moreover, the number of mobile subscriptions is increasing worldwide, with a value of 8.160 million in 2018, being LTE, until now, the technology most used, and China the country with more subscriptions in 2018. For the future, we can see that 5G technology will appear and start to grow from 0.16 million
subscriptions in 2021 to 1.3 million in 2023. Wireless industry has already achieved a 90% penetration rate amongst adults, and we predict that this will reach 100% in the future.
▪ Wireline service
The wireline industry offers voice and data services through a vast infrastructure that spreads across the whole country. This segment targets mainly the business market since they need higher levels of data sharing and transmission.
In the past years, the US wireline phone sector have lost a significant number of customers to wireless. In order to tackle this critical situation, the wireline
operators have been witnessing a surge in consolidation among major players in order to attain economies of scale with respect to fiber optic cable networking and cloud-based network services.
As we believe the wireline segment have small growth opportunities, our valuation forecasts a stable wireline revenue of around $29 billion, since 2018 until 2028. In fact, since 2014 that this revenue has been decreasing, showing a fall of 9% between 2014 and 2018.
Telecom: what should we expect for the future
S&P Global Ratings9 forecasts a global telecom revenue growth of 2% - 3%
throughout the year of 2019. We believe this revenue growth is driven primary by broadband, as the demand for high speed data continues to growth. Therefore, the opportunities will arise in the wired telecommunication carriers, which will gain $338.8 billion of global annual sales by 2022.
9 S&P Global Ratings (2020). Industry Top Trends 2020: Telecommunications? $887
$904
2018 2019F
Exhibit 15: Wireless Telecom worldwide spending (Values in $ billions)
VERIZONCOMMUNICATIONSINC. COMPANY REPORT
Moreover, we expect a downfall of fixed and mobile satellite services, as they may be replaced by newest and faster satellite technology, which leads to pricing pressure and oversupply of capacity. In addition, according to this source, it is necessary for the cable companies to still upgrade its infrastructures, which should result in increase in speeds and capacity. For wireline companies, the best option for more densely populated markets is to replace the copper wire with
fiber (which can be very expensive). Additionally, Deloitte10 expects changing
market conditions and consumer preferences, which we expect to be
continuing creating opportunities for telecom companies.
Moreover, we also predict a decrease in companies’ ARPU, which impacted
our valuation. This is a consequence of providers offering lower prices for telecom plans. In our Verizon’s forecast we can see this decreasing in ARPU thought the years, which we believe will be compensated by other sources of revenue.
Moreover, the latest EY Global Capital Confidence Barometer reflects the continuing importance of M&A tendency in this industry, as it will lead to improvement in operational efficiency. Following this source, 55% of telecom executives expected to actively pursue acquisitions in the next 12 months (Information dated at 28 May 2019). Additionally, this source points out for the fact that the reviews in companies’ portfolios are increasing. In fact, 41% of telecoms nowadays undertake a review every quarter, which can be compared to 24% in October 2018. Therefore, new opportunities of transformation are being created, and companies are reshaping their portfolios to offer better and customized services.
Revenue Model
Since 2016 until 2018 Verizon’s total revenue increased approximately 4% per year, and in the first 9 months of 2019 already reported, Verizon reached
$97 billion, comparing to $96 billion last year. These $97 billion are already
approximately 74% of what we are forecasting for the company to achieve for the all year of 2019.
Verizon also added 610,000 retail post-paid net additions in its wireless
business during the third quarter of 2019, up from 295,000 a year earlier,
and 615,000 post-paid smartphone net additions, an increase from 510,000. These values are on top of the subscriber additions Verizon recorded in the second quarter, which were already also higher than forecasts.
10 Delloite (2019). 2020 Telecommunications Industry Outlook
Retail post-paid net additions in wireless
Post-paid smartphone net additions 610,000
615,000
Exhibit 16: Third quarter of 2019 post paid and prepaid net additions for Verizon
VERIZONCOMMUNICATIONSINC. COMPANY REPORT
In our revenue model we started by forecasting the total number of subscribers in the wireless carrier market in the USA, as this is the primer source of revenue for Verizon. Moreover, we also predicted Verizon market share and Verizon’s churn rate, which was important for having Verizon’s market presence in the USA and how this impacts revenue. Post-paid net additions are also value drivers from Verizon, which will impact the wireless ARPU. With all this information, we created our revenue model for wireless services, which is better explained in the next section. For the wireline services estimation, we forecasted Verizon Fios ARPU, which could be done be using past data and research from the sector
Value Drivers
▪ Wireless services estimation
The wireless carrier’s market is measure as a prime source by the number of
subscribers. Moreover, the market tendency differs between countries
depending on populations, economic development and technological adherence. Therefore, the first variable to be estimated is the number of total subscribers of
wireless subscribers’ market in the USA. After looking at the past information11
available we made a forecast prevision for the same.
Note that, as Gillet (2012) explains, not all subscribers drive directly revenue. Active connections, corresponding a percentage of subscribers, drive directly revenue to Telco’s companies. We call this a conversion rate. In Verizon, the conversion rate is around 80% in past years, showing a decrease tendency. We forecast this variable continuing this tendency.
Another important variable to estimate revenue in Verizon’s wireless segment is its position in the market. We firstly computed Verizon’s market share in terms of USA total wireless subscribers. It is seen that the market as whole is growing thought-out the years with Verizon’ market share remaining stable. We expect a stable market share at approximately 35% for the years to come. In fact, it’s seems that Verizon’s peers are also investing in 5G, and there is no reason to believe that Verizon will be successful in gaining market share in the near future. From the market, measured in number of wireless subscribers, from the
remaining stable of Verizon market share and using a stable conversion rate, it was possible to estimate the total number of Verizon wireless connections for the years to come.
Within wireless Verizon connections, we can find prepaid retail connections and post-paid retail connections, with the former being much more relevant. In fact,
11Fierce Wireless (2019). How Verizon, AT&T, T-Mobile, Sprint and more stacked up in Q3 2018: The top 7 carriers 106,528 108,796 110,854 113,353 5,580 5,447 5,403 4,646 0 20,000 40,000 60,000 80,000 100,000 120,000 2015 2016 2017 2018
Retail postpaid connections Retail prepaid connections
Exhibit 17: VZ subscribers (thousands)
VERIZONCOMMUNICATIONSINC. COMPANY REPORT
during the year of 2018, the number of prepaid retail connections was 4,646 million compared to 113,353 million of post-paid retail connections.
As many analysts are saying, and as it’s seen directly through its annual reports,
Verizon is systemically losing prepaid retail connections. In fact, since 2014
until 2018, prepaid retail connections lost on average 6% connections per year. We assume that this decrease tendency will remain.
Moreover, Post-paid connections behaviour through the years depend on two
important variables: the (1) churn rate, that is the number of lost connections divided by last period total connections, and the (2) number of new clients. Recent Verizon announcements are in the direction of maintaining the churn rate in the future. In fact, in the last annual report, Verizon says the company believes experience of matching the unlimited plan with its high-quality network, that continues to attract and retain higher value retail post-paid connections.
So, in order to meet grow market number with a remain stable market share, the strategical number for Verizon in the future will be the number of new
connections.
Verizon is actively investing in 5G. This will permit the firm to improve services rendering to its clients. In Verizon’s investors meeting in February 2019, 5G was presented as a new opportunity for enable new experiences and as a new network that accelerates business customers’ digital transformation, creating a new growth for Verizon.
We therefore assumed an impact (0.25%) on the total number of subscribers driven by 5G and multiple new services in 2020, 2021, 2022 and 2023. In fact, in Verizon’s investors meeting in February 2019 it was presented that the 5G will begin to scale and make impact in 2020, and still contribute to growth in 2021 and beyond. A remaining stable market share of Verizon means that Verizon will capture this increase in market for the following years.
The ARPU is other important variable when analysing Verizon’s revenue. We computed this past ARPU taking into account Verizon total number of retail connections and Verizon’s wireless service revenue. We got a past ARPU that was decreasing throughout the years. As already said, telecom companies are
suffering a decrease in its ARPU, and this trend is to continue. Therefore, as
telecom companies are offering more services for a lower price, we believe there will be a continuous decrease of Verizon’s wireless ARPU.
With this, our wireless revenue forecast grows from $93,624 million in 2019 to $135,251 million in 2028, which represents a CAGR of 3.75%.
52.38 48.57
45.25 44.51
2015 2016 2017 2018 ARPU ($)
Exhibit 19: VZ ARPU Growth ($)
Source: Company reports
91,734 93,624 96,418 99,559 103,222 107,502 112,130 69% 71% 71% 72% 72% 73% 74% 0% 10% 20% 30% 40% 50% 60% 70% 0 20,000 40,000 60,000 80,000 100,000 120,000 2018 2019F 2020F 2021F 2022F 2023F 2024F Total Wireless % of Total Revenues
Exhibit 18:VZ wireless revenue (Values in $ millions and as % of total revenue)
VERIZONCOMMUNICATIONSINC. COMPANY REPORT
▪ Wireline services estimation
In the Wireline segment, Verizon have experienced continuing access line losses as customers have disconnected both primary and secondary lines and switched to alternative technologies such as wireless, VoIP and cable for voice and data services. In Verizon 2018 annual report, the company expects to continue to experience access line losses as customers continue to switch to alternate technologies. Moreover, we believe Fios Internet connections will grow at the same pace as verified in the past (average of 4%) as the company seeks to increase its penetration in Fios service areas. In Fios video, the business continues to face ongoing pressure as observed throughout the linear television market, so we expect its subscribers to decrease by 0.5% from 2020 onwards. Therefore, to get the wireline forecasted revenue, we firstly got past data from Fios video, internet and digital voice subscribers. With this data, and with the total Fios revenue we were then able to calculate a Fios ARPU.
As said above, Verizon expects to continue growing its Fios Internet connections. This increase will compensate the decrease in Fios video. In fact, Fios Video
business continues to face ongoing pressure. Assuming Verizon’s video
tendency and what Verizon expects for the next years, we forecasted this line by
computing a future Fios ARPU for the wireline segment.
Therefore, we forecast a revenue for Wireline services for the year of 2019 of $29,452 million, and it grows until $29,882 million in 2028. We believe that this segment will remain with a stable revenue of around $29 billion.
▪ Corporate and other revenue estimation:
In this Media business, Verizon Media, which operated in 2018 under the “Oath” brand, is primarily focused on digital advertising products. Verizon is focused on returning to revenue growth by implementing initiatives to realize synergies across all of its media assets, a strategy already implemented, and building services around its core content pillars. Moreover, Verizon is experienced growth in mobile usage and video products and see this trend to continue.
As pointed out in the latest annual report, although we believe this segment will grow, Oath brand is experiencing high pressures and competition which have resulted in a loss of market positioning to Verizon competition in the digital advertising business. These pressures are expected to continue. In order to forecast this segment, and since this revenue is directly linked with Verizon core operations, we calculate the weight of Corporate revenues as a percentage of both wireless and wireline segment and assumed this ratio would decrease 0.10% year by year. 29,760 29,452 29,666 29,850 29,701 29,558 29,573 22% 22% 22% 21% 21% 20% 19% 0% 5% 10% 15% 20% 25% 29,200 29,300 29,400 29,500 29,600 29,700 29,800 29,900 2018 2019F 2020F 2021F 2022F 2023F 2024F Total Wireline % of Total Revenues
Exhibit 20: VZ wireline revenue (Values in $ millions and as % of total revenue)
Source: Company reports, Analysts estimates
9,369 9,368 9,471 9,591 9,719 9,884 10,077 7.0% 7.1% 7.0% 6.9% 6.8% 6.7% 6.6% 0% 1% 2% 3% 4% 5% 6% 7% 8% 9,000 9,200 9,400 9,600 9,800 10,000 10,200 2018 2019F 2020F 2021F 2022F 2023F 2024F Corporate and Other % of Total Revenues
Exhibit 21: VZ corporate and other revenue (millions of $ and as % of total revenue)
VERIZONCOMMUNICATIONSINC. COMPANY REPORT
Goodwill and Wireless licenses
Verizon’s Goodwill and Wireless Licenses are both intangible assets with a significant value (they represent about 50% of Verizon’s total assets). These
intangible assets are not amortized, but instead are tested annually in the 4th
fiscal quarter for impairment, if there are no events requiring an earlier impairment test.
As a result of Wireless Licenses mandatory impairment tests done in 2018, 2017, 2016, and 2015 the value of these licenses exceeded their carrying value and, therefore, did not result in an impairment. This information is given on the annual reports of 2016, 2017 and 2018, which were audited by Ernest & Young LLP.
For forecast purposes, considering that there is no relevant information from which its expectable a significant decrease in the wireless license value, we expect no impairment for this intangible in the forecast.
For the Goodwill value related with different reporting lines we found some relevant issues for the forecast. The balance of Verizon’s goodwill is allocated among four reporting segments: Wireless unit, Wireline unit, Media unit and Connect unit. For the mandatory tests performed in 2018, 2017, 2016 and 2015 for Wireless and Connect reporting units, both fair values significantly exceeded (as reported by Verizon in its audited financial statements) their respective carrying value for the impairment tests. Therefore, we did not forecast an impairment charge for this two reporting units in the future. However, the mandatory goodwill impairment tests of 2018, 2017 and 2016, for the Wireline reporting unit, resulted in a fair value that exceeded goodwill carrying amount by 5%, 14% and 20%, respectively, from which we can expect, given the declining tendency, a decreasing value on this unit in the near future. Additionally, even the management do not believe in a reverse tendency towards recuperation. In fact, as said in Verizon’s annual report 2018, probably imposed by its auditors, “the management believes there is an increasing risk that Wireline reporting unit may be required to recognize an impairment charge in the future”. So, we strongly believe that in the near future we will assist an impairment loss on this unit resulted by the mandatory annual impairment test on allocated goodwill. Therefore, we forecast, for the year of 2019, an impairment charge, in result of the impairment test for the Wireline reporting unit, of 50% of its value, and an impairment charge of the remaining value for the year of 2020. Moreover, for the Media reporting unit, the fair value exceeded goodwill carrying amount by more than 20% in 2017. In 2018 an impairment charge caused by the goodwill
94,130
95,930
98,860
Wireless Licenses
2018 2019F 2020F
Exhibit 22: Wireless Licenses (Values in $ millions)
VERIZONCOMMUNICATIONSINC. COMPANY REPORT
impairment test was accounted for the Media reporting unit. As the increased competitive and market pressures that caused this impairment charge are expected to continue, we forecasted an impairment goodwill charge, of the remaining media unit value, in 2019.
When forecasting, we were aware that Verizon records goodwill and acquired intangibles when the price it paid for an acquisition exceeds the target’s book value. Therefore, we set the revenue growth from acquisitions equal to zero and held the goodwill constant at its current level. For the wireless licenses, as this number has been increasing and it is predicted to increase by the Verizon’s Board, we made it as percentage of forecasted revenues. This treatment is consistent with the wireless licenses value dependency on Verizon´s revenues, as these licenses provide the exclusive right to use certain radio frequency.
Financials
Since 2005 until 2018, excepting in 2008, Verizon showed a positive net income with the highest value in 2017, when Verizon reached a net income of $30.1 billion. For the future, after forecasting revenue and costs according to past and future information, we reach out positive profit, which makes us believe the company will continue to be financial solid.
For the future, we see Verizon creating value for shareholders by investing the
cash flows generated in opportunities that support profitable growth,
thereby increasing customer satisfaction and usage of our products and services. In fact, the ROIC from investments forecasted shows values between 71%
and 76%. Verizon also used its cash flows to maintain and grow its dividend
payout to shareholders. Verizon’s Board of Directors increased the Company’s quarterly dividend by 2.1% during 2018, making this the twelfth consecutive year in which have raised its dividend. Verizon goal is to continuing using cash to create long-term value for our shareholders. Therefore, Verizon will continue to invest its cash flow in critical opportunities for growing, to make its balance sheet strong and to pay dividend to shareholders.
We also expect for 2019 Verizon to present non-GAAP EBITDA of $49,863
million, a YoY growth of 12%. This represents an EBITDA margin of 36%,
comparing to 34% in 2018. Verizon expects to its consolidated operating
income margin and adjusted consolidated EBITDA margin to remain strong.
Moreover, since the value of acquisitions of wireless licenses have been
increasing (and will increase in the future, as it is said in Verizon’s Annual Report
24,614
22,479
20,543
Goodwill
2018 2019F 2020F
Exhibit 23: Goodwill (Values in $ millions)
VERIZONCOMMUNICATIONSINC. COMPANY REPORT
2018), we forecast a 0.5% growth year by year of the average of Wireless licenses (% Revenues).
Relevant Ratios
In order to measure Verizon’s ability in accomplishing its debt obligations without the support of external capital, we calculated the most important liquidity ratios. Looking at the short-term liquidity of the firm, Verizon showed a consistent capability in meeting all short-term obligations during the last 5 years. In fact, both the current ratio and the quick ratio were increasing throughout the last years so it’s not expected that Verizon will meet liquidity short term problems in the near future.
For this reason, we did not estimate extra financing needs besides the one that derived from the equilibrium of the balance sheet and is implicit on the
estimations made. In fact, according to the forecast model used, and the estimations of the drivers, we can see that the decreasing tendency of debt to equity ratio is maintained in the near future.
To analyse how well Verizon uses its operational net assets, we computed some
efficiency ratios. Verizon asset turnover is being stable in approximately 50%,
meaning that there isn’t a loss of efficiency in using assets to generate revenue during the last five years. However, the company should be aware about its cost efficiency since EBITDA margin is decreasing since 2014, suggesting that measures in improving efficiency should be taken.
Due to this fact, we believe that Verizon is implementing important cost savings (as said, indeed, in its 2018 annual report) so we forecasted improving cost efficiency of 2% in 2020 and 0.8% three years beyond.
Regarding solvency, the debt to equity ratio is decreasing throughout the years, meaning that the capital structure of the firm is becoming less dependent on debt. We believe that this tendency will continue, and we assist a consistent tendency on debt to equity in our projections.
Moreover, two coverage ratios were analysed. The Debt to Ebitda ratio shows that in average Verizon takes 2.6 years in paying its debt using its Ebitda. Moreover, the Ebit to interest ratio indicates that Verizon can generates value through its assets of an average of 4.6 times over its interest expense. These two ratios show that the company is in a healthy shape, when looking to external financing. Considering these values, we believe that in the near future no restructuration on debt or in own capital is needed and current debt conditions in
Liquidity ratios 2016 2017 2018 Current Ratio 1.04 1.10 1.23 Quick Ratio 0.84 0.94 0.99 Efficiency ratios 2016 2017 2018 Asset Turnover 0.52 0.50 0.50 Ebitda Margin 0.36 0.35 0.34 Solvency ratio 2016 2017 2018 Debt to equity 4.23 2.54 2.01 Coverage ratios 2016 2017 2018 Debt/Ebitda 2.47 2.68 2.59 Ebit/interest expense 6.70 5.81 4.63
Exhibit 24: Liquidity ratios
Source: Company report
Exhibit 25: Efficiency ratios
Source: Company report
Exhibit 26: Solvency ratio
Source: Company report
Exhibit 27: Coverage ratios
VERIZONCOMMUNICATIONSINC. COMPANY REPORT
terms of spread could be expected. We reflect these expectations in our projections.
Finally, when looking to Verizon Balance sheet it is seen that intangibles assets represent about 50% of the company total assets. This is a material risk issue as in an event of a huge impairment on these assets, derived from strategical errors, the company could face some problems in sustaining its Balance sheet. Because all business model of Verizon derived from intangibles, we believe that Verizon would sustain this ratio in the future and reflected it in our projections.
Reformulation assumptions
As Wireless devices payment plan agreements are purchased to costumers, under a program that they pay lower service fees when comparing to normal service plans, we considered them operational, but noncurrent. The same allocation was done to the Wireless licenses, which ones provide Verizon with the exclusive right to utilize certain radio frequency spectrum, to provide wireless communication services. When analysing the liabilities, deferred income taxes occur in the normal business activity, but not in a current way.
Moreover, other assets were considered to be nonoperating, as they include deposits to the segregated accounts and debt securities. Finally, other liabilities include Contract liabilities. This contract arises when Verizon bill its customers and receive consideration in advance of providing the goods or services promised in the contract, which was assumed nonoperating and noncurrent.
Valuation
In order to value Verizon, we used two different models: Discounted Cash Flow Model and the Multiples approach.
Discounted Cash Flow (DCF)
Using a DCF approach, Verizon was valued with a WACC of 6.86% and a terminal value growth rate of 3.35%, achieving a weighted-average value per share at a YE 2020 of $66.90. Our model assigns a buy recommendation to
Verizon at a YE 2020 target share price, which represents an expected return of 14% to its current share price of $61.0512 including the expected dividend yield
of 4.03%.
VERIZONCOMMUNICATIONSINC. COMPANY REPORT
g real
1.94%
US TIPS
0.13%
Implied inflation
1.75%
Nominal GDP g
3.72%
GDP growth rate
Using the DCF, we discounted the Unlevered Operating FCF’s for an explicit forecast period of 8 years (2021-2028) and the perpetual value of operations as of 2029 at the estimated WACC.
The 3.35% growth rate of Operating FCF’s was based on our estimates of the historical return of Verizon on invested capital (ROIC) and the Reinvestment Rate (RR). We calculated a ROIC of 10.43% in our terminal year of 2028. Given that the ROIC is greater than the WACC, we can conclude that Verizon is in fact
creating shareholder value.
In order to guarantee that there was consistency with the inflation rates, we compared this growth to the nominal annual average growth of global GDP
between 2028 and 2060 of 3.72%, incorporating the inflation expectations we
arrive by computing the difference between US 10 year Government bonds and US 10 year Treasury Inflation Protected Securities. This means that Verizon will keep almost the same weight in the overall economy.
The value of the discounted operations corresponds to $112,534 million and the terminal value is $284,148 million, corresponding to 75% of the total value of the company. We summed to the terminal value the expected non-core assets and
liabilities as of 2020 and subtracted the Financial Debt (both market values
were assumed equivalent to book values).
The number of shares outstanding is 4,136 million and no share issues or repurchases are expected. The division between Common Equity and Shares Outstanding gives the share price. The correspondent equity value is $276,699 million in comparison to an equity value of $252,490 million as of 2nd January
202013.
In what concerns the WACC, some assumptions had to be made, such as that debt/equity ratio is constant, and the statutory tax rate and risk of new projects were also assumed constant. Regarding Debt to Equity ratio, although historically the percentage of debt to equity has been decreasing throughout the years, we assumed it would remain constant from 2019 onwards since the company introduced a long-term leverage target in its meeting with the investors on the 21st of February of 2019. This allowed Moody's to change Verizon rating outlook to positive from stable (April 2019). Given this, we were able to use a single
WACC for all CFs.
Our cost of equity of 8.54% was computed using CAPM method14. The risk-free
used to input into CAPM’s formula was considered the last observed value of US
13 Bloomberg (02/01/2020)
14 CAPM: Risk Free + Beta unlevered * (Market Risk Premium)
Exhibit 28:GDP growth rate estimation
VERIZONCOMMUNICATIONSINC. COMPANY REPORT
Table 1- Data used to compute Verizon’s Unlevered Equity Beta
Source: Companies reports, Bloomberg
Company name Market Cap (in $m) Debt (in $m) E/(E+D) D/(E+D) Beta of equity Unlevered Equity Beta Verizon 254,475 145,772 64% 36% 0.62 0.39 AT&T 286,648 117,360 71% 29% 0.66 0.47 Charter Communications 119,202 76,158 61% 39% 1.12 0.68 T-Mobile 66,085 21,280 76% 24% 0.67 0.51 Comcast 205,171 107,748 66% 34% 0.99 0.65 CenturyLink 14,631 19,440 43% 57% 1.24 0.53 Average 0.52
10-year government bond (US10YGOV) of 1.88%15. To this we added the
relevered beta of 1.11 multiplied by the market risk premium suggested by
common literature of 6.0%16.
The beta we considered was computed using the weighted average17 unlevered18
rolling (3 years) beta of the industry peers of 0.52 which include AT&T, Charter Communications, T-Mobile, Comcast and CenturyLink. To this value we summed
Verizon’s unlevered beta debt19 to get a theoretical Unlevered Beta for Verizon
that is 0.71.
After that, we had to re-lever the computed beta to Verizon’s target debt-to-equity ratio using the current market values as proxy (58%). We arrived to a
relevered beta of 1.11.
The after-tax cost of debt of 3.93% was calculated with the probability of default
and the loss given default20. The Yield (5.84%) was computed by doing the sum
of the risk-free rate with the spread according to Verizon’s credit rating Baa1 according to Moody’s. According to the Annual Default Study done by Moody's, measured by post-default trading prices the issuer-weighted average recovery rate for senior unsecured bonds was 53.9% in 2017 and the probability of these bonds to default was 1.87%.
The target mix between debt and equity was expected the same as the current market values. Considering all these assumptions, we arrived at a WACC of
6.86%.
Multiples
We also computed a multiple valuation in order to see Verizon’s value relative to the market perception on the other companies that we see as comparables. For
15 Bloomberg (27/12/2019)
16 Copeland, T. E., Koller, T., & Murrin, J. (2005). Measuring and Managing the Value of Companies. McKinsey & Company.
17 Market cap for each company used as a correspondent weight 18 β
U = (E/ (E+D))*βE + (D/ (E+D))*βD
19 Beta debt was calculated using CAPM 20 R
d = Yield to Maturity - Prob(default) * Expected Loss Rate
Exhibit 13: WACC estimation
Source: Bloomberg, Mckinsey Valuation, OECD, Analysts estimates
Market return 9.08%
Risk-free rate 1.88% Market risk premium 6.00% Unlevered Beta 0.71 Unlevered Cost of Capital 6.11% Relevered beta 1.11 Cost of Debt 4.98% Cost of Equity 8.54%
D/EV 36.42%
E/EV 63.58%
1-Statuatory Tax Rate 79.00%
WACC 6.86%
VERIZONCOMMUNICATIONSINC. COMPANY REPORT
this analysis we used the following comparable: AT&T, Charter Communications, T-Mobile, Comcast Corporation and CenturyLink. We decided to exclude Sprint since its financials differ a lot when comparing to Verizon.
We were able to retrieve from Bloomberg data from eleven comparable firms. Chosen multiples were EV/EBITDA, EV/EBIT and EV/Revenue and were computed based on the information from the year of 2018. After multiplying Verizon’s expected EBITDA, EBIT and Revenue of 2019 by each of the ratios, our median of the mean equity value across multiples was of $65.43, which is
above its current price of 61.05$21. Nevertheless, we believe that Verizon should
be more valuable than many of other companies from the telecom industry due to its market share and the fact it was the first to launch on the market the 5G. These growth opportunities are not all linked to the telecommunication industry, and that is why we consider that the DCF valuation captures the value of VZ in a more appropriate way.
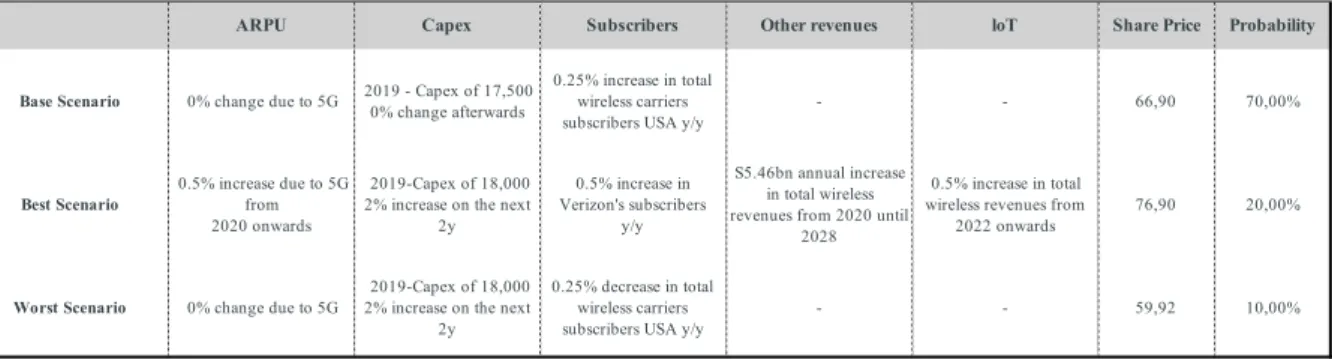
Scenario analysis
Verizon’s valuation is dependent on four variables that are not only under Verizon’s control, which are: the churn rate, the 5G impact, the market share
and the ARPU. These four variables are dependent not only on the company’s
efforts to be successful, but also in Verizon’s competitor’s behavior. Therefore, we computed three scenarios so to analyze the risk that our assumptions carry on. Our base scenario is the one we shown in the report and the one we believe it is more probable to happen (60%). Both the best and worst case scenario were weighted with the same probability of 20%.
In the worst case scenario (20%), we assumed zero 5G impact, an increase of 0.5% in churn rate given the possibility of Verizon not rolling out 5G at the same time as its competitors and a continuous decrease for Verizon’s ARPU as it has been verified in the past. We also revise downwards our expectation regarding Verizon’s market share from 35% to 34%. With all these assumptions, we get a
share price for YE 2020 of $58.37, which still represents a downside of 4% from
the current share price. Summing it with the expected dividend yield would give investors a positive return of 4% but it would change our recommendation to hold.
Finally, our best-case scenario (20%), considers an increase of 0.5% 5G impact above our base model, a decrease of 0.5% in churn rate assuming that Verizon
will be able to mitigate its churn22, an ARPU maintenance since 2019 and an
21 Bloomberg (02/01/2020)
22 Verizon Investor meeting presentation, 2019
Exhibit 29: Multiples valuation
Source: Bloomberg (27/12/2019)
Median Multiple Implied
Share Price
EV/ EBITDA 8.8x 76.45 EV/EBIT 16.7x 63.51 EV/Revenue 2.6x 56.33
Scenario Probability Share Price
Worst Case 20% $ 58.37 Base Case 60% $ 66.90 Best Case 20% $ 80.41
Average $ 67.90
Exhibit 30: Scenario Analysis
VERIZONCOMMUNICATIONSINC. COMPANY REPORT
increase of 1% in Verizon’s market share. With these assumptions, we get a
share price for YE 2020 of $80.41, which is an upside of 32% from the current
share price, highlight our buy recommendation.
Considering the probabilities of each scenario, we get a target price YE 2017 of
$67.90 per share which would reiterate our initial buy recommendation.
Sensitivity Analysis
In addition to computing the scenario analysis, we conducted a sensitivity analysis of our model to see and analyze the impact a change in a specific input would have on our target stock price. All these analysis were applied to the price we got in the DCF model.
Risk free/ Default spread
The risk-free rate is a crucial metric in our valuation model since it affects both the cost of debt and the cost of equity. In fact during the past five years, the US10YGOV has vary between a maximum of 3.23% (5/10/2018) and a minimum of 1.36% (8/07/2016). In order to determine the default spread we used a current Verizon bond with the same maturity as the 10-year US treasury bond. Since we believe the credit rating of Verizon won’t change, we chose to keep the spread consistent. Nevertheless, we decided to apply a sensitivity analysis of the price
obtained in the DCF relative to the risk free and to the default spread.
What we see from the analysis of the price relative to both these assumptions is that the price is sensible to variations of both values, varying between $44.93 and $77.21 per share. Given an 1.9% risk free rate, even though the default spread might change it wouldn´t change our recommendation of the target price.
RR/ ROIC
We also did a sensitivity analysis of the price relative to the ROIC and to the
Reinvestment Rate (RR) since they are the ones determining our perpetual
growth rate. In this analysis, the RR was tested to vary 1% and the ROIC 0.25%. What we can conclude is that, again, the price is sensible to variations of both values, varying between $60.31 and $75.5 per share. The price of $60.31 reflects a decrease of 10% from our target price and might change out our
recommendation.
ARPU/ Market share
Since both ARPU and the market share are assumptions that highly influence the wireless service revenue, we wanted to see the target stock price volatility that would happen from modifying both them. In fact, in our report we expect that Verizon will maintain its market share constant over the years (35%) and that the
Exhibit 31: Sensitivity Analysis: Risk free vs default spread
Source: Analysts estimates
Exhibit 32: Sensitivity Analysis: RR vs ROIC
Source: Analysts estimates
Exhibit 33: Sensitivity Analysis: Wireless ARPU vs market share
Source: Analysts estimates
#REF! 30% 31% 32% 33% 34% 9.9% 60.31 62.01 63.80 65.69 67.68 10.2% 61.59 63.40 65.32 67.34 69.49 10.4% 62.92 64.85 66.90 69.08 71.39 10.7% 64.30 66.37 68.56 70.90 73.39 10.9% 65.75 67.95 70.30 72.81 75.50 RR RO IC #REF! 1.4% 1.6% 1.9% 2.6% 3.2% 1.5% 77.21 70.09 63.91 51.11 41.55 1.7% 79.17 71.78 65.38 52.18 42.36 1.9% 81.20 73.53 66.90 53.28 43.20 2.1% 83.31 75.34 68.48 54.41 44.05 2.3% 85.51 77.22 70.10 55.58 44.93 Risk free De fa u lt s p re a d #### 0% 10% 20% 30% 40% 33% 60.97 64.65 66.32 66.97 67.21 34% 61.18 64.91 66.61 67.27 67.52 35% 61.40 65.18 66.90 67.58 67.84 36% 61.62 65.45 67.21 67.90 68.16 37% 61.85 65.73 67.52 68.22 68.49 M a rk e t s h a re ARPU