An
An
An
An E
E
Energy
E
nergy
nergy
nergy aware
aware
aware
aware S
Spatial
S
S
patial
patial C
patial
C
C
Correlation
orrelation M
orrelation
orrelation
M
Me
M
e
ethod
e
thod in
thod
thod
in
in E
in
E
E
Event
vent
vent
vent
driven
driven
driven
driven W
W
Wireless
W
ireless
ireless
ireless S
Sensor
S
S
ensor
ensor
ensor N
N
N
Networks
etworks
etworks
etworks
Samira Nemati1, Reza Azmi2 and M.A.S. monfared3
1
school of engineering, Alzahra University Tehran, Iran
2
school of engineering, Alzahra university Tehran, Iran
3 school of engineering, Alzahra University Tehran, Iran
Abstract
Wireless Sensor networks (WSNs) are used to monitor and control the physical environment in different classes of applications. Due to the dense deployment of sensors and as the sensor observations are spatially correlated with respect to location of sensor nodes, it is not necessary for every sensor to transmit its data. Therefore, because the resource constraints of nodes, it is necessary to select the minimum number of nodes to transmit the data to the sink and hence minimize the energy consumption. In this paper we develop a new scheme using the energy–aware immune system and this method selects the minimum number of designated nodes that can send its data to the sink and significantly reduce the energy consumption. In addition, considering the remaining energy of the designated nodes, their energy is balanced. Simulation results have been conducted and verified the effectiveness and efficiency of our proposed.
Keywords: Wireless Sensor Network, Artificial Immune System, LMS filter, Spatial Correlation
1. Introduction
Wireless sensor networks consist of a large number of sensor nodes positioned in a certain area to monitor and control physical phenomena and transfer the gathered data to a destination node [1]. These kinds of networks have attracted much attention due to their extensive use in industries, the environment, homeland security, hospitals, agriculture, meteorology, space, military and many other applications [12].
The energy required for a sensor node or its power supply source is provided via a battery; however, due to the limited capacity of batteries, these nodes sometimes require to obtain energy from an external source, such as solar cells. Nevertheless, such external sources of energy display inconsistent behavior and are thus unreliable. On the other hand, it is impossible to replace the batteries of sensors, for they are located on distant and sometimes dangerous locations. Therefore, one of the vital aspects concerning sensor networks is the use of methods that can reduce their energy consumption as much as possible [2].
One of the methods of decreasing the energy consumption of sensors that is of concern to researchers is the notion that the dense deployment of sensor nodes in a given location may lead to an extensive amount of temporal and spatial correlation among their data. A high density of sensor nodes generates redundant or highly correlated data by sensors, for adjacent nodes will receive identical information. Therefore, we can minimize network energy consumption through correlation among the nodes [12]. In [7], using an immune system, the spatial correlation of the sensors is meticulously considered and the weight for choosing the proper sensors for data transfer is calculated. However, another matter that should be attended is the amount of energy remaining in the sensor nodes, i.e. whether these sensors possess the required energy for sending the information, given the attributed weight. A sensor node may have a huge weight for being selected, yet lack the necessary energy for transferring the data; or, sending data by that sensor might trouble the sensor. In this paper, we have improved the immune system model provided in [7] and, by considering the remaining energy of sensors, we have calculated a new energy-aware criterion, which will serve as the criterion for choosing sensors. In the next step, using the least-mean-square (LMS) filter, we have selected the appropriate sensors for sending data so as to minimize the defined error function. In the algorithm proposed in this paper, a set of sensors are dynamically selected based on events, exploiting spatial correlation and the remaining energy of the sensors. Therefore, in this algorithm 1) the remaining energy of the sensor nodes is balanced, and 2) the network energy consumption is reduced by the communications decrease using spatial correlation among the sensors.
then, in section 5, a new approach is presented, finally, in Section 6, we will provide the results of the simulation and present the performance of the algorithm in reducing energy consumption.
2. Related work
Sensor nodes comprising wireless networks include four major elements (see Fig. 1): the sensing unit, the processing unit, the transceiver unit and the power supply unit. However, based on the application of the sensor nodes, other units such as location finding units and mobilizer units can be added to the node. The sensing unit usually contains two subunits: sensors and Analog to Digital Converter (ADC) tables. The processing unit, normally accompanied by a memory unit, manages the procedure and enables a node to share information with other nodes. Due to its high importance, the issue of energy consumption has extensively been the center of focus in both hardware-oriented research [3-6], and methodological and algorithmic studies. It should be noted that network life depends on the life of all individual nodes, which in turn depends on energy consumption.
Fig. 1 The elements of a sensor node [2]
The transceiver unit, in charge of connection with other nodes, is the most energy-exhaustive part of sensor nodes. Generally, in wireless sensor networks, data transfer consumes more energy compared to data processing and data acquisition by sensors, where energy consumption for transferring one bit of data almost equals to the energy required for processing thousands of operations in one sensor node [2].
Numerous researches have been conducted on the reduction of communications and volume of the data transferred to the destination node in wireless sensor networks [7-14]. Important factors that lead to redundant
data transfer as well as the presence of spatial correlation among sensor nodes due to their density have always been subjects of studies. Some of the major algorithms proposed using the spatial correlation of sensor networks have been summarized in Table1.
Table 1: A summary of the major algorithms based on spatial correlation in WSNs [8], [12].
When sensor nodes are close, there will be numerous similarities among the data received by such nodes. Here, rather than all sensors sending identical information, only some of such nodes are selected for sending the information [8]. Liu et al. [11], introduced a clustering algorithm, called Energy-Efficient Data Collection (EEDC) framework, for exploiting spatial correlation. In this algorithm, all the network information is available in the sink node. The sink clusters sensors based on this information allow spatially-correlated nodes to be placed in the same cluster. There are some sensor nodes in each cluster that send information. One of the limitations of this method is that the sensors should be connected to the sink node or a central node through one-hop. Therefore, it fails to be useful for large-scale networks [8]. Villas et al. [12], proposed the dynamic and scalable tree aware of spatial correlation (YEAST)that decreases energy consumption in sensor networks through the elimination of redundant data sending and using dynamic routs. In their paper, some correlated areas are formed in the network, in each of such areas, one node is assumed as the representative node and this node is the sole responsible for sending data of the given area. Yoon et al. [9], proposed a mechanism for spatial correlation in WSNs that called Clustered Aggregation Technique (CAG), this mechanism creates clusters of nodes with similar sensing values and only a node inside the cluster transmits its reading to the Sink node. The CAG algorithm operates in two phases: query and response. In the query phase, the data-centric clusters are created according to a user-specified error threshold and in the response phase, just one node per cluster sends its reading to the sink node. In the query phase, the
Scheme Objective Scalability Overhead
EEDC
Eliminate control overhead
Very Low Very Low
CAG
Eliminate data redundancy
Medium Very
High
GSC
Eliminate data redundancy
Low High
YEAST
Eliminate data redundancy
proposed mechanism uses a broadcast-based protocol to disseminate the query to all sensor nodes, which is not needed in most scenarios [8].
Shah et al. [10], proposed a spatial correlation solution, called Gridiron Spatial Correlation (GSC), which the correlation regions are formed as squared rectangles and nodes lying in the rectangle are assumed to be spatially correlated. Cluster- head located in the center and will determine active- inactive nodes with considering energy level and distance. The limitation of GSC is the control mechanism which is not applied to multi-hop members. Through modeling the spatial correlation and acquiring the distortion function, Vuran et al. [13], estimated the number of the sensors that are sufficient for obtaining information about an event. Any sensor node that is selected for sending data is the representative of a spatially correlated set of sensors. Although their solution reduces network energy consumption, it fails to consider their remaining energy when selecting the representative nodes. If a sensor node in a correlated area were selected as the representative node for a consistent time, it would lose more energy than other sensors fir it would send more data.
Atakan et al. [7], could well exploit the spatial correlation through using artificial immune systems. Inspired by the immune system, they designed an algorithm in order to decrease the amount of data sent and the communications in sensor networks. Accordingly, a minimum number of sensors for sending data are selected. This method also not considers remaining energy when selecting the nodes. In the last two decades, artificial immune systems have drawn the attention of researchers as a new approach for solving complicated computational problems [22]. Due to the capability of such systems in data processing, learning, self and Non-self discrimination, these computational techniques are largely used for clustering and computers security [7]. Including [15-17], in which an effective immune system model for clustering is presented. Graf et al. [18], used the immune system for clustering the data of a variable environment in which the clusters were consistently changing due to the instability of the data. Gang et al. [19], proposed an artificial immune system for clustering. Using the immune network, they clustered the data with regard to the relation among them and reduced the data volume required for processing.
In the method proposed in this paper, the immune system and the similarities of this system with sensor network are
used. By employing [7], we have calculated the weight for selecting the sensors suitable for transmitting the data using the criteria obtained by the immune system-based sensor network model. Through considering the remaining energy in the nodes, we improved the selection weight of the sensors and balanced their energy consumption. In addition, with this new criterion, we have proposed a method for selecting the appropriate sensors for sending data so that the assumed error function is minimized, thus energy consumption in sensors is balanced and we have also reduced energy consumption within the network by decreasing the number of communications. The results from the simulation properly show the performance of the proposed algorithm in reducing energy consumption of sensor networks.
3. Artificial Immune System
The goal and function of the immune system is to protect the body against pathogens, hence establishing a stable state in the body that is necessary for its vital activities. For this aim, the immune system should be able to detect the pathogens, such as viruses, bacteria, etc. that threaten well-being. A pathogen consists of various parts. One of these parts existing at the surface of the pathogen is the antigen. In order to detect a pathogen, the immune system cells need to identify its antigen, the main concept of the immune system are summarized in Table 1. Once the immune system detects a pathogen, a series of actions begin to destroy that certain pathogen. Such actions are called immune response. Antigen identification is a function of a kind of white blood cells called lymphocytes. B-cells and T-cells are two kinds of lymphocytes [20]. Also, negative selection, clonal selection, and immune network theory are among theories used in association with immune system models [18].
Table 2: The basic concepts of the immune system [19]
Immune system
(IS) concept Description
Pathogen(antigen) Harmful invasive cells, e.g., bacteria and viruses
antibody Immune cells
Purpose of IS Generate immune cells to recognize and kill harmful invasive cells.
Antigen recognition
By binding of immune cells with an invasive cell.
4. Sensor Networks Based on Immune
Network model
In this section, considering the elements of the immune system and generalizing these elements to wireless sensor networks, we will address the calculation of the selection weight for choosing the appropriate sensors for sending data in sensor nodes receiving an event. Due to some specifications, artificial immune system is highly suitable for use in sensor networks. The immune-system based algorithms involve lower computational costs, a specification that suits well for sensor networks due to their computational capacity and limited energy of sensors [21]. After calculating the selection weight for the sensors, while considering the spatial correlation and the remaining energy of the sensors, we select a number of sensors that conform more to this criteria for sending data so that sending data by all the data receiving sensors is avoided and energy saving is achieved for the network.
Although it seems that the immune system is highly different from wireless sensor networks, there are numerous similarities as well. For example, when a pathogen enters the body, a number of B-cells are stimulated and secrete the required antibody for eliminating the antigen produced by the pathogen. Similarly, when an event takes place in the surroundings of wireless sensor networks, a number of sensors receive the event and send the respective information to the destination node [7].
In Table 3, the similarities between the immune system and wireless sensor networks are briefly presented. Table 3: The relationship between the immune system and WSNs [7]
In the immune system, the stimulation of B-cells depends on three factors:
1) The affinity between the B-cell and the pathogen
2) The affinity between the B-cell and its neighbors that stimulate the B-cells
3) The affinity between the B-cell and its neighbors that suppress the B-cell [23].
These three factors can be generalized to wireless sensor networks:
1) The affinity of the sensor node (B-cells) with the event source (pathogen)
2) The affinity of the sensor node (B-cell) with the neighboring sensor nodes (stimulating B-cells) uncorrelated to those sensors
3) The affinity of the sensor node (B-cells) with the neighboring sensor nodes (suppressing B-cells) correlated to those sensors [7].
In order to identify the correlated and uncorrelated neighbors of the sensor node, the correlation radius of Cr is defined for the sensors; hence:
1) For a sensor node, neighboring nodes that fall within its correlation radius of Cr are called the correlated neighbors of that node.
2) For a sensor node, neighboring nodes that do not fall within its correlation radius of Cr are called the uncorrelated neighbors of that node.
The correlation radius Cr is a specific value that can be determined based on environmental size, node density and the statistical properties of the observed physical phenomenon in a sensor node [13].
4.1 designated node selection weight
Any sensor is aware of the position of its neighboring nodes, and all of the sensors send information on their position to their neighbors on a regular basis. In order to show the correlation between the event source and nodes, correlation coefficients , and , are defined.
According to [24], , in Eq. (1) represents the correlation between sensor node i and event source s and , in Eq. (2) shows the correlation between sensor nodes i and j:
, , exp , /
0 , 0,2 (1)
, , exp , /
0 , 0,2 (2)
Wireless sensor
network Immune system
Sensor nodes B-cells
Sensor data antibody
, and , represent the distance between the event source s and sensor node i, and the distance between sensor nodes and i and j, respectively. The selection weight for sensors is then obtained according to the three factors affecting B-cells stimulation and the generalization of those factors to wireless sensor networks; where j represents the uncorrelated neighbors of i, and k represents the correlated neighbors of i [7]:
, ! ∑ 1 , ! ∑$ ,$ (3)
• The first factor in the above formula is the
affinity of sensor node i (B-cell) with the event source (pathogen). As mentioned, , indicates the correlation between the event source and sensor node i. If the distance between the event source and the sensor reduces, the correlation will increase; if the distance increases, , will decrease.
• The second factor in the above formula is the
affinity of sensor node i (B-cell) with the uncorrelated neighboring sensor nodes (stimulating B-cells). Sensor node j is a sensor that does not fall within the correlation radius of sensor i. If the distance between sensors i and j increases, , will decrease and the value of
1 , will increase.
• The third factor is the affinity of the sensor node with the correlated neighboring sensor nodes. k represents the sensors that are within the correlation radius of sensor i. The nearer those sensors are to sensor i, the higher their correlation coefficient will be. Therefore, the value of ,$ will be reduced for sensor nodes with more correlated neighbors [7].
5. Proposed method
We have improved the immune system model provided in [7] by considering the residual energy of sensors. We have calculated a new energy-aware weight, which will serve as a criterion for choosing sensors. In the next step, using the LMS filter, we have selected the appropriate sensors for sending data so as to minimize the defined error function.
5.1 Network model
We consider the following assumptions in the modeling of wireless sensor network:
• The nodes in the network are divided into sink
and sensor classes. All sensor nodes are similar and they have limited resources, but sink node does not have resource limitation.
• In the wireless sensor network, the sensor nodes are randomly distributed.
• The density of the network is high such that in
every event like a fire and so on, there are number of sensors around the event which can receive and transmit data.
• The sink has the information of the position all sensor nodes specially the distance of the nodes from each other and the event.
In this paper the sensor field is denoted by as a subset of
%
, the subset of all nodes in the sensor field is denoted by N; indeed & ⊆ Ω . For each ) ∈ Ω the neighborhood centered at a with radius r is defined by Eq. (4):+ ) , , - ∈ . ∶ ‖- )‖ 1 ,2 (4) Where ‖. ‖ is the standard norm of % and r is the radius of the event received by the nodes.
With this in mind, one can defined an event S as a subset of with the Eq. (5):
4 ⋃ + ) , , $6 ∈ 7 , ) ∈ Ω
(5)
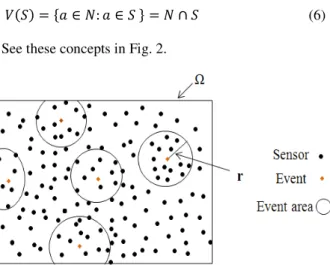
The collection of all sensor that receive an event S is called an event area and is usually denoted by V (S), on the other hand for any event 4 ⊆ . we have Eq.(6):
8 4 ) ∈ &: ) ∈ 4 2 & ∩ 4 (6) See these concepts in Fig. 2.
Fig. 2 Sensor field & event area in sensor network
5.2 Selecting the Appropriate Sensors for Sending
Data
In section 2, we calculated the important factors affecting the selection of sensors. Those factors were associated with the spatial correlation among sensors. Another issue of importance is the remaining energy of sensor nodes. A sensor node may be suitable based on the factors considered in Eq. (3); however, such a sensor may lack the required energy for sending data. Therefore, considering the remaining energy of sensors
;
and the value obtained from Eq. (3), the selection weight for choosing the appropriate sensor for sending data is achieved as Eq. (7):< ! ; (7)
The higher the value of < in a sensor node, the more appropriate that sensor node is for sending data to the destination node. Our goal here is to calculate a minimum number of sensor nodes for sending data. The respective instruction is subsequently given. Using this instruction, sensors inappropriate for sending data are eliminated and energy is saved through the removal of redundant data sending.
Given the minimum energy required for sending data , we define the following error function as Eq. (8):
= > (8)
Using the LMS filter, we have selected appropriated sensors for sending data that will minimize the value of = . In case of an event in the network, the sensors within the event radius receive that event and the M value in the sensors is calculated.
We consider ? < , . . <@ for each sensor and is assigned ?AB, A , . . AC, thus the output as Eq. (9):
> ∑@$6 <$A$! AB (9)
Weights are updated by Eq. (10):
A$D AE! F= <$ (10)
Subsequently, through minimizing the target function = , the designated nodes for sending data are selected. The pseudo-code for selecting the best set of the nodes is as follows:
Algorithm1. Select the best set of the sensors
For each G ∈ 8 4
Initial weight w = [ AB, A , . . A@ Calculated > ∑@$6 <$A$! AB
If > 0 select G , calculated = > Adapt weight A$D AE! F= <$ Else reject G
Repeat to = ← =@ C End
End
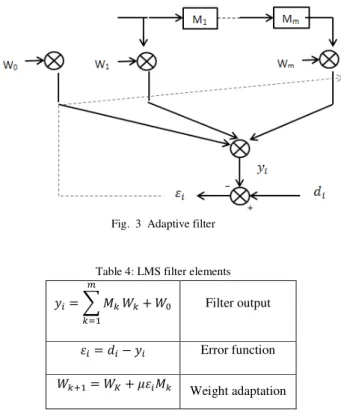
According to [14], the structure and concept of an adaptive filter is shown in Fig. 3 and table 4.
Fig. 3 Adaptive filter
Table 4: LMS filter elements
As a result, sensors unnecessary for sending data are removed and the network energy consumption is reduced through the diminution of communications, which in turn leads to longer network life.
> I <$ @
$6
A$! AB Filter output
= > Error function
6. Simulation Results
We will now study the results of the simulation. The network environment was simulated in MATLAB software. In the simulation, we considered a network of 100 sensors that were distributed in a 100×100 m2 environment. Other parameters assumed in the simulation are as given in the following table:
Table 5: Simulation parameters
The correlation radius can be determined based on the environment size and node density in the sensor network. The effect of the variation of this parameter on the number of sensor nodes and energy consumption was investigated. As it can be seen in the Fig. 4, an increase in the correlation radius would result in a selection of lower number of sensors.
Fig. 4 The number of selected sensors in different correlation radiuses & sensing range
Therefore, as shown in Fig. 5, energy consumption, too, would decrease along with an increase in correlation radius.
Fig. 5 Energy consumption of nodes with alterations in correlation radius & sensing range
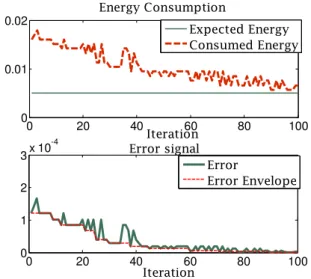
Fig. 6 shows the energy consumption and error function in each iteration. The consumed energy has obviously approximated the expected energy, so the error function reaches its minimum value.
Fig. 6 The reduction of energy consumption and error in each iteration
In order to evaluate network performance, we executedthe algorithm for 20 consecutive events and measured the number of selected nodes and energy consumption of the network in three modes.The first mode is when LMS filter is used. In the second mode, the sensors are selected randomly. The third mode is when all the sensors that receive event data send their information. Figures 7, 8 respectively show the number of selected sensors and energy consumption in each round. Considering the
0 20 40 60 80
0 10 20 30 40 50 60
Sensing Range
N
u
m
b
e
r
o
f
n
o
d
e
s
selected nodes variation versusR,Cr
Correlation Radius = 5 Correlation Radius = 10 Correlation Radius = 20 Correlation Radius = 30 Correlation Radius = 50 Correlation Radius = 70
0 10 20 30 40 50 60 70
0 0.002 0.004 0.006 0.008 0.01 0.012 0.014 0.016 0.018
Sensing Range
E
n
e
rg
y
(
Ju
l)
Energy Consumption variation versus R,Cr Correlation Radius = 5
Correlation Radius = 10 Correlation Radius = 20 Correlation Radius = 30 Correlation Radius = 50 Correlation Radius = 70
0 20 40 60 80 100
0 0.01 0.02
Iteration Energy Consumption
Expected Energy Consumed Energy
0 20 40 60 80 100
0 1 2 3x 10
-4
Iteration Error signal
Error
Error Envelope Area of sensor field 100×100m2
Initial energy of a sensor
node E=0.1J
Sensing radius R= 30 m Radio range of a sensor
node
d= 40 m
number of sensors and energy consumption, LMS filter clearly yields better results than two other modes.
Fig. 7 A comparison of the number of nodes in 3 modes for 20 events
Fig. 8 a comparison of energy consumption in 3 modes for 20 round
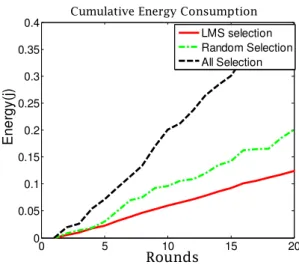
Eventually, the total energy consumed in the network for each of the three modes was compared. As it can be seen in Fig. 9, the method proposed in this paper improves the energy consumption of the network.
Fig. 9 A comparison of the total energy consumed in three modes
7. Conclusions
In this paper, we have proposed an Algorithm based on Artificial Immune Network to reduce energy consumption of wireless sensor networks. First, we modeled the node collaboration of wireless network with proposed Artificial Immune Network approach. Then, the system parameters are calculated using the spatial correlation among sensors and the remaining energy. Spatial correlation caused by the dense positioning of sensor nodes in the network leads to redundant sending of data; consequently, an increase in unnecessary communications will result in a huge loss of energy within the network. Hence, selecting appropriate sensors has an important effect on reducing network energy consumption and increasing its life period. By minimizing the error function, we have identified the most proper sensors for sending data and avoided redundant sending of data. As the results from the simulation illustrate, employing this algorithm results in a significant reduction in energy consumption.
References
[1] J. Yick, B. Mukherjee, D. Ghosal, “Wireless sensor network survey”, Computer Networks journal, Vol. 52, 2008, pp. 2292– 2330.
[2] G. Anastasi, M Conti, M. D. Francesco, A. Passarella, “Energy conservation in wireless sensor networks: A survey”, Ad Hoc Networks, Vol. 7, 2009, pp. 537–568.
[3] K. Baoqiang, C. Li, Z. Hongsong, X. Yongju, “accurate energy model for WSN node and its optimal design”, Journal of
0 5 10 15 20
5 10 15 20 25 30
Rounds
N
o
d
e
s
Designated nodes Length
LMS selection Random Selection All Selection
0 5 10 15 20
0 0.005 0.01 0.015 0.02 0.025 0.03 0.035 0.04
Rounds
E
n
e
rg
y
(J
)
Energy Consumption in each round
LMS selection Random Selection All Selection
0 5 10 15 20
0 0.05 0.1 0.15 0.2 0.25 0.3 0.35 0.4
Rounds
E
ne
rg
y
(j
)
Cumulative Energy Consumption
Systems Engineering and Electronics, Vol. 19, 2008, pp. 427-433.
[4] H. Qian, P. Sun, Y. Rong, “Design Proposal of Self-Powered WSN Node for Battle Field Surveillance”, Energy Procedia, Vol. 16, 2011, pp. 753-757.
[5] H. Yua, Q. Yueb, “Indoor Light Energy Harvesting System for Energy-aware Wireless Sensor Node”, Energy Procedia, Vol. 16, 2012, pp. 1027 – 1032.
[6] D. Zhu, S. P. Beeby, M. J. Tudor, N. R. Harris, “A credit card sized self-powered smart sensor node”, Sensors and Actuators A: Physical, Vol. 169, 2011, pp. 317-325.
[7] B. Atakan, O. B. Akan, “Immune System-based Energy Efficient and Reliable Communication in Wireless Sensor Networks”, studies in Computational Intelligence (SCI), Vol. 69, 2009, pp. 189–209.
[8] L. A. Villas, A. Boukerche, D. L. Guidoni, Horacio A.B.F. de Oliveira, R. B. de Araujo, Antonio A.F. Loureiro, “An energy-aware spatio-temporal correlation mechanism to perform efficient data collection in wireless sensor networks”, Computer Communications journal, in press, 2012.
[9] S. Yoon, C. Shahabi, “Exploiting spatial correlation towards an energy efficient clustered aggregation technique (cag)”, in: IEEE International Conference on Communications (ICC), Vol. 5, 2005, pp. 3307–3313.
[10] G.A. Shah, M. Bozyigit, “Exploiting Energy-aware Spatial Correlation in Wireless Sensor Networks”, 2nd international conference on communication system software and middleware (COMSWARE), 2007.
[11] C. Liu, K. Wu, J. Pei, “An energy-efficient data collection framework for wireless sensor networks by exploiting spatiotemporal correlation”, IEEE Trans. on Parallel Distributed systems. Vol. 18, 2007, pp. 1010–1023.
[12] L. A. Villas, A. Boukerche , Horacio A.B.F. de Oliveira, Regina B. de Araujo, Antonio A.F. Loureiro, “A spatial correlation aware algorithm to perform efficient data collection in wireless sensor networks”, Ad Hoc Networks Journal, 2011. [13] M. C. Vuran, O.B. Akan, I. F. Akyildiz, “Spatio-temporal correlation: theory and applications for wireless sensor networks”, Computer Networks, Vol. 45, 2004, pp. 245–259. [14] S. Santini, K. Römer, “An adaptive strategy for quality-based data reduction in wireless sensor networks”, In Proceedings of the 3rd International Conference on Networked Sensing Systems (INSS 2006), Chicago, IL, PP. 29-36.
[15] M. Pal, “Artificial immune-based supervised classifier for land-cover classification”, International Journal of Remote Sensing, Vol. 29, 2008, pp. 2273−2291.
[16] L. N. De Castro, F.J. Von Zuben, “An evolutionary immune network for data clustering”, Proceedings of the IEEE SBRN (Brazilian Symposium on Artificial Neural Networks), Rio de Janeiro, 2000, pp. 84−89.
[17] A.J. Graaff, A.P. Engelbrecht, “Using sequential deviation to dynamically determine the number of clusters found by a local network neighborhood artificial immune system”, Applied Soft Computing, Vol. 11, 2011, pp. 2698–2713.
[18] A.J. Graaff, A.P. Engelbrecht, “Clustering data in an uncertain environment using an artificial immune system”, Pattern Recognition Letters, Vol. 32, 2011, pp. 342–351. [19] B Gong, J. Im, G. Mountrakis, “An artificial immune network approach to multi-sensor land use/land cover classification”, Remote Sensing of Environment, Vol. 115, 2011, pp. 600–614.
[20] L. N. D. CASTRO, J. I. Timmis, “Artificial Immune System as a Novel Soft Computing Paradigm”, Soft Computing, Vol. 7, 2003, pp. 526-544.
[21] M. Drozda, S. Schaust, H. Szczerbicka, “Is AIS Based Misbehavior Detection Suitable for Wireless Sensor Networks”, IEEE, 2007.
[22] D. Dasgupta, S. Yu, F. Nino, “Recent Advances in Artificial Immune Systems: Models and Applications”, Applied Soft Computing, Vol. 11, 2011, pp. 1574–1587.
[23] J. Timmis, M. Neal, J. Hunt, “An artificial immune system for data analysis”, Bio System, Vol. 55, 2000, pp. 143-150. [24] J.O. Berger, V. de Oliviera, B. Sanso, “Objective bayesian analysis of spatially correlated data”, Journal of the American Statistical Association, Vol. 96, 2001, pp. 1361-1374.
![Table 1: A summary of the major algorithms based on spatial correlation in WSNs [8], [12]](https://thumb-eu.123doks.com/thumbv2/123dok_br/18374971.355725/2.892.88.431.660.798/table-summary-major-algorithms-based-spatial-correlation-wsns.webp)
![Table 2: The basic concepts of the immune system [19]](https://thumb-eu.123doks.com/thumbv2/123dok_br/18374971.355725/3.892.485.813.845.1036/table-basic-concepts-immune.webp)
![Table 3: The relationship between the immune system and WSNs [7]](https://thumb-eu.123doks.com/thumbv2/123dok_br/18374971.355725/4.892.92.369.839.951/table-relationship-immune-wsns.webp)