Effects of the Construction Method on Pile Performance:
Evaluation by Instrumentation. Part 1: Experimental Site at
the State University of Campinas
Paulo José Rocha de Albuquerque, Faiçal Massad, Antonio Viana da Fonseca, David de Carvalho,
Jaime Santos, Elisabete Costa Esteves
Abstract.This paper reviews the behavior of three types of piles (bored, CFA and Omega piles), installed in the experimental site of Unicamp (State University of Campinas). Unicamp subsoil is characterized by non-saturated diabasic soil, lateritic in its surface layer. Extensive data from geotechnical investigation is presented, expressed in parameters derived both fromin situand
laboratory tests. Static load tests with electrical extensometers were performed along the depth of instrumented piles. It was observed that most of the loads applied were transferred by lateral friction. An analysis of load transfer functions was made, which displayed a very good definition of both shaft friction and tip interaction, namely the ultimate resistance. The average maximum unit shaft friction resistance of the piles was 41 kPa, 58 kPa and 86 kPa for bored, CFA and Omega piles, respectively. Maximum tip reaction was 87 kPa, 491 kPa and 1665 kPa, for bored, CFA and Omega piles, respectively. This paper also emphasizes the relevance of extracting each pile after completion of the test in order to inspect the pile facies and characteristics. This enabled checking the shape of tips and size of shafts. Part 2 of this paper will review the tests performed at the Experimental Field of FEUP (Faculty of Engineering of the University of Porto/Portugal).
Keywords:construction techniques, pile performance, bored pile, CFA pile, Omega pile, precast pile, instrumentation.
1. Introduction
Most constructions use deep foundations, mainly piles. This type of foundation can be executed either by ex-tracting soil or by displacing soil. The first category in-cludes bored piles, Strauss piles, CFA piles, etc; the second category includes other types of piles: driven piles (precast concrete or steel piles), Franki piles, Omega piles, etc. The technical community is aware that the pile execution proce-dure conditions the behavior in the load-displacement mechanism, and, therefore, in its load capacity. The pur-pose of this study is to analyze the performance of three kinds of piles executed in diabasic, porous and lateritic soil, at 17 m-deep water level. The static pile load tests (SPLT) were carried out in three classes of deep foundations: bored piles, CFA and Omega helical type, in Campinas, São Paulo State, Brazil. These piles were instrumented as de-scribed below. From field and laboratory tests plus pile extractions, soil conditions around pile shafts will be evalu-ated.
This paper was developed together with researchers from Brazil (Unicamp and Poli-USP) and from Portugal (FEUP and IST – Upper Technological Institute –
Lis-bon/Portugal). It reviews the behavior of CFA, Omega, bored and precast piles, instrumented in depth. This article deals with the results obtained at the Experimental Field of Unicamp, whereas part 2 will describe the results obtained at the Experimental Field of FEUP for CFA, Omega and bored piles.
2. Piles Instrumented In Depth: Cases To Be
Analyzed
Instrumentation is determinant to evaluate the load transfer mechanism in pile foundations. This technique has been used for over 30 years, initially with mechanical ex-tensometers and, more recently, with electrical extensom-eters. In Brazil, the first reports on pile instrumentation date back from 1975, in Prof. Dirceu Velloso’s study in Rio de Janeiro, performing instrumentation of a pile with tell-tales (Velloso et al., 1975). Since then, this technique has
evolved with the growing demand for pile instrumentation. Nowadays, the technique employed, although it involves extra costs, since it uses electrical extensometers that can be installed in different ways, provides valuable additional in-formation.
Paulo José Rocha de Albuquerque, D.Sc, Faculdade de Engenharia Civil, Arquitetura e Urbanismo, Universidade Estadual de Campinas, Av. Albert Einstein 951, 13083-852 Campinas, SP, Brazil. e-mail: pjra@fec.unicamp.br.
Faiçal Massad, D.Sc., Escola Politécnica, Universidade de São Paulo, Av. Professor Almeida Prado 271, Trav. 2, Cidade Universitária, 05508-900 São Paulo, SP, Brazil. e-mail: faical.massad@poli.usp.br.
Antonio Viana da Fonseca, D.Sc., Faculdade de Engenharia, Universidade do Porto, Rua Dr. Roberto Frias 4200-465, Porto, Portugal. e-mail: viana@fe.up.pt.
David de Carvalho, D.Sc, Faculdade de Engenharia Agrícola, Universidade Estadual de Campinas, Av. Marechal Rondon 501, 13083-875 Campinas, SP, Brazil. e-mail: da-vid@feagri.unicamp.br.
Jaime Santos, D.Sc., Instituto Superior Técnico, Universidade Técnica de Lisboa, Av. Rovisco Pai 1049-001, Lisbon, Portugal. e-mail: jaime@civil.ist.utl.pt. Elisabete Costa Esteves, M.Sc., Instituto Superiorde Engenharia do Porto, Rua Dr. Antonio Bernardino de Almeida 431, 4200-072 Porto, Portugal. e-mail: efm@isep.ipp.pt. Submitted on September 30, 2009; Final Acceptance on June 11, 2010; Discussion open until August 31, 2011.
In this study, three SPLT’s were considered, all exe-cuted in an experimental site located in the State University of Campinas (Unicamp), in Brazil (Fig. 1). The local instru-mentation that was used consisted of electrical resistance extensometers installed along the entire pile length, which enabled thorough quantification of pile shaft strain.
3. Unicamp Experimental Site
3.1. Geological and geotechnical characteristics
The regional subsoil was formed by the decomposi-tion of basic magmatic rocks, along with basic intrusive units (diabasic). The rock formations cover 98 km2of
Cam-pinas region, corresponding to 14% of the total area. The subsoil of the experimental site consists of a diabasic soil profile, including a 6.5 m thick surface layer, constituted of highly porous silty clay, overlaying a residual diabasic soil (with clayey silt) horizon down to 20 m. Water level is 17 m below the surface.
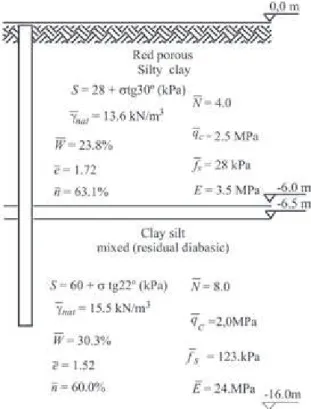
The geotechnical characterization of the soil of Uni-camp Experimental Site is described in Giacheti (1991), Monacci (1995), Albuquerque (1996) and Peixoto (2001) as part of a research program on tropical soils for founda-tion purposes (Carvalhoet al.2000). Figure 2 shows an
out-line of the geotechnical profile with some characteristics of the subsoil. The physical parameters of the soil were ob-tained by performing tests in undisturbed samples of soil collected after a 16 m deep well was dug.
Several field tests were performed: dynamic sound-ing, standard penetration test including torque measure-ments (SPT-T), cone penetration tests (CPT), flat dilato-meter tests (DMT), pre-bored pressure dilato-meters (PMT), among others. The location of CPT and SPT tests along with tested piles are shown in Fig. 3. SPT-T and CPT pro-files are shown in Fig. 4. The location of piles at the Ex-perimental Field can also be seen. The CFA, Omega and bored piles are 2.4 m (6f) far from the neighboring
reac-tion piles. We can also see a precast concrete pile measur-ing 0.18 m diameter and 14 m length, instrumented in depth, 12 m far from the Omega 3 pile. The results of the
precast pile are shown and analyzed in Albuquerque & Carvalho (1999).
3.2. Results of load tests
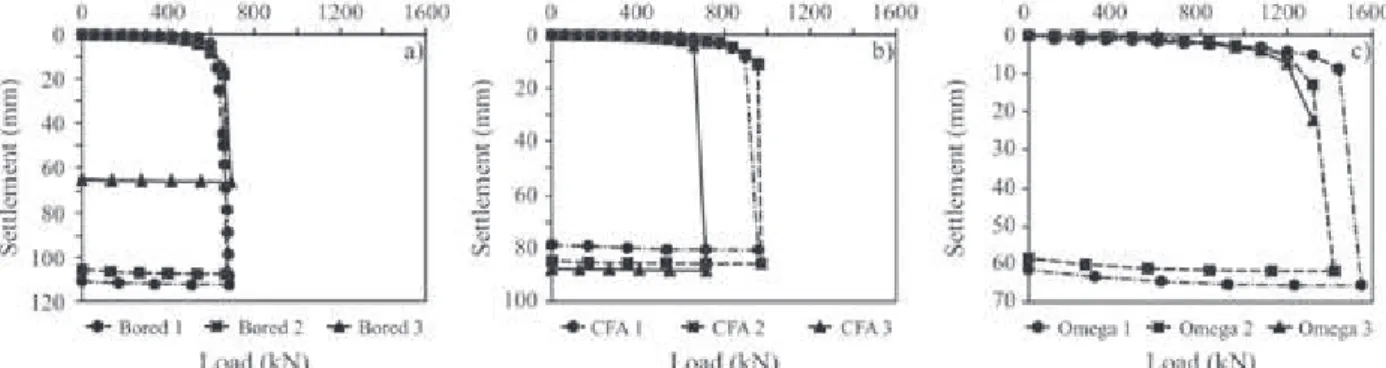
Nine pile load tests were performed following pre-scriptions of Brazilian Standards (NBR 12.131/92) and adopting the slow maintained load method, considered the “Standard Loading Procedure” in opposition to other less universal tests, such as constant rate of penetration or quick
Figure 1- Location of the city of Campinas.
Figure 2- Experimental site average geotechnical properties.
maintained load test. Maximum stabilized loads for each pile are shown in Table 1 and loadvs.displacement curves in Fig. 5.
3.3. Case 1 - Bored pile
3.3.1. Execution technique
The bored piles were executed by gradually removing the soil and advancing the auger in depth with up and down
movements. Care was taken not to allow the soil removed to fall back into the hole. Concrete was placed by a steel funnel, to ensure no soil got impregnated in the concrete mass.
3.3.2. Execution process
Three conventional bored piles (0.40 m diameter and 12 m deep) were executed. The upper 6 m were reinforced with four steel bars 16 mm diameter (@8 cm2). Stirrups with
6.3 mm diameter spaced in 20 cm (Steel CA-50) completed the reinforcement. The concrete had a characteristic resis-tance to compression (fck) of 15 MPa and slump of around 70 mm. For the pile cap (0.7 m x 0.7 m x 0.7 m) a concrete with fck = 25 MPa was used.
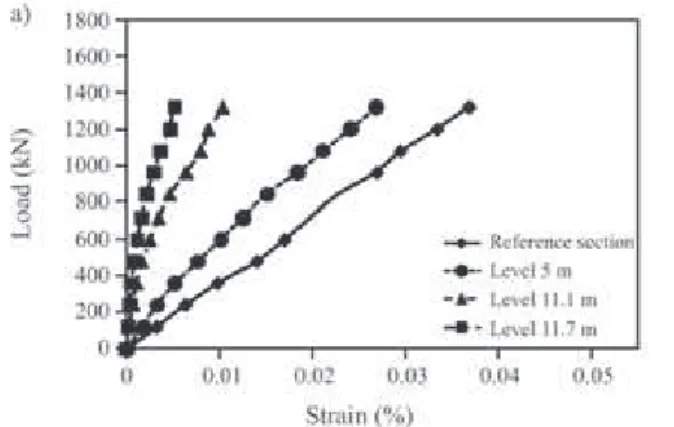
3.3.3. Instrumentation response
Piles were instrumented along the shaft in the follow-ing depths: 0.30 m (reference section); 5.0 m; 11.1 m and 11.7 m. The process used consisted of instrumented steel bars with strain-gages connected in complete bridge, made by Unicamp technicians. (Figs. 6a and 6b) (Albuquerque, 2001).
To have a reliable value of the in-cast concrete Young’s modulus (E), a gage level was placed below the pile cap, in the so called “reference section”, where the load
Figure 4- SPT-T and CPT (Electrical) tests results (adapted from Giachetiet al., 2004).
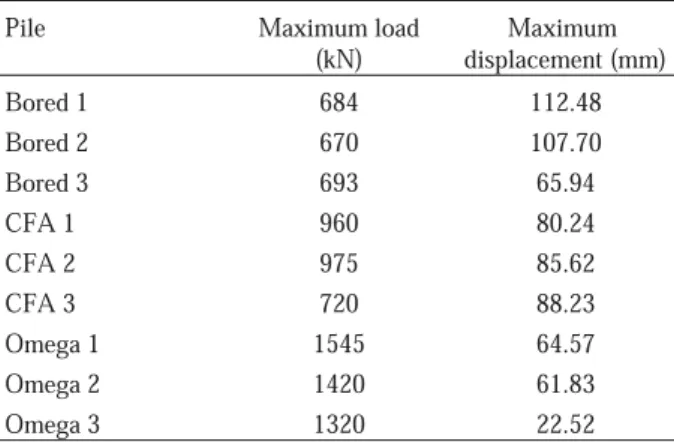
Table 1- Maximum load and displacement values obtained in
load tests.
Pile Maximum load
(kN) displacement (mm)Maximum Bored 1 684 112.48 Bored 2 670 107.70 Bored 3 693 65.94 CFA 1 960 80.24 CFA 2 975 85.62 CFA 3 720 88.23 Omega 1 1545 64.57 Omega 2 1420 61.83 Omega 3 1320 22.52
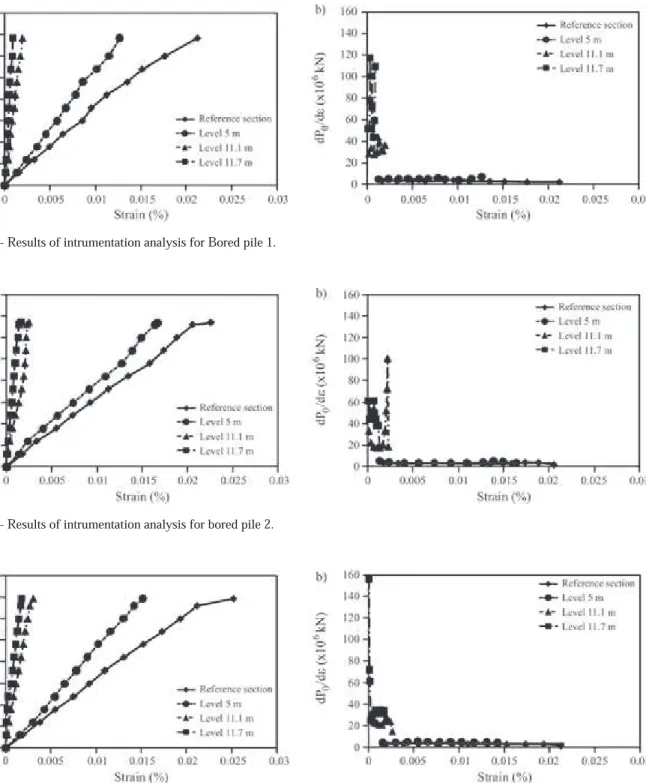
in the pile is the same as the load applied to the top face of the pile cap. Table 2 shows values obtained for the 3 instru-mented bored piles. This approach to estimate Young’s modulus is shown in plots (a) and (b) of Figs. 7, 8 and 9, constituting a graphical representation of the Tangent Mo-dulus Method proposed by Fellenius (1989). This method is summarized below.
The equation for the tangent modulus line is:
M d= ds=A b+
e e (1)
Which can be integrated to:
s=Ae2+Be (2)
However,
s=Ese (3)
Therefore,
Es =05.A Be+ (4)
where M = tangent modulus, Es = secant modulus,
s= stress, ds= (sn+1-s1) = change in stress from one
read-ing to the next, A = slope of the tangent modulus line,
e= measured strain, de= (en+1-e1) = change in strain from
one reading to the next, B = y-intercept of the tangent modulus line (i.e., initial tangent modulus).
dP d0 E Ss
e = (5)
Knowing the strain-dependent secant modulus ratio, the measured strain values are converted to the stress in the pile at the gage location. The load at the gage is then ob-tained by multiplying the stress by the pile cross sectional area.
With the values ofEs.Sincluded in these plots, where
Sis the cross sectional area of the pile in the gage levels and
Figure 5- Load-movement curves.
Figure 6- Instrumentation details.
Table 2- Young’s modulus of concrete as determined by strain
gages and coefficient of variation for the three piles.
Pile Emin(GPa) Emax(GPa) E(GPa) CV(%)
Bored 1 24.2 29.9 27.4 6.6
Bored 2 23.1 24.5 23.8 2.1
Esis the secant modulus, it is possible to build the plot of the
load-transfer diagrams for piles.
From the results shown in Table 2 it can be concluded that concrete Young’s modulus values are similar for the three types of piles, with very low variations. These results indicate good performance of the gages installed at the up-per levels of the piles.
Analyzing the figures mentioned before, a reduction in strain levels along the depth (level 5 m, 11.1 m and 11.7 m) can be detected. It can be noticed that load transfer was more significant between the 5 m and 11.7 m depth lev-els. This fact was already expected, since soil at the 5 m level is more resistant than the upper layer. Observing in-strumentation behavior close to pile tip, strains were very
Figure 7- Results of intrumentation analysis for Bored pile 1.
Figure 8- Results of intrumentation analysis for bored pile 2.
small, which indicates that at this level induced stress is very low.
As the upper 6 m were reinforced with steel bars, the increase in Young’s modulus was calculated as 6% in comparison to the remaining part of the pile.
3.4. Case 2 - CFA pile
3.4.1. Execution technique
The continuous flight auger piles (CFA) are cast in place by drilling the soil through a continuous auger with a ‘corkscrew’ around a central hollow tube. After reaching the bottom level, while the auger is pulled up, the soil is re-placed with concrete pumped down through the hollow tube. To prevent soil or water from entering the hollow tube, there is a metal cap (plug) at the bottom, which is opened, like a valve, by the injected concrete. As the auger is removed, the soil confined between the ‘corkscrews’ is also replaced by the concrete being injected from the tip level upwards. The concrete is characterized by a mixture of small aggregate and sand with cement (minimum con-sumption of 400 kg/m3) and a value of slump of 240 mm,
following prescriptions from the Brazilian Association of Foundations Companies Procedures Manual (ABEF, 1999). The advantages of using this type of pile are: re-duced work schedule; applicability in rather different types of soils (except for rocks or soils with boulders); lack of dis-turbances and little vibration in the terrain, in opposition to percussion driving techniques, and absence of soil decom-pression and contamination when bentonite or other slur-ries are used. Disadvantages are associated to the need of flat terrain to allow the equipment to move easily; the de-mand for a concrete center close to the work; the need of a shovel loader to remove and clean the soil extracted while drilling; the demand for a minimum number of piles to jus-tify the displacement of equipment to optimize the cost-benefit ratio; and, last but not least, the limitation of pile length and reinforcement, which may be considered deter-minant in certain projects. Special attention should be paid to the production process, particularly to control shaft con-tinuity and disturbance of the subsoil when drilling. It is also important to observe that, in weak soils, concrete in-jected at high pressure may lead to soil rupture and high consumption. Another key advantage of CFA piles is the possibility of continuous electronic monitoring of the exe-cution of piles, which can be easily accessed for correc-tions. The following parameters are registered: date and time; digging depth; penetration speed; torque; concrete volume and pressure; pile diameter; and pile extraction ve-locity.
3.4.2. Information on execution
Three CFA piles (0.40 m diameter and 12 m depth) were executed. Four reinforcing bars (16 mm diameter (@8 cm2) and 6 m length) were used. Stirrups with 6.3 mm
diameter, spaced in 20 cm (Steel CA-50) completed the re-inforcements. A MAIT HR-200 drill was used to make the pile, with torque ranging from 220 kN.m to 380 kN.m, ac-cording to rotation speed and the diameter of piles em-ployed.
3.4.3. Effects of installing piles in the subsoil
In order to evaluate the effects of installing piles, CPT tests were carried out both in the soil in the vicinity of the pile shafts and well distanced from them. From the two con-ditions, shaft and tip resistances of the CPT were obtained. The values related to the undisturbed soil,i.e., the results obtained in the tests conducted far from the influence zone, were used for comparison to the analysis of the CPTs next to the pile.
The CPT-5 was 0.25 m far from CFA-T shaft, a non tested pile. It was decided not to run tests closer since piles or CPT rods might incline, which could damage the equip-ment.
Plots of unit lateral friction (fs) and cone point (qc)
resistances are shown in Figs. 10 and 11. In general,fsandqc
values lie in the range of maximum and minimum limits of undisturbed soil. It can be noticed that, while in the first 6 m values related to the distance of 0.25 m were closer to the minimum limits, in the last 6 m they tend to the maximum limits. It may be concluded that the installation of piles seemed to have no significant influence in the surrounding soil.
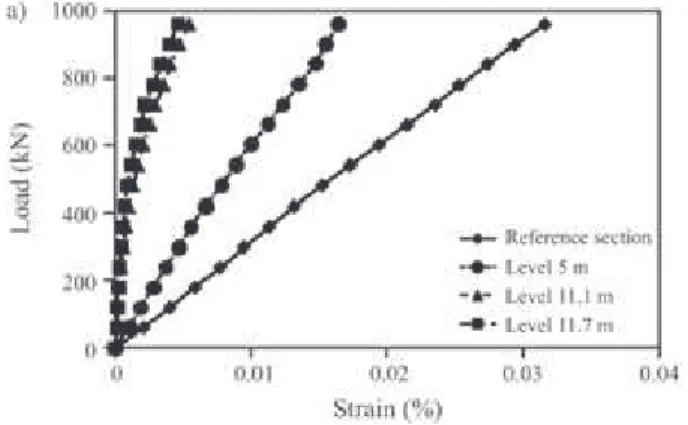
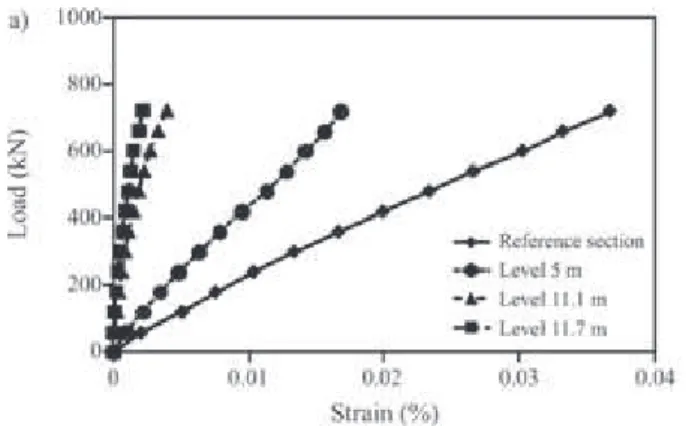
3.4.4. Response to instrumentation
Strain gages were installed in the CFA piles in the same way and depths as in the bored piles.
Table 3 shows the values of the Young’s modulus for each pile, obtained by applying the aforementioned method. The gage level at 0.3 m gave a load equal to the ap-plied load at pile head. Plots (a) and (b) of Figs. 12, 13 and 14 were prepared based on the tangent modulus method of Fellenius (1989). It can also be seen that the elasticity modulus of CFA 3 was lower than those obtained for the same type of pile. This fact can only be related to the char-acteristics of the concrete of these piles, which came from a different lot.
3.5. Case 3 - Omega pile
3.5.1 Execution technique
The Omega pile, also called screw pile, is a soil dis-placement auger pile based on a screwing in – screwing out
sequence. The execution can be outlined as follows: the au-ger head is inserted into the soil by rotation (Fig. 15), and the same CFA piles machine may be used; the soil is dis-placed downward and aside of the hole by the oriented slots fixed on the auger’s head at different well-selected loca-tions on the flanges; when drilling is over, as the auger is re-moved by rotation, concrete is injected under pressure. Concrete, with values of slump of around 240 mm, will have a minimum consumption of cement of 400 kg/m3.
Limitations to the use of this type of pile are the machine torque, which must be higher than 150 kN.m, and maxi-mum shaft length of 30 m. At present, diameters may range from 310 to 660 mm. During the execution, monitoring is essential to differ depth parameters, torque, penetration rate and concreting characteristics. The difference between Omega and CFA piles is related to removal of soil to the surface; while the first type does not remove soil (except for the small quantity that is entrapped around the outer part of the auger), which remains compressed around the pile shaft, the second technique removes most of the soil with the up and down movement. Van Impe (1988) emphasizes these differences between the two modes of execution. Omega piles were not mentioned in this paper, but a similar pile, “Atlas” pile, was referred. Its configuration may be as-sociated to Omega, despite some clear differences: cone shape and screw “pace” variation has peculiar characteris-tics but also move soil downward and to the sides (Fig. 16). The advantages of using Omega piles are their fast execu-tion, low noise and high loading capacities (Bustamante & Gianeselli, 1998). The 8 h daily production ranges from 120 to 200 linear meters. Concrete “over consumption” Figure 11-qcvariation in depth.
Figure 12- Results of intrumentation analysis for CFA pile 1.
Table 3- Concrete Young’s modulus as determined by strain gages and coefficient of variation for the three piles.
Pile Emin(GPa) Emax(GPa) E(GPa) CV(%)
CFA 1 22.8 24.3 23.5 2.0
CFA 2 20.7 21.9 21.4 1.7
ranges from 5 to 30%, depending on the soil, with a repre-sentative value of 15%. Some considerations about the exe-cution of these piles can be made (Van Impeet al., 1998):
the shape of the perforating element brings numerous bene-fits to penetration, but the increase in load capacity could not be proved. The author points out the need for more work; maximum machine torque is very important to the execution; penetration rate depends on pile diameter and soil type; more energy is spent to move soil than to
over-come friction between the drilling element and the soil; and this kind of pile does not present problems when executed
Figure 14- Results of intrumentation analysisfor CFA pile 3. Figure 13- Results of intrumentation analysis for CFA pile 2.
in saturated and soft granular regions, while the fact that the soil is not dug brings several benefits.
3.5.2. Information on execution
Three 12 m deep Omega piles with 0.37 m diameter were executed. Concrete and reinforcement steel had the same characteristics and properties as those used in CFA pile.
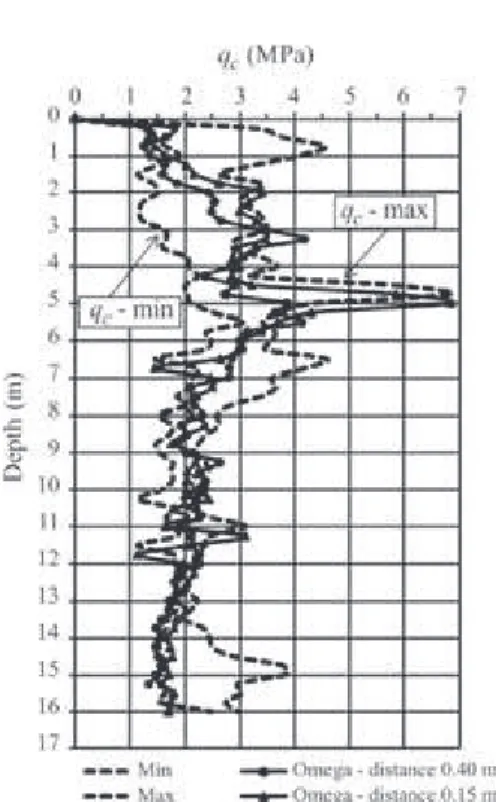
3.5.3. Effect of installing piles in the subsoil
Similarly to what had been done to CFA piles, CPT tests were performed after installation of Omega-T pile. The results are shown in Figs. 17 and 18. It can be noticed that, in general,fsandqcvalues were between the maximum
and the minimum limits of undisturbed soil. Moreover, in the first 6 m depth, CPT 4 values in the distance 0.15 m to the pile exceeded the maximum limits in some points along the pile length. Such fact was more evident in friction resis-tance (fs), as it should be expected; it was verified, though,
that fscurves in a distance of 0.4 m (in CPT 2) were within
the limit intervals, indicating that, for such distance, it seems that there is no pile influence. Based on these results, it is possible to conclude that, in the first 6 m depth, friction (fs) and tip (qc) resistances, in distance of 0.15 m from the
Omega pile, exceeded the maximum values obtained for undisturbed soil (first layer). Below 6 m,fsandqc,
resis-tances were within the limits of variation for undisturbed soil (the horizon of residual soil), although there was still a slight tendency of these parameters, particularlyfs, to
ap-proximate to the upper limit.
As it will be mentioned further on in the text, the Omega pile was extracted from the ground. It was observed that soil close to the shaft was more compacted than the soil located farther away. It was decided to collect samples at 5 cm and at 50 cm, from the shaft at 11 m depth. Tests were performed to determine natural volume weight (g), water content (w) and void ratio (e). The results are
shown in Table 4.
From this analysis, with emphasis on void ratio (e), it can be concluded that soil samples collected closer to the pile are denser, confirming the evaluation made by vi-sual inspection. Based on the values presented above and those obtained in the consolidation test carried out in the natural soil (Table 5), in an exercise for a mere qualitative estimation of the vertical stress needed to change void ra-tio from 1.60 to 1.23, the value obtained was 682 kPa, which is over 4 times the effective overburden stress at 11 m depth.
In this context, it can be stated that installing Omega piles caused major changes around the pile shaft.
3.5.4. Response to instrumentation
Extensometers were installed in the Omega piles in the same way and same depths as in the bored and CFA
Figure 17-fsvariation in depth. Figure 18-qcvariation in depth.
Table 4- Physical indexes of soil samples, extracted at 11 m of
depth.
Shaft distance g(kN/m3) w (%) e
5 cm 17.5 31.1 1.23
piles. The elastic modules (Young’s modulus) were ob-tained in the same way.
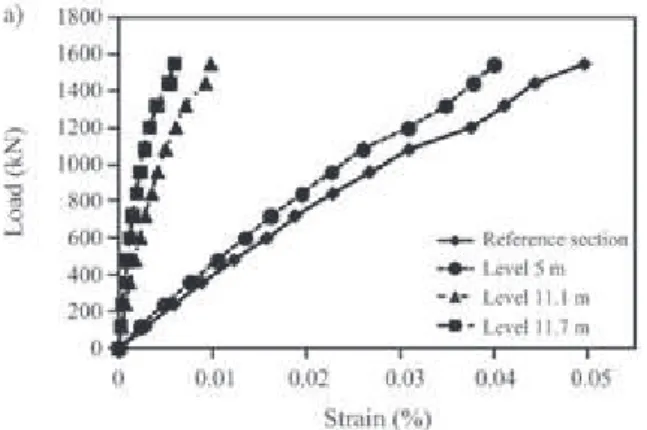
Table 6 shows values for elastic modulus obtained for each pile, and plots (a) and (b) of Figs. 19, 20 and 21 were again prepared based on the tangent modulus method of Fellenius (1989).
In Figs. 19, 20 and 21,Es.Skeeps constant values, but
it did not correspond to the curves for deepest levels (11.1 and 11.7 m). This may be due to the sudden rupture when it moved from the second to the last load applied to each pile that was analyzed. If the load increase had been smoother from the next to last load increment, the constancy of this product would have been revealed. An observation of
Table 6 shows that the value of Young’s modulus of the Omega 2 pile is much higher than that of the other two piles. This is associated to the characteristics of different lots of concrete.
3.5.5. Unit shaft friction resistance
Values of maximum unit shaft friction resistance (fmax)
are shown in Table 7 for all instrumented piles, including a precast concrete pile installed in the experimental site (Al-buquerque, 1996). They were computed for 2 segments: 0 to 5 m and 5 to 12 m, related to the two soil horizons previ-ously described. The table also shows average values along the entire length of the shaft for each type of pile (Albu-querque, 1996).
We were not able to get skin friction for the segments 0 to 5 m and 5 to 12 m of Omega 1 and 2 piles because the
Table 5- Parameters used to calculate vertical stress.
Parameter Used value
eo 1.60
Cc 0.6
¢
sa 140 kPa
g 15.0 kN/m3
eo= baseline index of voids. Cc= compression index,sa¢=
pre-consolidation stress (mean),g= specific natural weight of soil.
Table 6- Young’s modulus of concrete as determined by strain
gages and coefficient of variation for the three piles
Pile Emin(GPa) Emax(GPa) E(GPa) CV(%)
Omega 1 24.9 31.3 28.4 7.5
Omega 2 37.8 52.0 45.9 9.9
Omega 3 28.2 28.6 28.4 0.5
Figure 19- Results of intrumentation analysis for Omega pile 1.
instrument located 5 m deep for both piles did not produce consistent data.
An analysis of these results shows that in the first seg-ments (0-5 m), where soil is weaker, the average value of
fmaxfor CFA piles was 76 kPa, exceeding not only the values
of 32 kPa for the bored pile and 45 kPa for Omega 3 pile, but also the value of 45 kPa, associated to the second seg-ment of the CFA piles, respecting the residual soil profile; this singular behavior was due to variation in diameter of the shaft of CFA pile.
It will be shown later (item 3.6B) that, in the execu-tion of CFA piles, the diameter in the first meters increases bulging effect, which turns to be the main reason for the in-crease in lateral friction.
The increased skin friction was above the expecta-tion, even if we consider the mean increase in pile diameter. This may be due to the tapered shape of the pile in the seg-ment, which may have mobilized the passive thrust, as shown in Nordlund (1963) in his mathematical model for calculation of rupture of tapered piles. However, if this fac-tor is not taken into consideration, it can be said that lateral friction values for the first segment (0 to 5 m), observed in
CFA piles, without taking the bulging effect into account, may situate these type of piles at the same level as bored piles, with general values of 32 kPa, therefore, lower than Omega piles.
As for the second segment (5 to 12 m), CFA and bored piles provided friction values of the same order of magnitude,i.e., 45 kPa and 48 kPa, respectively.
As for the Omega helical pile, an average value offmax
of 45 kPa was derived for the first segment (Table 7), roughly 40% higher than the corresponding value for the bored piles (32 kPa). In the second segment (5-12 m), this difference increased considerably, from 48 kPa in bored piles to 108 kPa in the Omega piles, which is 125% higher. This ratio increases to 140% when comparing Omega to with CFA piles.
Comparing the overall averages (Table 7), it may be concluded that fmax of Omega piles was 110% and 50%
higher than the values of bored and CFA piles, respectively. This confirms that the execution process of Omega piles significantly changed soil characteristics and in-creased soil resistance.
Table 7- Maximum Unit Lateral Resistances (fmaxin kPa).
Pile/Segments 0-5 m 5-12 m 0-12 m (average) 0-5 m (average) 5-12 m (average) 0-12 m (overall average)
Bored 1 39 44 40 Bored 2 21 54 40 32 48 41 Bored 3 35 46 41 CFA 1 80 47 60 CFA 2 80 53 63 76 45 57 CFA 3 69 36 49 Omega 1 - - 97 Omega 2 - - 80 45 108 86 Omega 3 45 108 82 Precast 24* 43** 29 - - 29 * Segment 0-10 m ** Segment 10-14 m.
As far as the precast driven pile is concerned, it was not possible to compare the values indicated in Table 7, at least for the first segment because the shaft got detached due to driving vibration: the porous soil detached from the shaft (Albuquerque, 1996). This effect was also observed by Menezes (1997) in driven piles in porous soil in Ilha Solteira (SP). As to the second segment, the friction made by precast driven piles (43 kPa) was close to that of bored piles (48 kPa) and CFA piles (45 kPa), but it was far from the friction of Omega piles (108 kPa).
3.5.6. Tip unit resistance
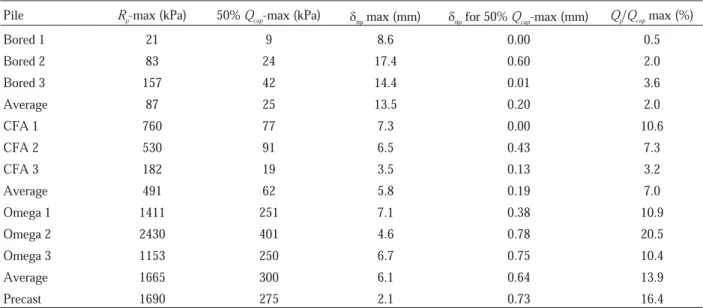
In what follows, an analysis of the behavior of pile tips – specifically in what respects to tip bearing capacity – is presented based on the values of tip unit resistance (Rp) and maximum tip reaction, taken as the ratio of the maxi-mum load applied to the pile tip, which is included in Table 8. Attention should be paid to the dispersion of val-ues for each type of pile. The last line refers to the precast pile, driven in the same site and with the same length as the other piles. Rp values refer to the maximum load obtained from the load tests.
These results show that, in average, the unit tip resis-tance (maximum) for the Omega piles was 3.4 and 19.1 higher than the values of the CFA and bored piles. It was also revealed to be of the same magnitude as the unit tip re-sistance of the precast pile.
Another conclusion that could be inferred from Table 8 is related to the important design factor,i.e., the expected
ratio between maximum tip reactions (effective stress
transmitted to the base of the pile) and the maximum loads applied to the top cap. The largest value corresponded to the precast pile (16.4%), as expected from the nature of the ex-ecution process, but with very close values for the Omega piles (13.9%), which could be considered a “good” sur-prise. On the other side, CFA piles (with a ratio of around 7.0%) and bored piles (with 2.0%) reflected the already foreseen incapacity of mobilizing significant tip reactions, at least for acceptable overall displacements.
Summing it up, it can be said that, as far as tip behav-ior is concerned, CFA piles behaved between bored piles and displacement piles, and Omega piles showed a clear improvement, typical of displacement piles.
We can see that the tip load is not mobilized to the corresponding load at 50% of the maximum load of the test. Figure 22 shows the variation in maximum unit skin friction (mean) and the tip resistance (maximum) of each pile.
3.6. Analysis of pile shape after extraction from the
terrain
After the load tests, three piles were extracted from the terrain, one of each type (bored 1, CFA 2 and Omega 2) (Fig. 23).
After cleaning the shafts, it was possible to analyze their characteristics (Figs. 24 to 31). Figure 32 shows the diameters along the length of the piles.
A detailed inspection provided important information about shaft surface, geometry and tip shape.
A) Bored pile: Table 8- Tip unit resistance (Rp), tip displacement and ratio of tip reaction.
Pile Rp-max (kPa) 50%Qcap-max (kPa) dtipmax (mm) dtipfor 50%Qcap-max (mm) Qp/Qcapmax (%)
Bored 1 21 9 8.6 0.00 0.5 Bored 2 83 24 17.4 0.60 2.0 Bored 3 157 42 14.4 0.01 3.6 Average 87 25 13.5 0.20 2.0 CFA 1 760 77 7.3 0.00 10.6 CFA 2 530 91 6.5 0.43 7.3 CFA 3 182 19 3.5 0.13 3.2 Average 491 62 5.8 0.19 7.0 Omega 1 1411 251 7.1 0.38 10.9 Omega 2 2430 401 4.6 0.78 20.5 Omega 3 1153 250 6.7 0.75 10.4 Average 1665 300 6.1 0.64 13.9 Precast 1690 275 2.1 0.73 16.4
Rp= tip unit resistance.
Qcap= maximum cap load.
d= tip displacement.
• the diameter ranged from 42.4 cm to 45.9 cm, aver-aging 45.0 cm with standard deviation of 0.96 cm;
• the effective average diameter was about 13% higher than the nominal diameter;
• the tip had sharp geometry in one of the sides (asym-metric) (Fig. 24); and,
• the shaft surface was clearly rough (Fig. 25). B) CFA pile:
• the pile tip was molded by using a drilling bit (Fig. 26), diverging from the cone-shaped tip, as reported by Souza (2006);
• ‘strips’ were formed by the auger drilling all along the pile length (Fig. 27);
• a bulb-shaped bulge was observed, which means an increase in the diameter of a pile segment between 1.5 and 3.0 m depths;
• the diameter ranged from 37.9 cm to 48.9, averaging 40.4 cm with standard deviation of 2.78 cm.
C) Omega pile:
• the shaft had a screw spiral-shape (like a ‘nervure’), with a ‘pace’ of 30 cm through the first 6 m (Fig. 28) and of
Figure 22- Variation of maximum unit lateral resistance
(aver-age) and tip reaction.
Figure 23- Pile extraction.
Figure 24- Bored 1 pile tip.
Figure 25- Shaft view in bored 1 pile (2ndplan) and in Omega 2
pile (1stplan).
12 cm through the last 6 m (Fig. 29); this may be due to the difference in the auger penetration velocity along the two layers of soil;
• Shaft surface roughness is high, caused by small gravels used in the concrete, as if they were detached from the cement paste and compacted against shaft wall;
• the soil was strongly adhered to the shaft, firmly compacted, with thickness ranging between 5 and 8 cm (Fig. 30);
• the rounded shape of the pile tip (Fig. 31); and, • the diameter ranged from 37.8 cm to 41.7 cm, aver-aging 39.2 cm with standard deviation of 1.11 cm; the shape of the tip was rounded, as shown in Fig. 32.
We can see that only the actual mean diameter of the CFA pile was equal to the nominal diameter (Table 9).
By calculating unit skin friction using the actual mean value obtained for the bored and Omega piles, we get the values shown in Table 10.
Table 10 indicates reduced skin friction because of the increased side area due to a greater diameter. This causes a reduction in lateral friction of approximately 12% for bored piles and 9% for Omega piles.
Figure 27- Shaft view in CFA 2 pile (1stplan).
Figure 28- Omega pile in 5.5 to 7.5 m depth segment.
Figure 30- Soil adherence in shaft of Omega 2 pile. Figure 29- Omega pile in 9.0 to 10.5 m depth segment.
4. Conclusion
This study reviewed the influence of construction techniques on the behavior of piles by means of instrumen-tation along the shaft. Based on the analyses performed, the following conclusions stated below could be drawn. The values shown for skin friction and tip resistance refer to load mobilized to the maximum load applied in the test.
4.1. Tip resistance
The maximum load transfer to the base of piles was relatively small: an average of 2% for the bored pile, 7% to the CFA pile and 14% for the Omega pile. The latter ratio is similar to the one seen in the precast driven pile tested in the same site. The construction processes of bored piles strongly disturb the soil around the tip and leave it unstruc-tured, leading to low tip resistance (87 kPa). In this aspect, the CFA pile had an intermediary behavior (491 kPa) and
the Omega pile showed a high value (1665 kPa), very simi-lar to the concrete precast pile (1690 kPa). Low values for bored piles were also obtained by Branco (2006), who pre-sented a detailed study on shaft and tip load transfer in this type of piles.
The pile tip mobilization to the three types of piles was low for 50% of the maximum load of the test.
4.2. Unit shaft friction resistance
As expected, the unit shaft friction resistance (fmax)
in-creased with depth for bored and Omega piles: the deeper soil layer is more resistant than the more superficial one. For the CFA pile, side friction was higher in the upper seg-ments of the pile due to the formation of a bulb-shaped bulge, which was clearly observed in this area. For the 5 to 12 m depth horizon, values offmaxwere 48 kPa for the bored
pile and 45 kPa for the CFA pile. If the mentioned bulge ef-fect is ignored, it may be concluded that both types of piles have similar behavior in terms of lateral resistance. The Omega pile, with ‘nervures’, intense roughness and densi-fied soil around the shafts presented averagefmaxvalue of
86 kPa, much higher than the other piles: 41 kPa for the bored pile and 57 kPa for the CFA pile.
4.3. Pile extraction
After extraction, it was observed that the bored and the CFA piles presented little roughness. In the latter, strips were clearly seen along the shaft. Moreover, the CFA pile displayed a bulb-shaped bulge from 1.5 to 3.0 m depths;
Roughness of the Omega pile was higher, due to the presence of small gravels along the length; spaced nervures measuring 30 cm in the first 6 m and 12 cm in the last 6 m were also observed, with soil strongly adhered and com-pacted to the shaft.
The tips had different shapes, sharp in the bored pile, similar to drill edge in CFA pile and rounded in the Omega pile.
4.4. Instrumentation along the depth
The use of extensometers (strain-gages) fixed in steel bars showed that this technique gives a high return value, since the data obtained proved to be very consistent with other results and evidence in overall behavior (Albuquer-que, 2001).
The results show different behaviors of piles with val-ues for tip resistance and skin friction not known yet for this type of soil. This demonstrates the importance of perform-ing load tests in foundation engineerperform-ing.
References
Associação Brasileira de Empresas de Fundações (ABEF) (1999) Manual de Especificações de Produtos e Pro-cedimentos, 2ª ed. ABEF, São Paulo, 282 pp.
Albuquerque, P.J.R. (1996) Análise do Comportamento de Estaca Pré-Moldada de Pequeno Diâmetro, Instrumen-Table 10- Maximum unit skin resistances of actual diameter of
bored and Omega piles (fmaxin kPa).
Pile/segments 0-5 m 5-12 m 0-12 m (average)
Bored 1 35 39 36
Omega 2* - - 76
*The Omega 2 pile has no friction values presented in the interme-diate segments, because of the instrument located 5 m deep did not produce consistent data.
Table 9- Values of mean nominal and actual diameters of piles extracted from the soil.
Pile Nominal (m) Actual (m)
Bored 1 0.40 0.44
CFA 2 0.40 0.40
Omega 2 0.37 0.39
tada, em Solo Residual de Diabásio da Região de Cam-pinas. M.Sc. Thesis, Faculdade de Engenharia Agrí-cola, Universidade Estadual de Campinas, Campinas, 170 pp.
Albuquerque, P.J.R. & Carvalho, D. (1999) Análise de transferência de carga de estaca pré-moldada em solo residual de diabásio. Solos & Rochas. v. 22:2, p. 125-136.
Albuquerque, P.J.R. (2001) Estacas Escavadas, Hélice Contínua e Ômega: Estudo do Comportamento à Com-pressão em Solo Residual de Diabásio, Através de Pro-vas de Carga Instrumentadas em Profundidade. PhD. Thesis, Escola Politécnica, Universidade de São Paulo, São Paulo, 263 pp.
Associação Brasileira de Normas Técnicas (ABNT) (1992) NBR 12131: Estacas: Prova de Carga Estática. Rio de Janeiro.
Branco, C.J.M.C. (2006) Provas de Carga Dinâmica em Estacas Escavadas de Pequeno Diâmetro com Ponta Modificada. PhD. Thesis, Escola de Engenharia de São Carlos, Universidade de São Paulo, São Carlos, 192 pp. Bustamante, M. & Gianeselli, L. (1998) Installation
param-eters and capacity of bored piles. Proc. 3rdInternational
Geotechnical Seminar on Deep Foundations on Bored and Auger Piles, Ghent, pp. 95-108.
Carvalho, D.; Albuquerque, P.J.R. & Giacheti, H.L. (2000) Campo experimental para estudos de mecânica dos so-los e fundações em Campinas-SP. In: Seminário de Engenharia de Fundações Especiais – SEFE IV, Semi-nário Brasileiro de Investigações de Campo - BIC. São Paulo, v. 3, pp. 90-100.
Fellenius, B.H. (1989) Tangent modulus of piles deter-mined from strain data. ASCE, Geotechnical Engi-neering Division, the 1989 Foundation Congress, v. 1, pp. 500-510.
Fundesp (2001) Fundações Especiais, 1sted. Fundesp, São
Paulo, 62 pp.
Giacheti, H.L. (1991) Estudo Experimental de Parâmetros Dinâmicos de Alguns Solos Tropicais do Estado de São
Paulo. PhD Thesis, Escola de Engenharia de São Car-los, Universidade de São Paulo, São CarCar-los, 232 pp. Giacheti, H.L.; Peixoto, A.S.P. & Mondelli, G. (2004)
Comparação entre resultados de ensaios de penetração com os cones mecânico e elétrico em solos tropicais. Solos & Rochas, v. 27:2, p. 191-200.
Menezes, S.M. (1997) Análise do Comportamento de Esta-cas Pré-Moldadas em Solo de Alta Porosidade do Inte-rior do Estado de São Paulo. PhD Thesis, Escola Poli-ténica, Universidade de São Paulo, São Paulo, 377 pp. Monacci, M.D. (1995) Estudo da Colapsibilidade de um
Solo do Campo Experimental da Faculdade de Enge-nharia Agrícola – Unicamp. M.Sc. Thesis, Faculdade de Engenharia Agrícola, Universidade Estadual de Cam-pinas, CamCam-pinas, 114 pp.
Nordlund, R.L. (1963) Bearing capacity of piles in cohe-sion less soils. Journal of the Soil Mechanics and Foun-dation Division, v. 89:3, p. 1-35.
Peixoto, A.S.P. (2001) Estudo do Ensaio SPT-T e sua Aplicação na Prática de Engenharia de Fundações. PhD Thesis, Faculdade de Engenharia Agrícola, Universi-dade Estadual de Campinas, Campinas, 468 pp. Souza, R.N. (2006) Observação do contato concreto-solo
da ponta de estacas hélice contínua. Anais. XIII Con-gresso Brasileiro de Mecânica dos Solos e Engenharia Geotécnica, Curitiba, v. 2, pp. 1253-1258.
Van Impe, W.F. (1988) Considerations on the auger pile design. Proc. 1stInternational Geotechnical Seminar on
Deep Foundations on Bored and Auger Piles, Ghen, pp. 193-218.
Van Impe, W.F.; Van Impe, P.O.; Viggiani, C.; Russo, G. & Bottiau, M. (1998) Load-settlement behavior versus distinctiveW-pile execution parameters. Proc. 3rd
Inter-national Geotechnical Seminar on Deep Foundations on Bored and Auger Piles, Ghent, pp. 355-366.
Velloso, D.A.; Aoki, N.; Lopes, F.R. & Salomon, J.A (1975) Instrumentação simples para provas de carga em tubulões e estacas escavadas. Simpósio Sobre Instru-mentação de Campo em Engenharia de Solos e Funda-ções, Rio de Janeiro, v. 1, pp. 269-280 (In Portuguese).