The effects of Hyperloop on the long-range
personal and freight transportation industry in
Europe
Filipe Alves
Dissertation written under the supervision of André de Almeida
Pinho
Dissertation submitted in partial fulfilment of requirements for the MSc in
Management with specialization in Strategy and Entrepreneurship, at the
2
ABSTRACT
The effects of Hyperloop on the long-range personal and freight transportation
industry in Europe
By Filipe Alves
The transportation industry has experience little disruptive technologies since the introduction of airplane, over 100 years ago. Nevertheless, the sector is of extreme importance in connecting people and businesses together. Hyperloop technology brings the promise of a new, faster and cleaner mode of transport that could disrupt current transportation modes. To understand the potential effects of the disruptive technology, the author analyses the current long-range freight and personal transportation industry, the modes and its characteristics and the competition between them. Hyperloop has more potential to affect the personal segment, and particularly airlines. On the freight side, the impact will be confined to the road and air modes of transport, and its degree will be lower. Once the technology is fully operational, airlines should focus on intercontinental routes where air transportation is the only mode available. LCC, relying solely on continental routes, will have difficulties in making the transition and many will leave the market. FSA and LCC will engage in M&A for operational efficiency and enlargement of hub-and-spoke networks. Air freight carriers rely mostly in intercontinental routes and should not experience a business model change. Road transportation is increasingly focusing on the “last-mile” of transportation services and may benefit from decongestion of roads caused by a shift to Hyperloop in the long-range freight transportation in Europe. Environmental impact of mode shift is considerable and is mostly caused by a shift in domestic and continental routes from air to Hyperloop transportation.
O setor de transporte tem experienciado poucas tecnologias disruptivas desde a introdução do avião, há mais de 100 anos. Contudo, o setor é muito importante para conectar pessoas e empresas. O Hyperloop traz a promessa de um novo modo de transporte mais rápido e limpo que pode perturbar os modos de transporte atuais. Para entender os seus efeitos potenciais, a atual indústria de transporte pessoal e mercadorias de longo alcance, os modos, suas características e concorrência entre elas é analisada. O Hyperloop tem mais potencial para afetar o segmento de passageiros, principalmente as companhias aéreas. No lado das mercadorias, o impacto será limitado aos modos de transporte rodoviário e aéreo, e o grau será menor. Quando a tecnologia estiver operacional, as companhias aéreas concentrar-se-ão em rotas intercontinentais nas quais o transporte aéreo é monopolista. As LCC, operando apenas rotas continentais, terão dificuldades em fazer a transição e algumas deixarão o mercado. As FSA e as LCC envolver-se-ão em fusões e aquisições para eficiência operacional e ampliação de redes hub-and-spoke. As transportadoras aéreas de mercadorias dependem principalmente de rotas intercontinentais e não devem sofrer alterações no modelo de negócios. O transporte rodoviário concentra-se cada vez mais na “última milha” do transporte e pode beneficiar do descongestionamento de estradas causada pela mudança no transporte de mercadorias de longo alcance na Europa para Hyperloop. O impacto ambiental da mudança de modo é considerável, sendo causado principalmente por uma mudança nas rotas domésticas e continentais do transporte aéreo de passageiros para Hyperloop.
3
Key Words: European transportation industry; Freight transportation industry; Hyperloop;
4 AKNOWLEDGEMENTS
I would like to start by thanking André de Almeida Pinho, my supervisor for the master thesis dissertation, for his feedback and availability throughout the entire process. I further extend this gratitude to all the colleagues who attended the seminar sessions with me and provided valuable feedback.
I would also like to thank José Costa Faria, Nelson Sousa, Thierry Boitier and Cristian Santibanez for their availability and kindness in conceding the interviews and providing valuable insights that certainly added value to this work.
To my family, especially my mother, my father and brother, for being a constant source of motivation and support.
Last but not least to my grandfather, who although is not amongst us already, has always contributed and rooted for my success and is always on my mind in moments of celebrations.
5 TABLE OF CONTENTS TABLE OF CONTENTS ...5 LIST OF TABLES ...7 LIST OF ABREVIATIONS ...8 1-INTRODUCTION ...9 2-LITERATURE REVIEW ... 10
2.1-TRANSPORTATION INDUSTRY IN EUROPE: AN OVERVIEW ... 10
2.2-FREIGHT INDUSTRY ... 11
2.2.1- FREIGHT TRANSPORTATION MODES: AN OVERVIEW ... 11
2.2.2- INTERMODAL FREIGHT TRANSPORT MARKET DYNAMICS AND COMPETITON ... 12
2.3-PASSENGER INDUSTRY ... 14
2.3.1- PASSENGER TRANSPORTATION MODES: AN OVERVIEW ... 14
2.3.2- LONG-RANGE PASSENGER TRANSPORT MARKET DYNAMICS AND COMPETITON ... 15
2.4-HYPERLOOP... 17
3. METHODOLOGY ... 21
3.1. PRIMARY DATA COLLECTION ... 21
3.2. SECONDARY DATA COLLECTION ... 22
4-ANALYSIS AND FINDINGS ... 23
4.1-HYPERLOOP POTENTIAL ON THE LONG-RANGE PERSONAL AND FREIGHT TRANSPORTATION INDUSTRY... 23
4.1.1-LONG-RANGE PERSONAL TRANSPORTATION ... 23
4.1.2-LONG-RANGE FREIGHT TRANSPORTATION ... 26
4.1.3-HYPERLOOP TECHNOLOGY ... 29
4.1.4-WHAT IMPACT WILL HYPERLOOP HAVE ON THE LONG-RANGE PERSONAL AND FREIGHT TRANSPORTATION INDUSTRY? ... 32
4.1.4-1- IMPACT OF HYPERLOOP ON THE LONG-RANGE PERSONAL TRANSPORTATION INDUSTRY ... 32
4.1.4-2- IMPACT OF HYPERLOOP ON THE LONG-RANGE FREIGHT TRANSPORTATION INDUSTRY ... 34
4.2-SCENARIOS ... 35
6
4.2.2- OUTLOOK ... 36
4.2.3- POTENTIAL SCENARIOS ... 36
4.2.4-ASSENSSING THE LIKELIHOOD OF THE SCENARIOS ... 39
4.2.5- DESCRIBING THE PROBABLE SCENARIO ... 41
4.2.6- WHAT WILL THE LONG-RANGE PERSONAL AND FREIGHT INDUSTRY IN EUROPE LOOK LIKE ONCE THE TECHNOLOGY IS ADOPTED AND OPERATIONAL ... 43
5. CONCLUSION ... 45
5.1 LIMITATION AND POTENTIAL FOR FUTURE RESEARCH ... 46
6. REFERENCES ... 47
7. APPENDICES ... 52
7.1. INTERVIEW 1- JOSÉ COSTA FARIA (DHL) ... 52
7.2. INTERVIEW 2- NELSON SOUSA (JSL; ANTRAN) ... 54
7.3. INTERVIEW 3- THIERRY BOTIER (TRANSPOD) ... 57
7.4. INTERVIEW 4- CRISTIAN SANTIBAÑEZ (HYPERLOOP TRANSPORTATION TECHNOLOGIES) ... 61
7
LIST OF TABLES
Table 1- Interviewees Identificaation ... 22
Table 2- Impact of Hyperloop on FSA ... 32
Table 3- Impact of Hyperloop on LCC ... 32
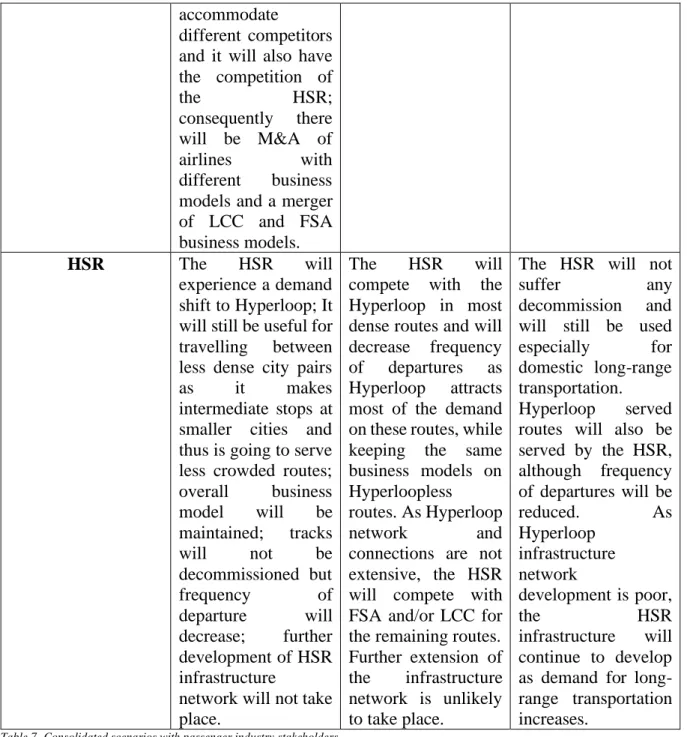
Table 4- Impact of Hyperloop on HSR ... 33
Table 5- Impact of Hyperloop on air transportation... 34
Table 6- Impact of Hyperloop on road transportation ... 34
Table 7- Consolidated scenarios with passenger industry stakeholders ... 38
Table 8- Consolidated scenarios with freight industry stakeholders ... 39
8
LIST OF ABREVIATIONS
EU European Union FSA Full-service airlines HSR High-speed rail IA Interview A IB Interview B IC Interview C ID Interview D LCC Low-cost carriers LR Literature review
M&A Mergers and acquisitions OSS Other secondary sources USTD United States Transportation
9
1-INTRODUCTION
Hyperloop is a new mode of transportation that moves freight and people quickly, safely, on-demand and direct from origin to destination. Passengers or cargo are loaded into the hyperloop vehicle and accelerate gradually via electric propulsion through a low-pressure tube. The vehicle floats above the track using magnetic levitation and glides at airline speeds for long distances due to ultra-low aerodynamic drag. It’s autonomous, avoiding possibility for pilot error. Additionally, it’s a safe and clean technology (Virgin Hyperloop One website 2019).
The present dissertation aims at exploring a new transportation technology, Hyperloop, and assess its potential impact on the long-range personal & freight transportation industry.
The academic relevance of the topic is understanding how a new, faster way of transportation can impact existing industries and cities by shorten relative distances, one hundred years after the last transportation technology was invented, and the application of theoretical frameworks to this specific topic, thus creating a structured literature of a topic where research is yet taking its first steps.
For managers, relevance lies on understanding the potential of the new technology, how it can shape businesses and threaten established industries, and the possibilities that will emerge with such changes.
The research questions addressed are the following:
1. What impact does Hyperloop have on the long-range personal & freight transportation industry in Europe?
2. How will this industry look like in Europe, given Hyperloop’s full adoption?
The analysis begins with an overview of the European transportation market and analyses the freight and personal long-range transportation industries separately, as well the characteristics of different competing modes, the dynamics and competition in each industry. A separate section analyses Hyperloop, the principal companies developing the technology and its potential competitive advantages and disadvantages. Expert interviews allow for complementing analysis of consolidated academic literature and other secondary sources.
10
2-LITERATURE REVIEW
2.1-TRANSPORTATION INDUSTRY IN EUROPE: AN OVERVIEW
In the European Union, the industry employs 10.5 million people and is constituted by a network of around 1.2 million firms. The sector is paramount to the UE, as an efficient transport service and infrastructures are vital, not only to the economy but to boost social cohesion. Furthermore, the industry is also heavily related to environmental issues. (EU, Current Trends and Issues 2018).
The challenges for the transport sector in Europe for the upcoming years are the following: • Creating a well-functioning Single European Transport Area, connecting Europe with
modern, multi-modal and safe infrastructure networks; • Shifting towards a low-emission mobility. (UE, 2017)
It is estimated that around 13% of European’s final consumption is due to transportation. The current situation, a fragmented transport market in EU, will leave its growth potential untapped (EU, Current Trends and Issues 2018).
Dealing with the negative externalities is also a key issue in the European Union. The main external costs are:
• Greenhouse gas emissions; • Local air pollution;
• Capacity bottlenecks; • Accidents;
• Noise.
In 2015, transport was responsible for 33% of final energy consumption and 24% of greenhouse gas emissions in EU. There is a growing trend towards more cooperative intelligent transport systems and driverless piloting activities. Hence, increasing investment from the private sector in strategic transport infrastructure will be essential (EU, Current Trends and Issues 2018). New concerns, such as energy consumption and climate change, can drive governments to match their words into action (Michel Savy 2009).
11
2.2-FREIGHT INDUSTRY
The transportation services industry consists of the air, marine, rail, and road freight sectors and, in 2016, it generated 482.6 billion dollars in revenues in Europe, (Marketline Global Transportation Industry Summary 2017). In 2017, 76.7% of all inland freight was transported by road, followed by rail which accounted for 17.6%, and inland waterways which was responsible for transporting 6% of inland freight. These statistics refer only to inland freight transportation and thus does not include maritime and air freight transportation (Eurostat 2019).
2.2.1- FREIGHT TRANSPORTATION MODES: AN OVERVIEW
Road transportation allows to carry the cargo on a door-to-door basis, but it is also popular on long-range freight transportation across borders. In 2017, international laden road transportation accounted for over 25% of all road freight transportation (Eurostat 2019). The rail freight transportation industry has reached its post-crisis peak in 2017, transporting 416 million tonne-kilometers. The industry has been growing steadily since 2012 but experienced a growth peak of 3.2% in 2017. In EU, international transport accounted for over 70% of all rail freight transportation, measured by tonne-kilometers or tonnes. Geographical location seems to play a key role in the share of international rail freight traffic (Eurostat 2019). Rail services, however, continue to be perceived as one of the poor performing services by EU consumers, scoring the 4th higher incidence of problems. Rail freight services are of low quality and reliability, mostly because there is a lack of coordination in cross-border capacity offer, traffic management and planning of infrastructure works. Lack of competition can also explain its poor performance (EU Current Trends and Issues, 2018). Rail is more likely to capture long-haul shipments (Kawamura, Mohamadian, Samimi 2011; Oum 1979). In addition, rail is also preferred for larger and heavier shipments (Kawamura, Mohamadian, Samimi 2011), but it’s not dominant in the segment. Big shipment allows important economies of scale, on the haulage and fixed costs. The consolidation of freight and rationalization of supply chain are crucial for rail competitiveness (Michel Savy 2009).
In 2017, intra-EU and extra-EU air freight and mail transport registered growths of 1.6% and 9.8%, respectively, which illustrates the rising importance of the international transport segment. Domestic flight also increased in 2017 by 4.9% (Eurostat 2019). 27 % of EU air freight was carried through German airports in 2017 (Eurostat 2019), followed by the United Kingdom and France, who together totalize over 50% of Europe’s air freight transportation (Eurostat 2019). Air transport is alternative for highly deteriorating goods, where transport time
12
is critical (Behrens & Berquist 2011) and courier traffic on continental long distances, after which the freight is carried by road. Carrying only 0.3% of total tonnage, it is worth 25% of the total trade value (Michel Savy 2009).
After a strong last quarter in 2016, global shipping seems to be recovering and has shown steady growth. Strong performance expectations for container shipping support a sustained momentum for trade growth. The shipping sector must shed weight and become more efficient. While building fewer ships and scrapping more, shared economy seems to be the panacea to most, with economies of scale coming from increased volumes of mergers & acquisitions or the creation of mega alliances (KPMG Transport Tracker 2017). Maritime is by far the dominant mode in tonnes carried on international transport, usual carrying large shipments over intercontinental distances (Michel Savy 2009).
2.2.2- INTERMODAL FREIGHT TRANSPORT MARKET DYNAMICS AND COMPETITON
Intermodal freight transport is the movement of goods in a single loading unit/vehicle that successfully uses two or more modes of transport without handling the goods themselves in changing modes (UN/ECE 2001), and where most of the route is traveled by rail, inland waterways or ocean going vessel (Bontenkoning & Macharis 2004). Its promotion was identified as critical in order to achieve a competitive transport system (Hanssen, Jorgensen & Mathisen 2012), as economic performance improves with the most suitable mode being used on each part of the trip (OECD 2011). The core of intermodal networks is the terminals where goods and logistic providers physically meet and interact (Netland,Stokland & Sund 2010). The predominant modes of transport for the longer hauls in the intermodal transport chain are rail, inland waterways and short sea/ocean shipping, where units are consolidated, and economies of scale apply (Janic 2007).
Modes have very different characteristics, considering type of commodity, size of shipment, distance and geographical coverage. Each mode is focused on one specific market. There is little overlap between the realms on which different modes compete, as each mode is better suited for one specific segment. Competition occurs mostly within modes and less between modes (Michel Savy 2009).
In 2009, intermodal transport represented only 5% of total freight in Europe. The low value reflects the insufficient performance of the operators, tampered by fragmentation of intermodal
13
organization among many autonomous operators. Intermodal transport requires internal coordination rather than external market driven cooperation, and integration rather than vertical competition (Michel Savy 2009).
Shipment specific variables such as commodity type, value, weight and/or special handling needs influence mode choice. These groups of variables are interdependent (Kawamura, Mohamadian & Samimi 2011), as there is a close link between the size of the shipments, the value of goods and the length of haulage (Michel Savy 2009). Speed is a more important criterion for industries producing goods with high value/kilogram ratio and short life cycles. Pharmaceutical companies are therefore more likely to ship by air, whereas construction companies are more likely to ship by rail (Hinkka &Punakivi 2006).
The choice for rail is price-sensitive when compared to the choice for truck, however the choice for truck is more sensitive to haul time than that of the choice for rail (Kawamura, Mohamadian & Samimi 2011). As volume of loads increase, the break-even distance between road or rail transport shortens at a decreasing rate (Janic 2007). The breakeven point is estimated at 500km, although it is shorter in Europe- about 240km (Michel Savy 2009). The distance transported by truck in pre and post-haulages does not influence intermodal preference (Hanssen, Jorgensen & Mathisen 2012).
The external cost of intermodal train is 28% of those of general freight truck, without accounting for congestion costs (Hanssen & Mathisen 2014; Kawamura, Mohamadian & Samimi 2011; Forkenbrock 2001). The use of other transport modes than road for long haul freight transport can therefore help achieving a more efficient transportation system (Hanssen & Mathisen 2014). If Europe charges only for transport costs and does not include environmental costs, road and air modes are favored in comparison with rail transport (kpmg, Friedrick, Link, Stewart & Nash 2006). Considering new concerns, such as energy consumption and climate change, governments can be expected to match their words into action. Perspectives are that there will be no absolute modal shift, but a relative one. Road will still be dominant, with proportions in various modes benefiting the alternatives to roads (Michel Savy 2009). Knowledge about factors determining choice of transport services is key to understanding the freight market and design competitive transport systems (Floden, Bärthel & Sorkina 2010). Literature on transport mode decision-making provides valuable insights regarding the match between shipper’s demands and transport mode characteristics, although it is not consensual.
14
Price is the most important determinant when choosing transportation mode (Danielis & Marcucci 2007; Hinkka et al. 2006). Water transport is the cheapest transport mode, followed by rail, three times higher, truck, thirty-five times higher and finally air, eighty-three times higher (Ballou 2004). The development of logistics emerged non-cost factors to play a significant role (Arunotayanun & Polak 2007), and there is a growing proportion of shippers seeking to optimize their comprehensive logistics cost, which means that sometimes a more expensive transport translates into a lower inventory volume (Michel Savy 2009). Average delivery time and delivery time reliability were regarded as the most important drivers (Balou 2004). Reliability, flexibility and safety also enter choice analysis (Norojons, Young 2003). Transport cost, delivery time, quality and flexibility of service were found to be significant determinants of the decision-making (Arunotayanun & Polak 2007). The importance of transport cost depends on the time cost of cargo, as highly perishable goods loose immense value if its delivery is delayed (Lervåg, Meland & Wahl 2001). Reliability and availability of each mode were considered the most important drive on transportation mode choice (Evers, Harper & Needham 1996). Haul time and reliability tend to be more important than cost (McGinnis 1979). Accessibility, reliability, cost time, flexibility and past experience with each mode are significant characteristics influencing the decision-making process. Familiarity with the mode, especially trucking, has a strong influence on mode choice behavior (Kawamura, Mohamadian & Samimi 2011).
2.3-PASSENGER INDUSTRY
Passenger transport refers to the total movement of passengers using inland transport on a given network (Eurostat 2019). According to the Eurostat, the principal mode of passenger transport is passenger car which accounted for 82.9% of inland passenger transport in EU in 2016 (Eurostat 2019).
2.3.1- PASSENGER TRANSPORTATION MODES: AN OVERVIEW
The passenger car main advantages are a greater mobility and flexibility, especially within cities (Eurostat 2019).
The rail passenger transport performance in 2017 increased by 3%, maintaining the growth trend it has been having since 2013. International transportation in the majority of analyzed countries accounted for less than 8% of the total rail transportation. Only three countries (France, Czech Republic and Luxembourg) accounted for more than 100 passenger-kilometers per inhabitant. It reflects the proximity of international borders, the importance of cross-border
15
commuters within the workforce, access to high-speed train links and whether international transport corridors run through a country (Eurostat 2019).
Air passenger transport performance followed the growth observed in previous years, increasing 7.2% between 2016 and 2017. It is worth to indicate that five countries, namely the United Kingdom, Germany, Spain, France, and Italy, represented two thirds of all air transportation across EU (Eurostat 2019). Intra-EU flights represented 47% of all flights, followed by extra-EU transport which accounted for 36%. National transport has the lightest weigh in air passenger transportation with only 17% of all air passenger traffic. Although most of the flights are destined to an EU destination, it seems international flights congest airport traffic in the biggest European airports (Eurostat 2019; KPMG Transport Tracker 2017). Low cost carriers have become increasingly popular, accounting for 48% of EU market seat capacity in 2015. Airlines have already begun to take steps to embrace green initiatives and may consider further efforts to enhance fleet fuel efficiency (KPMG Transport Tracker 2017).
2.3.2- LONG-RANGE PASSENGER TRANSPORT MARKET DYNAMICS AND COMPETITON
In the competition for passengers are full-service airlines (FSA), low-cost carriers (LCC) and high-speed rails (HSR), which compete indirectly between themselves (Lijesen & Behrens 2016).
FSA are airlines that focus on providing a wide range of pre-flight and onboard services, including different service classes, and connecting flights (Reichmuth 2008).
LCC focus on cost reduction in order to implement a price leadership strategy on the markets they serve (Reichmuth 2008).
Competition between established airlines is weak even if offering similar flights, with price responses to price changes of other airlines being very low (Van Den Dogaard & Lijesen 2019). Incumbent airlines respond to threats of entry of other airlines by dropping fares, before the airline starts operating that route and after it has entered (Goolsbee &Syverson 2005).
After exogenous shocks as the economic downturn of 1999 or the tragedy of 9/11, which prompted a demand shift to cheaper or safer modes, pressure for consolidation on the aviation market increased (Reichmuth 2008). Other exogenous shocks, as airports constraints, allow a
16
greater degree of concentration with an open market access safeguard. M&A of airlines with different business model, LCC and FSA, is also trendy in the industry (Reichmuth 2008). Each group of stakeholders reacts differently to the HSR competition. FSA respond much stronger to HSR threats than LCC, since the latter usually competes from secondary airports (Lijesen & Behrens 2016). High response to an increase of seats offer by HSR may lead some FSA to reduce the number of seats offered even further, resulting in a smaller number of seats available in total (Lijesen & Behrens 2016). Some airlines decided to leave some routes after the optimal number of seats fell shorter than the optimal capacity (Behrens & Pels 2010). Some airlines experiencing high frequency elasticity of market share may leave the market as they cannot maximize profits (Lijesen & Behrens 2016).
The HSR can be competitive with air transport services for distances that can be covered in a maximum of 3 hours (González-Souvignat 2004), as its longer travel time is offset by higher frequency and lower fares (Behrens & Pels 2010).
Hence, different characteristics of each mode shape the competition between them and lead the demand towards a specific mode, thus it is paramount to comprehend the most valued characteristics for passengers. Connectivity and access time are the most important features of the competition between HSR and aviation in the London-Paris route (IATA 2003). When choosing whether to travel by car, train or plane in the Toronto-Montreal route, the most important determinant for passengers is total travel time (Koppelman & Wen 2000), which is intimately connected with the characteristics proposed by IATA: connectivity and access time. In addition to the travel time characteristic proposed by Koppelman & Wen, the travel time, the fares, frequency and trip purposes also play a major role on the passenger’s choice of transportation (González-Savignan 2004).
It is important, therefore, to distinguish between leisure and business passengers, as each of these groups values each commodity differently. Business passengers’ most valued characteristics are fares, road distance, weekly frequency, destination within the country, the use of electronic devices, and most important of all, total travel time (Behrens & Pels 2010). On the other hand, on-time arrival had little significance in business passenger’s choices. Leisure passengers are more heterogeneous as a group in valuing prices. Unlike business passengers, they give little importance to total travel time. Road distance, weekly frequency and fares are the most valued characteristics for this group (Behrens & Pels 2010).
17
Population density is also found to shift passengers from FSA to HSR, making the HSR more effective in cities with a compact development (Clewlow, Sussman & Balakrishnan 2014). In fact, the HSR should locate in city centers and complete air transport service rather than compete with it (González-Savignan 2004). This way, the HSR could be an effective alternative for air transport, especially in airports with capacity constraints where the demand cannot be properly addressed (Lijesen & Behrens 2016).
Some airlines, which network rely on a particular route, will survive the HSR competition. LCC will compete with HSR for leisure passengers, although they might choose to leave in less dense markets (Behrens & Pels 2010).
Airlines are also the most polluting mode of transportation. In order to reduce aviation emissions by over 20% in 2024, there had to be a total demand shift in short-haul passenger transportation of 60% to non-polluting modes (Sgouridis, Bonnefoy &Hansman 2010).
2.4-HYPERLOOP
Hyperloop consists of a low-pressure tube with capsules that are transported at both low and high speeds throughout the length of the tube (Musk 2013). The capsules are supported on a cushion of air, featuring pressurized air and aerodynamic lift. The capsules are accelerated via a magnetic linear accelerator affixed at various stations on the low-pressure tube with rotors contained in each capsule. Passengers may enter and exit Hyperloop at stations located either at the ends of the tube, or branches along the tube length (Musk 2013).
Virgin Hyperloop One, founded in 2014, is a privately held company out to create fast, effortless journeys that expand possibilities and eliminate the barriers of distance and time, catalyzed by Elon Musk’s white paper. It defines the Hyperloop as a new mode of transportation that moves freight and people quickly, safely, on-demand and direct from origin to destination. Virgin Hyperloop One systems will be built on columns or tunneled below ground to avoid dangerous grade crossings and wildlife. It will be fully autonomous and enclosed, eliminating pilot error and weather hazards. It will also be safe and clean, with no direct carbon emissions. The top speed is estimated to be at 1080 kilometers per hour (Virgin Hyperloop One website 2019).
DP World Cargospeed was created through a partnership between DP World and Virgin Hyperloop One, to provide hyperloop-enabled cargo systems to support the fast, sustainable and efficient delivery of palletized cargo. The first initiative of its kind in the world, DP World
18
Cargospeed will provide exceptional service for high-priority, on-demand goods, delivering freight at the speed of flight and closer to the cost of trucking. DP World Cargospeed systems, enabled by Virgin Hyperloop One technology, will transport high-priority, time-sensitive goods including fresh food, medical supplies, electronics, and more. It will expand freight transportation capacity by connecting with existing modes of road, rail and air transport (DP World website 2019). The current market for air freight, Hyperloops’ prospect market, accounts for just 2 percent of ton miles but represents 40 percent of freight value. Not having a fixed guideway facilitates air transport hub-and-spoke system, which requires massive investments for Hyperloop (USTD 2016).
Hyperloop Transportation Technologies is using a crowdsourcing model, in which 100 core technical researchers work part-time for equity in the company. They have announced plans to construct a five-mile, demonstration test track along Interstate I-5 in Quay Valley, California, a privately-owned planned community (USTD 2016).
Transpod is a Canadian start-up with plans to implement Mr. Musk’s hyperloop idea (USTD 2016).
The Hyperloop consists of several distinct components. Sealed capsules carrying 28 passengers each that travel along the interior of the tube depart, on average, every 2 minutes but has the capacity to departure every 30sec during rush hours. A larger system has also been sized that allows transport of 3 full size automobiles with passengers to travel in the capsule. The capsules are separated within the tube by approximately 37 km on average during operation and are supported via air bearings that operate using a compressed air reservoir and aerodynamic lift. The tube is made of steel. Two tubes will be welded together in a side-by-side configuration to allow the capsules to travel both directions. Pylons are placed every 30 m to support the tube. Solar arrays will cover the top of the tubes in order to provide power to the system. Linear accelerators are constructed along the length of the tube at various locations to accelerate the capsules. Rotors are located on the capsules to transfer momentum to the capsules via the linear accelerators (Musk 2013).
The Hyperloop transport system predicted characteristics are being on-demand and inexpensive as road transportation, fast as air transportation and environmentally friendly like rail or electric cars (Musk 2013).
19
Hyperloop is “the right solution for high-traffic city pairs that are less than 1500km apart” (Musk 2013), although it has been narrowed to distances between 320km and 800km (USTD 2016).
For a trip between San Francisco and Los Angeles of roughly 640 kilometers, the resulting time savings over air or maglev would be about 45 minutes, considering only the effective time in transit from departure to arrival. However, all three modes would likely have stations that locate at the outskirts of the major city and thus require additional time on local transit for travelers or freight to reach their destination. The time savings over HSR is more substantial at 2 hours, but HSR stations are generally found downtown which provides savings in access and egress time (USTD 2016). The Stockholm-Helsinki journey current travel time is estimated at 3.5hours by plane, including transport from and for the city from and for the airport and luggage and security screening, while ferry travel times last 17.5hours. Hyperloop takes 28 minutes to complete the 500km trip (KPMG Transport Tracker 2017).
The Hyperloop could facilitate offshore port facilities and relieve port constraints, where its main advantage would not be the speed itself, but the higher throughput for a given tube size (USTD 2016).
Many different cost estimates were carried since the Hyperloop Alpha White Paper, that estimated a cost of 17 million dollars per 1.6 kilometers (Musk 2013). Subsequent to the Alpha white paper, Virgin Hyperloop One gave a presentation citing 25 -27 million dollars per 1.6 kilometers for just the technology, excluding land acquisition. For an almost entirely underwater track specifically from Helsinki to Stockholm, Virgin Hyperloop One estimates a cost of 64 million dollars per 1.6 kilometers including vehicles (USTD 2016). For an approximate frame of reference, California HSR faces costs of 63-65 million dollars per 1.6 kilometers and in Europe the cost is 43 million dollars per 1.6 kilometers, although those figures include costs of land acquisition but exclude train sets. Thus, cost estimates for a land-based hyperloop system may appear lower than other modes (USDT 2016).
Amortizing the total cost of $6 billion of constructing the San Francisco-Los Angeles line over 20 years gives a ticket price of $20 for a one-way trip for the passenger version of Hyperloop (Musk 2013). With 15 million trips per year as the maximum capacity, that suggests $300 million per year in farebox revenue. Those calculations assume average 2 departures per minute over 24 hours. Very few people would want to travel in the middle of the night (USTD 2016), but in rush hours Hyperloop could leave every 30sec (Musk 2013). Fares would cover operating
20
costs (Musk 2013; USTD 2016). Bibop Gresta, Hyperloop Transportation Technologies’ COO, states explicitly that government subsidies will be required (USTD 2016).
The technology has not yet been fully tested, rather is being tested in smaller tracks. Whereas Hyperloop Transportation Technology has already developed certification guidelines for the new transportation technology (Hyperloop Transportation Technologies website 2019), Virgin Hyperloop One has successfully accelerated a pod in a short track, achieving speeds of 384km/h in a 500m test track (Virgin Hyperloop One website 2019). However, for competitive reasons, further deadlines or prediction of test-runs are not disclosed or communicated.
21
3. METHODOLOGY
In order to answer the research questions, primary and secondary data collection were collected and analyzed.
RQ1 was answered through the assessment of the important characteristics in the industry and comparison of each mode with Hyperloop on those dimensions. Each characteristic was ranked 1 to 5, 5 being “Hyperloop much better than current mode” and 1 being “current mode much better than Hyperloop”. Ranks were inferred after analysis of primary and secondary data collection, with expert insights weighting 70% and secondary sources weighting 30%, divided between consolidated academic review (20%) and other secondary sources (10%).
RQ2 was answered through analysis of past reactions of stakeholders to disruptions and historical competition between them, calibrated with insights from industry experts.
3.1. PRIMARY DATA COLLECTION
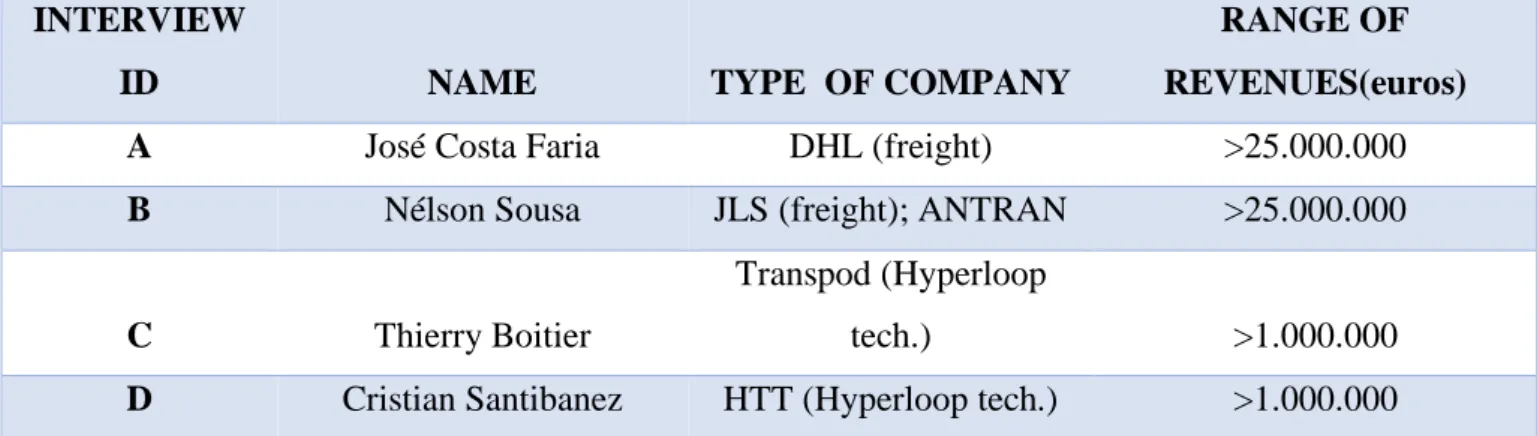
Primary data collection consists of four semi-structured expert interviews, two orientated for the freight side and two orientated to Hyperloop developing companies. The objective is complementing secondary research with insights from managers with experience and capabilities, to better understand the dynamics of the industry, the competition occurring between modes and the possible impact of Hyperloop over those industries.
José Costa Faria is an independent consultant with many years of experience in the logistics and transportation industry, including nine years at DHL where he worked as vice-president of Business Development in Southern Europe and Business Development Director Portugal. Nelson Sousa is administrator at JLS, a road transportation company, and is vice-president of ANTRAN, the national associate of public road freight transportation companies of Portugal since 2014.
Thierry Boitier is Director of Supply Chain at Transpod, a Canadian company developing Hyperloop. Thierry has over ten years of experience as supply chain manager and has worked across Europe, Africa, Asia and America.
Cristian Santibanez is a manager at Hyperloop Transportation Technologies currently working as Urban Mobility Lead and Marketing Operations. He has ten years of experience working on urban innovation and mobility industries.
22 INTERVIEW
ID NAME TYPE OF COMPANY
RANGE OF REVENUES(euros) A José Costa Faria DHL (freight) >25.000.000
B Nélson Sousa JLS (freight); ANTRAN >25.000.000
C Thierry Boitier
Transpod (Hyperloop
tech.) >1.000.000
D Cristian Santibanez HTT (Hyperloop tech.) >1.000.000
Table 1- Interviewees Identification
3.2. SECONDARY DATA COLLECTION
Secondary data collection consists of consolidated academic review and consolidated insights from other reputable sources. This data is summarized in chapter two, and further divided into four main sections corresponding to the challenges and trends in the European transportation industry, the long-range personal segment, the long-range freight segment and the Hyperloop technology. The objective of this chapter is providing information regarding to which are the competing modes in each segment, their characteristics, the relative importance of each characteristic in the industry, how those characteristics shape competition and market share in the industry and how the stakeholders behave when the market is disrupted by a new mode or other external factor.
23
4-ANALYSIS AND FINDINGS
In the following section, a brief resume and analysis of the literature review and the data collected will be presented. Based on those analysis, a conceptual framework will be developed to assess the overall impact of the Hyperloop technology in the long-range
personal and freight transportation industry, and its landscape once the disruption has become effective. As in previous chapters, the industry for personal transportation is analyzed
separately from the industry for freight transportation, after an overview of the industry and its challenges as a whole.
4.1-HYPERLOOP POTENTIAL ON THE LONG-RANGE PERSONAL AND FREIGHT TRANSPORTATION INDUSTRY
The European Union has clear-defined goals for its transportation industry, among which are the creation of a Single European Transport Area and a shift toward environmentally friendly modes. The road and air transportation, both on freight and personal segments, benefit from low restriction or fees on carbon emissions and are the most threatened by a shift to low-emission modes or the internalization of external costs such as noise or air pollution (Bickel et al., 2006). However, environmental concerns appear to be somewhat short to shift transportation to different modes (Interviews A and B).
A different problem also common to both passenger and freight segments is airport constraints, that have been rising as demand grows at a faster speed than capacity. On the passenger side, the problem is bigger and the EU estimates by 2035 there will be an annual unattended demand of 2 million flights (Eurostat 2019). 5 countries are responsible for over two thirds the European air traffic, indicating investment in airport capacity or alternative transportation modes are vital in these areas to avoid, or minimize, the unattended demand predicted by the EU for the upcoming years.
4.1.1-LONG-RANGE PERSONAL TRANSPORTATION
Air passenger transportation in Europe is concentrated in five countries that account for over two thirds of all air passenger traffic, including UK, Germany, Spain, France and Italy. International flights, including intra and extra-EU flights, represent the majority of these flights, around 47% and 36% respectively, and are responsible for airport congestion in Europe, which is predicted to increase and reach an annual unattended demand of 2 million flights by 2035 (Eurostat 2019). Airport constraints also cause airlines dependent on frequency of flights to
24
leave routes where profits cannot be maximized (Lijesen & Behrens 2016). Environmental concerns also hunt the industry, as there is an increasing will of public authorities to internalize the environmental costs of transportation (EU Current Trends and Issues 2018). Aviation emissions are the highest of all modes of transportation and the hardest to achieve further fuel emission efficiency. The air transportation main competitive advantage is the speed or reduced total travel time when compared to other transportation modes, like rail or road. Consequently, air passenger transportation becomes more competitive as the distance increases, proportionating lower total travel times. This is important for another reason that the ones already stated, as air transportation requires time consuming boarding protocols that occupy a considerable percentage of the total travel time when the travelling distance is short.
Air transportation can be subdivided into two different segments, FSA such as Fly Emirates and LCC like Ryanair. The market is equally divided between these two segments of air passenger transportation as LCC accounted for 48% of market share in 2015 (KPMG Transport Tracker 2017), that present different characteristics. FSA compete from airports usually located close to the city center, reducing total travel time. Comfort and service are other strategic advantage of FSA. LCC compete from airports located on the outskirts of major cities, like Stanstead located 100km from London. Service and passenger comfort are kept low to enhance operational efficiency and reduce costs, culminating in lower prices when compared to FSA. Competition between established airlines is weak, even when offering competing flights. Price changes from one airline does not trigger a response from its competitor (Van Den Dogaard & Lijesen 2019). This happens because competition in similar routes often occurs between FSA and LCC, that by presenting different characteristics attract different types of costumers. The situation is different when an operating airline faces threats of entry of a different airline in an operating route, which lead incumbent operators to reduce fares in the period before and during the beginning of operations in that route (Goolsbee & Syverson 2005). Responses may be stronger in this occasion to prevent the entry, making the incumbent a monopolist in that specific route.
Rail transportation services have kept a sustained growth over the past few years, but it’s almost exclusively used for national transportation. Its main disadvantages are its poor infrastructure, alongside its poor operational performance (Eurostat 2019, Interviews A and B). Differences in rail or trains specifications, lack of international corridors or poor international coordination are the HSR main competitive disadvantages. National transportation suffers from poor services,
25
as rail scored 4th higher incidence of problems in the European Union (Eurostat 2019). The HSR main competitive advantages are its lower fares, comfort, location at city centers, the possibility of using electronic devices for work or leisure, and a higher frequency over air transport. Its lower speed means the HSR competitive advantage situates at distances long enough to be preferable to road transport, but not long enough so that air transport becomes preferable. In the long-range personal transportation, the HSR is competitive to distances that can be covered in a maximum of three hours (González-Savignan 2004). Consequently, an increase in HSR maximum speed through technological evolution would enlarge the areas where the HSR would have the necessary competitiveness to start operating the route.
FSA respond stronger to the HSR than LCC as both present similar characteristics: location closer to the city center and better quality of service. An increase of seats offered by the HSR on a particular route can cause airlines to reduce offered number of seats even further, reducing total number of seats offered in a particular route in total (Lijesen & Behrens 2016). This problem is amplified for airlines dependent on high frequency of flights for market share, that often decide to leave the market. Hub-and-spoke networks are crucial for FSA facing HSR competition.
LCC compete from secondary airports and offer a poorer service, but a greater total travel time. Hence, they don’t react to the HSR threat as strong as FSA, but they can leave a route served by HSR when market density is low, as example of Ryanair in Porto-Lisbon route, citing alternative transportation companies, like HSR or FSA like TAP with strong hub-and-spoke networks in those areas, as the main reason (Expresso, “Ryanair encerra rota Porto-Lisboa”, 18-09-2019).
After summarizing and interpreting what each mode can offer to passengers, it’s paramount to understand what passengers are looking for in transportation and how those demands culminate in the choice of a specific mode of transport. The most valued characteristics for passengers are connectivity, access time, total travel time, fares, frequency, use of electronic devices and trip purposes, the latter divided between business and leisure passengers as these segments seek different transportation solutions. Road distance, frequency and fares are important for both segments, but unlike business passengers, leisure passengers give little importance to on-time arrival and total travel time. They are also more heterogeneous as a group, which leads to the assumption that leisure passengers can have very diverse preferences over the choice of transportation mode (Behrens & Pels 2010). Destination within the country and the use of
26
electronic devices also play a role in business passenger’s choice of transport mode (Behrens & Pels 2010).
Road distance, frequency, and fares are the common characteristics both segments are demanding, but each player offer a different combination of these. Road distance is the main competitive advantage of the FSA, as it combines the speed of air travelling and arrives at airports close to the city center. LCC, competing from distant airports, add distance from the airport to the city center as makes road distance increase, while offering lower fares than FSA. Road distance is also the main disadvantage of the HSR, compensated by a higher frequency of departures when compared both to LCC and FSA, and lower fares when compared to FSA. By not demanding a reduced total travel time, leisure passengers are more likely to choose HSR or LCC transportation, although it’s important to remember that, being a more heterogeneous group, leisure passengers have a wide range of value for each of the different transportation alternatives. Business passengers’ most important demand is a reduced total travel time, making them prefer the FSA over other transportation modes. However, the use of electronic devices and the destination within the country give the HSR a competitive advantage in this segment. On-time arrival is also an FSA and LCC disadvantage, as flights have larger probability of being delayed due to higher exposure to airport traffic constraints or weather variations. FSA are the right solution for business passengers, whereas LCC are the right solution for leisure passengers. Being the fares important to both types of passengers, dropping the fares may lead leisure passengers to FSA depending on the value each passenger places on fares and total travel time. The HSR is a viable solution for both types of passengers, in destinations that could be covered in a maximum of three hours (González-Savignan 2004). As distance increases, the competitiveness of HSR over air transportation decreases. HSR competition is also confined to areas where the infrastructures actually exist, limiting the routes where HSR is an alternative to air transportation. As air transportation demand increases and leads to airport congestion, the HSR is a viable alternative to complement air transport, especially in developed cities where passengers are more likely to switch from air to HSR transport (González-Savignan 2004).
4.1.2-LONG-RANGE FREIGHT TRANSPORTATION
Road transportation is popular in long-range and international freight transportation, as opposed to the personal transportation segment. Environmental concerns in this segment have been rising over time, with intermodal transportation being appointed as a viable alternative to
long-27
range road transportation in order to reduce gas emissions. The industry has, however, increased its fuel efficiency over time with margin to increase further, and developed various logistics solutions to tackle the problem (Interviews A and B). Public authorities often fail to communicate with the industry, and initiatives do not reach the execution phase or take considerable time to be approved. The road transportation competitive advantages are its flexibility, reliability, and a good cost-average delivery time trade-off, as this mode is neither the cheapest nor the fastest but offers a powerful combination of both characteristics.
Rail freight transportation has experienced a growth over the past few years, with most of its services being performed on international routes. Rail is one of the most popular modes of intermodal transport, and the one that could most contribute to the reduction of gas emissions as it is the most efficient mode of transport. However, the use of rail for intermodal transport is harmed by several structural problems (Eurostat 2019). The rail can only be used in routes where there are infrastructures, which lack investment, and often road is the only mode available in particular routes (Michel Savy 2009). Poor services performance also makes intermodal transport by rail inefficient while causing delays, and the inoperability while switching modes often make this option economically unviable (Interview B). International rail transport also requires international coordination, that is often not the case. Some countries, like Portugal and Spain, are isolated from the European rail network due to differences in rail infrastructures. This mode main competitive advantages are its capacity in volume of transportation and the price, although it needs to consolidate cargo to achieve economies of scale and travel big distances to disperse fixed costs and become more competitive.
Air freight transportation have also experienced a growth in the past years. Being the most polluting mode of transportation has little importance in this segment, as its market share measured in tonne-kilometers is almost insignificant. The air transportation main advantage is its speed or reduced total delivery time.
Maritime transportation is the only mode that has not experienced sustained growths in the past years. As the rail, maritime transportation needs to achieve economies of scale and disperse fixed costs to be competitive. The industry has achieved further efficiency with the creation of alliances or through M&A that allowed companies to reduce excess capacity. Port constraints and offshore operations overload are infrastructural problems the industry is yet to resolve. In addition, maritime transportation is highly subject to weather conditions, making it less reliable then the other modes. The maritime transportation main competitive advantages are the volume
28
capacity in transportation, the capacity to serve long intercontinental routes separated by sea where road or rail are not available, and the price despite the need to achieve economies of scale in cargo and serve long routes to reduce fixed costs (Michel Savy 2009).
Competition between modes is rather weak, and it occurs mainly within modes (Interviews A and B; Michel Savy 2009). As each mode of transportation presents different characteristics, there is little overlap on the realms where they compete. Air transport is the only one capable of delivering goods at intercontinental distances with speed, whereas road is the only mode combining a good price-delivery time trade-off, more reliable and more flexible. Rail and maritime transportation become cheaper than road over long distances, and therefore there is sometimes a competition between these modes. It’s important to stress that, in order to be competition between modes, shippers are waiving the possibility of flexibility and reliability, in order to seek a lower transportation cost. In Europe, the break-even distance between road and rail transportation happens at 240 km, where prices of rail become competitive enough to overshadow the flexibility and reliability offered by road transport. In conclusion, shippers using rail or maritime transport have bigger concerns about price, whereas shippers using road transport have more concerns about the delivery time (Mohamadian et. al 2011).
Shippers desired characteristics for freight transportation allows us to better understand the decision-making process when choosing a mode of transportation. The cost of the haulage, average delivery time, reliability, flexibility, safety, availability, accessibility and past experience with each mode all influence the decision-making process of shippers (Mohamadian et. al 2011). In addition, cost of inventory volume also plays a role, as a more frequent transportation allows for a lower inventory volume.
The type of cargo and the length of haulage also influence the choice of mode of transportation. Large consignments with low value over intercontinental distances usually travel by maritime shipping, whereas continental distances are serviced by rail or road. Over large intercontinental distances, high-value goods travel by plane, whereas road is the preference for continental distances. The highest the cost value of cargo more important the average delivery time and reliability, hence the more likely shippers are to choose air or road transportation over rail or maritime transportation. The lowest the cost value of cargo, more likely are rail and maritime transportation to be chosen. However, even when these conditions are met, rail and maritime transportation need to consolidate cargo to achieve price competitiveness over road, making it less flexible, and road transport is still more reliable then both these modes. In conclusion, these
29
modes need to meet several conditions to be preferred over road transportation, specifically large distances, large and low-value cargo with a cost time low enough to make delivery time a less important aspect then cost. Maritime is often the only choice available for large consignments over intercontinental distances, but rail on the other hand is not available for all routes where there would be demand for it.
Environmental concerns are not enough to shift more long-range freight transportation from road to intermodal transportation. Although environmental savings would be considerable, constraints imposed by intermodal inefficiency and absence of governmental action mean that shippers do not consider environmental costs when choosing a mode of transport (Interviews A and B).
4.1.3-HYPERLOOP TECHNOLOGY
Hyperloop is a “generic term for tube transportation” (Thierry Boitier, Transpod) currently being developed by several companies around the world. The technology is still being developed, and there are questions that are yet unanswered. Among them, safety and regulatory issues, technological concerns and business development are still under planning and execution. Therefore, several assumptions are made in this chapter to allow for comparison with existing modes and analysis, based on the foreseeable results expected to make the technology feasible. The assumptions are the follow:
• Hyperloop technology is possible to achieve, reaching the proposed speed of over 1000km per hour, making it the fastest mode of transportation;
• Hyperloop speed will not produce G-forces that will make journeys uncomfortable for passengers;
• Hyperloop is a safe technology, and it’s regarded as such by both legislators and passengers;
• The capacity for passengers is of 28 passengers per pod, whereas the capacity for freight is of three cars as first proposed by Elon Musk;
• Pods departure on average every 2 minutes, with possibility to departure every 30sec at rush hours;
• Cost is lower than that of air transportation, for both passengers and freight, as advocated by companies developing Hyperloop;
• Hyperloop does not stop at intermediate stations; • Stations will be located close to the city center;
30
• Procedures regarding security and luggage handling will be similar to those of rail; • Lines will be used for passenger and cargo, prioritizing the first and only using the latter
during low-peak hours to enhance operational efficiency.
Hyperloop is the fastest mode of transportation, capable of reaching 1000km per hour, with an average speed of over 900 km per hour (USTD 2016). Air transportation current average speed is around 400km per hour, and the California proposed HSR, which prompted Musk to write the white paper on Hyperloop, has an average speed of 263km per hour. Therefore, hyperloop presents substantial speed gains over current existing modes. It is estimated time savings of 48 minutes in the LA-SF route over air transportation accounting only for average speed (USTD 2016). In addition, security screening at airports add to the total travel time, which will not be necessary at Hyperloop stations (Interview C). Also, as these stations are located close to the city center, there is no need for longer commute from airport to the city center, as secondary airports are often located further away from city centers. Overall, Hyperloop technology offers a substantial reduction in the total travel time.
Frequency is another of Hyperloop’s competitive advantage. With possibility of departing every 30sec, and 2min on average, Hyperloop transportation is more frequent than any other long-range transportation system, making it virtually available at all times and with no need to plan transportation with advance, which makes Hyperloop more flexible than other modes. Cost is lower than existing modes and provide Hyperloop transportation an important competitive advantage over other modes (Interviews C and D). An air ticket from LA-SF costs between $68 and $200, whereas an Hyperloop ticket costs 20$. The proposed HSR for the same track is 86$ per passenger (USTD 2016).
Therefore, Hyperloop’s main competitive advantage when compared to existing modes of transportation are its flexibility, availability and affordability, only provided by road transportation, the speed that can only be compared to air transportation, and the fact that is a clean mode of transportation like rail (Musk 2013).
Hyperloop’s need for new infrastructure for every operating route is a competitive disadvantage, because tubes will only be placed in routes where there is demand for a high-speed transportation that justifies such an investment (USTD 2016). Transpod’s short-term approach is a construction of lines that “will bring passengers from point A to point B, hopefully with a few stations along the way. The long-term vision is a subway, but at a scale of a country”
31
(Thierry Boitier, Transpod). The maximum extension of a route is at 500km, whereas a route shorter than 300km wouldn’t allow for speed advantages (Interview C). Hence, the solution would be a starting line, comprehended in the interval of 300-500km, to which other lines would be added as the network develops (Interview C). By developing the network continuously, more connections and routes will be possible, and one extension of route would lead to a utility increase for all stakeholders while allowing a creation of an extensive network.
Therefore, Hyperloop seems to be a viable solution for responding to the UE’s challenges, since it is a clean transportation mode with no carbon emissions and no infrastructures in place yet, allowing the creation of a network using the same standards for technology and infrastructure and expanding the range of Hyperloop connections and utility.
Cargospeed focuses on delivering “high-priority, time-sensitive goods including fresh food, medical supplies, electronics, and more”, and Transpod also focuses cargo services on consignments with high ratio cost-weight like that of air. As road is the most transversal mode of transport, there is some cargo transported by road that could be transported by the Hyperloop, although it represents a small fraction of the cargo usually carried by road.
The cost of haulage is cheaper using Hyperloop over air transport, with the price being “closer to the cost of truck” (DPWorld Cargospeed website 2019). The average delivery time is also shorter using Hyperloop, as it achieves greater speeds. Hyperloop transportation, less subject to weather conditions, is also more reliable and safer than air transport. However, Hyperloop relies on a fixed guideway for transport, making it less flexible than air transport. Air cargo services rely on hub-and-spoke networks for decreasing costs and increasing flexibility, which is difficult to replicate with Hyperloop due to “enormous investments” (USTD 2016) to achieve the same geographical reach. Availability is dependent on demand on a specific route: “some lines will be only for passengers, some lines mainly for cargo, and for some it will be probably 50/50, passengers during rush hours and cargo during low peak hours” (Thierry Boitier, Transpod). DPWorld Cargospeed also mentions using the lines in a “mixed-use system that fully utilizes system capacity and maximizes economic and social benefits” (DPWorld Cargospeed website 2019). Therefore, the likely scenario is that tubes are used for both passenger and cargo pods, adjusting the departure of cargo pods to low activity hours.
32
4.1.4-WHAT IMPACT WILL HYPERLOOP HAVE ON THE LONG-RANGE PERSONAL AND FREIGHT TRANSPORTATION INDUSTRY?
4.1.4-1- IMPACT OF HYPERLOOP ON THE LONG-RANGE PERSONAL TRANSPORTATION INDUSTRY
FSA LR OSS IC ID
Overall Impact
Connectivity 4 3 4 3 3,55
Access time 3 3 N/A N/A 3
Total travel time 4 5 5 4 4,45
Fares 5 5 5 5 5
Frequency 5 5 5 N/A 5
Use of electronic devices 3 N/A N/A N/A 3
Overall impact 4
Table 2- Impact of Hyperloop on FSA
LCC LR OSS I3 I4
Overall impact
Connectivity 4 3 4 3 3,55
Access time 4 4 N/A N/A 4
Total travel time 5 5 5 5 5
Fares 4 4 4 5 4,35
Frequency 5 5 5 N/A 5
Use of electronic devices 3 N/A N/A N/A 3
Overall impact 4,15
33
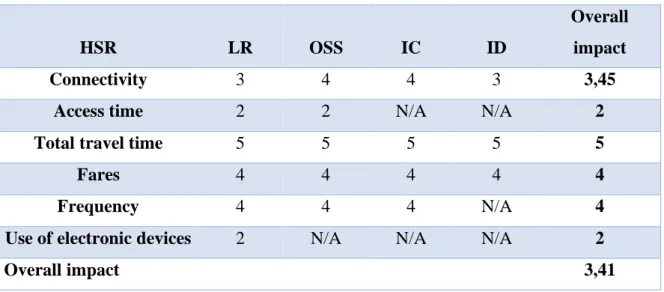
HSR LR OSS IC ID
Overall impact
Connectivity 3 4 4 3 3,45
Access time 2 2 N/A N/A 2
Total travel time 5 5 5 5 5
Fares 4 4 4 4 4
Frequency 4 4 4 N/A 4
Use of electronic devices 2 N/A N/A N/A 2
Overall impact 3,41
Table 4- Impact of Hyperloop on HSR
1-Current mode of transport is much better than Hyperloop 2-Current mode of transport is somewhat better than Hyperloop 3-Current mode of transport is similar to Hyperloop
4-Hyperloop is somewhat better than current mode of transport 5-Hyperloop is much better than current mode of transport
Hyperloops’ main competitive advantages regarding the HSR are the total travel time, fares and frequency. Its main disadvantages are access time and the use of electronic devices. The overall impact of Hyperloop over the HSR is medium (3,41/5).
LCC are the most impacted stakeholder. Hyperloop has competitive advantages regarding access time, total travel time, fares and frequency. The overall impact of Hyperloop over LCC is high (4,15/5).
The competitive advantages of Hyperloop over FSA are the total travel time, fares and frequency. The overall impact of Hyperloop over FSA is high (4/5).
Both leisure and business passengers, drawn by lower total travel times, lower fares and higher frequency will choose Hyperloop for transportation services.
34
4.1.4-2- IMPACT OF HYPERLOOP ON THE LONG-RANGE FREIGHT TRANSPORTATION INDUSTRY
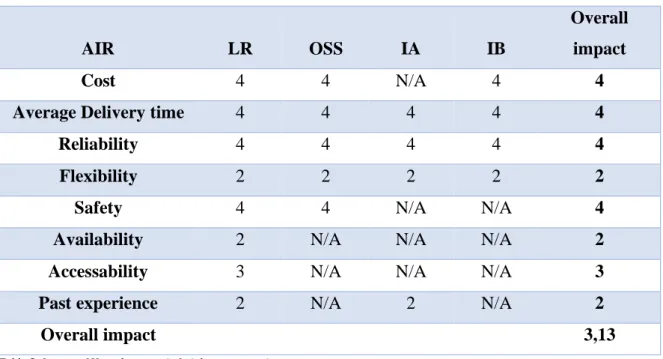
AIR LR OSS IA IB
Overall impact
Cost 4 4 N/A 4 4
Average Delivery time 4 4 4 4 4
Reliability 4 4 4 4 4
Flexibility 2 2 2 2 2
Safety 4 4 N/A N/A 4
Availability 2 N/A N/A N/A 2
Accessability 3 N/A N/A N/A 3
Past experience 2 N/A 2 N/A 2
Overall impact 3,13
Table 5- Impact of Hyperloop on air freight transportation
1-Current mode of transport is much better than Hyperloop 2-Current mode of transport is somewhat better than Hyperloop 3-Current mode of transport is similar to Hyperloop
4-Hyperloop is somewhat better than current mode of transport 5-Hyperloop is much better than current mode of transport
ROAD LR OSS IA IB
Overall impact
Cost 3 3 N/A 4 3,33
Average Delivery time 5 4 5 4 4,5
Reliability 4 3 3 2 3
Flexibility 1 1 1 1 1
Safety 3 N/A 3 N/A 3
Availability 1 N/A 1 2 1,33
Accessability 2 N/A 1 N/A 1,5
Past experience 1 N/A 1 N/A 1
Overall impact 2,33
35
Large and heavy consignments usually travel by rail or maritime shipping. These modes benefit from consolidation of cargo and economies of scale over large distances, and the cargo transported is usually low value. Hence, the gains of speed proposed by Hyperloop are not required and there will be no impact of Hyperloop on rail and maritime freight transportation. Hyperloop’s competitive advantages over air transportation are the cost, average delivery time, reliability and safety. Its competitive disadvantages are availability, flexibility and past experience. The overall impact of Hyperloop in air freight transport is medium (3,13/5). Road transport has competitive advantages in past experience, accessibility, availability and flexibility, whereas Hyperloop is faster. The overall impact of Hyperloop on road freight transportation is low (2,33/5).
4.2-SCENARIOS
4.2.1-STAKEHOLDER IDENTIFICATION AND CLASSIFICATION
The long-range passenger transportation industry is constituted by FSA, LCC and HSR that compete indirectly between themselves (Lijesen & Behrens 2016). Thus, these are the three stakeholders identified in the personal segment of long-range transportation.
FSA are companies competing through quality service, comfort and speed. LCC are airlines focused on low-cost price and speed.
The HSR offers a combination of comfort and quality service with competitive fares.
The freight transportation industry consists of the air, rail, road and maritime sectors (Marketline Global Transportation Industry Summary 2017). However, DP World Cargospeed and Transpod (Interview C) mention time-sensitive cargo as Hyperloop’s freight market, which is currently carried by air (Eurostat 2019, Savy M. 2009, Interview B) or road, depending on the distance of haulage (Interview B) and thus this are the two stakeholders identified in the freight segment.
Air transport usually carry high-value and time-sensitive cargo across long distances, offering fast delivery of goods.
Road transport is more transversal and carries medium and high-value cargo across short, medium and long continental distances. It offers a competitive price-delivery time trade-off.