0
Valuing CTT
A 495 year old company competing in the 21
st
Century Postal Market
Equity Valuation
CTT – Correios de Portugal, SA
Joana Assis Teixeira, 152113156
Advisor: José Carlos Tudela Martins
Dissertation submitted in partial fulfillment of requirements for the degree
of MSC in Business Administration at Catolica Lisbon School of Business
1 Abstract
The goal of a thesis in the field of Firm Valuation are, firstly, to draw valid assumptions applicable to previously studied methods that best fit the valuation of a chosen company in order to find an accurate price for its stock.
Upon making so, it is also expected a comparison between the results found and the ones published by a leading investment bank, also, of one’s choice. The differences as well as similarities between methodologies and values found shall be assessed, discussed and justified.
The company chosen for the latter purposes is CTT, a 495 year old company facing the new landscape of the postal market: as traditional mail becomes obsolete, Express and Parcels as well as Financial Services are boosting industry’s revenues.
An analysis to past performance seems to have prepared CTT for “a change in the game”, for the company continues to yield strong EBITDA margins motivated by the cost control efficiency aligned with network optimization. The proposed price target is 10.67€ which intentions to reflect the (i) electronic substitution effect, (ii) the Portuguese economic evolution and (iii) CTT’s own internal initiatives which aim to take advantage of the latter two.
Moreover it is worth referring the free-float of 100%, which guarantees high levels of liquidity in the stock market, enabling share price to growth even further.
2 Acknowledgements
I could not finish this dissertation without expressing my profound gratitude to:
Professor José Tudela Martins for his guidance, constant availability and expertise conveyed.
My parents, for more reasons that can be put in words, but mostly for giving me the opportunity to invest in my future, and for always pushing me to be more and better. Miguel Mello, for his unconditional support, and for always remembering me of my worth as student and as person.
Raquel Ferreira, from investor relations department of CTT, from all her help and advices.
Nuno Estácio, from BESI Investment Bank, for the guidelines provided and for helping me to better understand the drivers of CTT.
Finally I thank my friends, especially Mariana and Sara for all their support and concern.
I wish to dedicate this work to my grandmother Isabel, for all her love and for always believing and making me believe in myself.
3
Table of Contents
Executive Summary ... 3
CHAPTER I – Literature Review ... 6
I - DCF Valuation ... 6
Equity Valuation ... 7
Firm Valuation ... 7
Further issues regarding DCF valuation: Cost of Capital ... 9
APV Valuation ... 15
WACC vs APV ... 18
II - Relative Valuation ... 19
III - Contingent Claim Valuation ... 21
Final remarks ... 21
CHAPTER II – Company Presentation: CTT and its Latest Accomplishments ... 22
I. Introduction ... 22
II. Market Performance ... 23
III. Operational Performance ... 24
IV. Future goals and strategic lines... 26
Chapter III – Industry and Business Overview: Understanding the Value Drivers of CTT ... 28
V – Industry ... 28
Mail market in Portugal... 31
E-substitution effect ... 32
E-substitution effect in Portugal ... 32
VI - Business Units ... 34
Mail and Business Solutions ... 34
Express and Parcels ... 34
4
CHAPTER IV – Valuation: Finding CTT’s value according to its Market reality and
Business Drivers. ... 39
Overall Assumptions ... 39
Revenues ... 40
Mail & Business Solutions ... 40
Express & Parcels (E&P) ... 42
Financial Services (FS) ... 44
Operating Costs ... 46
Net Working Capital ... 48
Capex and Depreciation ... 48
Debt and Interest ... 49
Cost of Capital ... 51
DCF Valuation ... 51
Relative Valuation – Multiples, ... 53
Sensitivity Analysis ... 54
Comparison with Caixa B.I. Analyst Report ... 55
Final remarks ... 57
5
Building a dissertation on the topic of Equity Valuation implies the valuation of a public company of one’s choice. The goals of this thesis are, firstly, to draw valid assumptions applicable to previously studied methods that best fit the valuation of the chosen company in order to find an accurate price for its stock.
Upon making so, it is also expected a comparison between the results found and the ones published by a leading investment bank, also, of one’s choice. The differences as well as similarities between methodologies and values found shall be access, discussed and justified. Stemming from the above mentioned purposes of this dissertation, the structure for this work will be organized as follows:
Chapter I contains a revision of the literature of the matter of company valuation; Chapter II is the introduction of the company and assessment to the most relevant and recent developments; Chapter III consists in a thorough analysis to the industry and company’s key drives to be reflected on Chapter IV, the valuation of CTT.
6
CHAPTER I – Literature Review
According to Fernandez (2007), valuation has many purposes and can be used in different situations: in company buying and selling operations where there is a price to be negotiated; when valuing listed companies to understand whether its shares should be bought, sold or kept; during public offerings and the need of setting an offering price arises;
Valuation is also fundamental for strategic decision making and strategic planning for valuing a business is an important step towards deciding the future of a company (Is there a business unit that should be abandoned? Should the company merge? Is the current business sustainable?, etc.)
Following Damodaran (2002) there are three main approaches to valuation: DCF valuation, Relative Valuation, and Contingent Claim Valuations.
I - DCF Valuation
“In DCF valuation we try to estimate the intrinsic value of an asset based upon its fundamentals”. The intrinsic value is perceived as being the value calculated by an “all knowing analyst” who fully understood what the future cash flows of a company would be, which he then would discount at an appropriate rate that would reflect the riskiness of such company, [Damodaran (2002)].
As such the baseline for the DCF model is:
(1)
Where represents the future cash flows of the company and the discount rate that matches the risk borne the company represents.
Since the value for CF will vary in terms of assets (it could be dividends, coupons, after-tax cash flow, etc) Damodaran derives three approaches within this method: Equity Valuation, Firm Valuation and Adjusted Present Value, hereinafter APV.
7 Equity Valuation
In Equity Valuation the value obtained corresponds only to the value of Equity, excluding other claimholders, such as debtholders. To obtain the value for Equity the seen in formula (1) will be substituted by the Free Cash Flow to Equity (FCFE), and will be , entitled cost of equity:
(2)
Where corresponds to the cash flow available to common stockholders, meaning
the remaining cash flow after the firm fulfills its obligations regarding debt repayment, and investment, that is Capital Expenditures and Working Capital. Its formula is the following:
(3)
Firm Valuation
According to Modigliani and Miller (M&M)’s work (1958) the Value of a Firm is given by:
(4)
In Firm Valuation the final value concerns the value of the entire company (V), which means that both the value for Equity (E) plus the other claimholders (D) are considered in this analysis. To obtain the value of a Firm the seen in formula (1) will be substituted by the Free Cash Flow to the Firm (FCFF), and r will be WACC, entitled Weighted Average Cost of Capital:
(5)
Where is the cash flow that results from without considering financing expenses such as interest or dividends:
8
(6)
And the weighted average cost of capital is given by:
1 (7),
Where corresponds to the market value of Debt, corresponds to the market value of Equity, is the cost of Debt, and is the cost of Equity.
(i) Further issues regarding the FCFF: Terminal Value
The Terminal Value
To estimate cash flows forever it would be nearly impossible. According to Damodaran (2002) some closure regarding cash flows valuation is imposed and after some time1 it should be computed the Terminal value that properly reflects the value of the firm at that point in time.
As such the firm’s value would be given by:
(8)
The terminal value or residual value is equivalent to say that we are valuing the company as perpetuity:
(9)
Where corresponds to perpetual rate the company is expected to grow at once it has approached a phase of stable growth, based on a going concern assumption.
Fernandez and Bilan (2015) adverts the reader to the fact that should not be applied if Depreciation & Amortization expenses exceed CAPEX expenses for this would imply that Non-Financial Assets would be negative in the near future.
1
9
Supporting this reasoning, Kaplan and Ruback (1995) add that, in perpetuity, the referred expenses should be equal.
Concerning the value of , it is important to mention that: a geometric average is better than the arithmetic average to assess future growth [Fernandez and Bilan, (2015)]; if the economy where a company operates is expecting a growth rate of 1%, should not greater than 1% (Damodaran, 2008).
Further issues regarding DCF valuation: Cost of Capital
The cost of equity, the cost of debt, the weighted average cost of capital which balances the latter two, are frequently computed through the Capital Asset Pricing Model (CAPM), an equilibrium model that allows the estimation of the expected return of a stock based on the expected return of the market. The model is attributable to Jack Treynor (1961/62) William Sharpe (1964), John Lintner (1965), Jan Mossin (1966) built up on the work of Harry Markowitz (1952/59) regarding the modern portfolio theory. The following formulas represent the levered cost of equity and the unlevered cost of equity, respectively2:
(10)
(11),
Where represents the risk free rate, and the levered and unlevered beta, respectively, and the expression corresponds to the market risk premium. In the case of Debt=0, it can be said that ; this however may not be valid in a situation of a company possessing a high value on excess cash, for which the reality would be .
2
“The levered beta reflects the operational and financial risk borne by company whereas the unlevered beta only comprises the operational risk. The level of financial risk is given by the debt-to-equity ratio.” [Gomes Mota et al (2012)].
10
“The cost of debt is the rate at which you can borrow at currently; it will reflect not only your default risk but also the level of interest rates in the market.” [Damodaran (2002)]. The yield to maturity for the company’s long term debt is frequently used as a proxy for this cost. Its components are the risk-free rate which will be discussed further on, the default spread which can be determined by company’s bond rating and amount of physical collateral and the marginal tax rate, which should match the marginal tax rate used to forecast net operating profit less adjusted taxes (NOPLAT). [Goehdart et al, (2005)].
Because we assume CTT are 100% equity financed, this topic will not be assessed in more detail. It is important to refer, though, that either discount rate (re or rd) should never be lower than the risk free rate. [Fernandez and Bilan (2015)].
(ii) Beta
The beta represents the stock’s sensitivity to the market. Put in other words, “Beta represents a stock’s incremental risk to a diversified investor, where risk is defined as the extent to which the stock covaries with the aggregate stock market.” [Goehdart et al (2005)].
The estimative of the betas is yet subject to some controversy. The most common approach is to regress the stock’s return against the market return, the empirical estimation of the beta:
, (12),
Where represents the company’s equity raw beta, Rc are the returns of the company’s stock and RM corresponds to the market returns. The measurement period for raw regressions should include at least 60 observations which is equivalent to say that we should use data of monthly returns of at least 5 years. Using daily or weekly returns can produce biased results. Moreover the market portfolio to be considered to regress the stock returns against should be a value-weighted and well-diversified market portfolio. Finally data shall be chosen carefully not to include market bubble/depression.
11
To estimate a company’s beta, one should use an industry-derived unlevered beta relevered to the company’s target capital structure. [Goehdart et al (2005)].
Leveraging and de-leveraging the Equity beta
According to Fernandez work from 20083 from the six different approaches to leverage and deleverage the beta only two are correct. The author tests the different hypothesis and reaches two main conclusions:
If the company maintains a book-value leverage ratio, the correct relationship between the levered beta and the unlevered beta is given by Fernandez (2007) 4:
(13)
In case we are referring to a company which maintains a fixed market-value leverage ratio, the correct relationship corresponds to the one developed by Miles and Ezzell (1980)5:
(14)
Thirdly, if we are dealing with a company with a preset D/E ratio for every period, the correct relationship between βe and βu is derived from Modigliani and Miller’s work (1963):
(15), where VTS, Value of Tax Shields equals the present value of the future tax shields discounted at the cost of debt
Debt beta
Assuming Debt is riskless, the = 0, If the debt is risk-free, D = 0.0 because the
covariance of a risk-free asset with anything is zero. Even if the debt is risky, its covariance with the market (and thus its debt beta) will be very low.
3
“Levered and Unlevered Beta”, October 2008.
4
“A More Realistic Valuation: APV and WACC with constant book leverage ratio”, Journal of Applied Finance, Fall/Winter, Vol.17 No 2, pp. 13-20.
8
“Weighted Average Cost of Capital, Perfect Capital Markets and Project Life: A Clarification”, Journal of Financial and Quantitative Analysis (September), pp. 719– 730
9
12 (iii) The risk free rate
Damodaran (2008) introduces the meaning of risk, indicating that for an investment to be risk free then the actual return of an asset or security should match the its expected return. Put in other words, the return of a risk free rate investment should be uncorrelated with the return of a risky investment in a market.
Fernandez states that the risk free rate is by definition the rate that can be obtained at the time the cost of equity is computed. One should use either the IRR or the yield of long-term government bonds, not short-long-term, and it should match the period of the cash flow estimation. The currency should be the same of the cash flows since it can vary due to inflation being different over country.
In terms of the best approach to use, Damodaran (2002) and Goedhart et al. (2005) both postulate that the appropriate risk-free rate should correspond to the yield of a 10 year government bond.
(iv) The market risk premium
Theoretically, the market risk premium6 (MRP) corresponds to the compensation differential between an investment of a risk-free asset, such as government debt (treasury bonds, for example) and a riskier investment such as stocks, real estate, or any other asset.
The estimation of this valuation input is broadly discussed throughout the literature for which no consensus has been found, which is mainly due to the subjective character of the MRP, as it integrates expectations regarding future stock market returns. [Duarte and Rosa (2015)].
According to Damodaran (2013r) there are three broad approaches to estimate the equity risk premium:
13 Surveys
Surveys constitute a benchmarking built on the opinion of practioners, academics and other qualified people in the field of corporate finance.
Pablo Fernandez (IESE Business School) conducts a yearly survey, inquiring about practioners, academics and companies on the used MRP. Works from 2008 and 2009 point a median MRP of 5% across Europe based on 228 and 194 answers, respectively. More recent surveys (2012, 2013 and 2014) allow detailed understanding of the MRP per country. For Portugal the average and median MRP corresponds to 7.2% and 6.5% for 2012, 6.1% and 5.9% for 2013 and 8.5% and 8.5% were the findings on the work of 2014, in which circa 88 countries were assessed.
Similarly, a survey from 2007 elaborated by UCLA Professor Ivo Welch7, provided some insightful estimates on the long-term market risk premium (5% on a geometric basis and 5.8% on an arithmetic basis).
JP Morgan Publication8 stresses some pros and cons on this methodology, the first being significant research time, unbiased academic estimates, and its underlying stationary character. Cons, on the other hand, are associated with the wide diversion of opinions and the lack of updating in terms of new market realities, as it is the case of tax changes.
Historical Returns
According to the CFA Institute (2010), using historical data, the market risk premium equals to the return on a broad-based equity market index minus the return on government debt.
For this approach, “broad-based, market-value-weighted indices are typically used” and its appeal lies within the long time spans of data used, which ideally would represent unbiased results. When engaging in this methodology some issues have to be addressed:
7
“The Consensus Estimate for the Equity Premium by Academic Financial Economists in December 2007”. January , 2008.
8
The Most Important Number in Finance The Quest for the Market Risk Premium, JP Morgan 2008
14
As we extend the length of the sample (in historical terms) results tend to be more precise and yet revealing of the stationary character of this type of data. Geometric means perform better than arithmetic ones on expressing the future
and present value of an investment.
The occurrence of extraordinary events, as they will not be representative of the future market performance.
Using this methodology, Dimson et al (2011) show evidence from the period between 1900 and 2011, on the long-term realized market risk premium in 19 different countries. For the 19-country World index, the results laid on a geometric mean real returns of 5.5% (annualized).
Damodaran (2013r) however shows that the choice of an equity risk premium should not be equal to the historical risk premium due to its low predictive power, as Fernandez shows how the use of an historical market premium can lead to under/overvaluation.
Implied Premiums
By estimating implied premiums, which result from an attempt to forecast a forward looking premium, based market rates, prices on traded assets, etc. [Damodaran (2013r)]. The later approach derives from the Gordon’s Model9 is applied as follows:
(16),
In which the dividend yield is given by the expression , the forecasted long term earnings equals , and as for the government bond yield, we are referring to the considered risk-free rate, .
9
The Dividend Discount Model (DDM) by Gordon and Shapiro (1956) equated the price of a stock as the present value of its future dividends, assuming these would grow at a constant rate:
15
Regarding this methodology, Campbell and Shiller (1988) point dividend yield as a simplistic, yet powerful measure of the implied equity risk premium and a study from Damodaran (2013r) using data from 1960 to 2011, finds that implied risk premiums yields a considerably better forecast of the actual market premium, in comparison with historical risk premiums (the second methodology).
Consistently with these, a recent study from Barclays (2013)10 considers both dividends and earnings growth plausible drives of equity returns. The study points a range of implied risk premiums between 5.5% and 6%, for the U.S, given that these values can be slightly higher for Europe (an extra 100-150bp), given that valuations are less challenging and payout ratios seem to be higher.
The wide range of methods implies the inexistence of a consensus regarding a fit-all
approach.
Still on the topic of the MRP it is important to refer an additional item, the country risk premium (CRP). On this topic, Fernandez states that the country has to be considered since “even when speaking of a monopoly granted by the government, no government can eliminate its own risk.” [Fernandez (2007)].
APV Valuation
M&M’s proposition I (1958) postulates that capital structure is irrelevant for firm value11, for in a world without taxes and assuming perfect market conditions, the value of a firm unlevered would be akin to the levered firm.
Since such a world is far from real, the optimal capital structure represents an opportunity cost: For instance, the trade-off theory claims that capital structure decisions are derived from weighting benefits of debt, which include tax shields savings, as interest on debt is tax deductible, plus reduced agency problems, versus the costs of financial distress, which are motivated by extensive use of debt12. [Graham and Leary, (2011)].
10
Equity Gilt Study, 2013.
11 (18) 12
Pros and cons of debt are extensively studied in literature; Aside from the tax benefits, debt can have a disciplinary role by helping aligning the interests of shareholders with managers. Jensen (1986) finds a positive relationship between debt and organizational efficiency. On the other hand debt can cause stakeholders to underestimate a company’s reputation [Maksimovic
16
Hence, for APV valuation, this method will divide the company in two parts, firstly analyzing its value as an unleveraged company, which means that a no debt scenario is considered. The second step consists in valuing the tax benefits (or tax shields) arising from the debt the company actually has [M&M’s proposition II, (1958)].
Overall we are adding the value that being indebted brings to the company, which includes measuring the tax benefits the company is obtaining against the expected bankruptcy costs the company may incur in by being leveraged.
(19)
(i) The Present Value of Tax Shields
The exercise of valuing tax shields has been subject of discussion and the main source of controversy regarding the APV model.
For instance, tax benefits are difficult to assess with accuracy and much more so when corporate taxes do not depend only on profit. The “Non-Debt-Tax-Shields” which derive from expenses with depreciation and amortization, for example, are tax deductible thus decreasing taxable income and consequently reducing the value of the tax benefits. [Sabal (2007)].
The most common formula for valuating tax shields is given by:
, (20)
To obtain the present value of the tax shields one must use an appropriate discount rate; According to Modigliani and Miller (1963) the tax shields will be discounted at the cost of debt, rd. As explained by Sabal (2007) this occurs because the tax shields are directly associated with the systematic risk of debt.
Fernandez (2008) however, argues that the Value of Tax Shields (VTS) is not actually the present value of tax savings due to the payment of interest discounted at a certain rate (cost of debt) but the difference between two presents values (PV):
and Titman (1991)], and if often associated with unfair employee treatment [Bae et al. (2010), Verwijmeren and Derwall (2009), Agrawal and Matsa (2013), Hanka (1998)].
17
(21)
(ii) The Present Value of Bankruptcy Costs
The valuation of the bankruptcy costs is pointed as one of the main limitations of the APV model; they comprise “both ex post bankruptcy costs incurred after a firm's bankruptcy filing, such as transactions costs, and ex ante bankruptcy costs incurred before the filing, such as those resulting from creditors' attempts to reduce their losses if bankruptcy occurs and/or managers' attempts to raise the expected return to equity by increasing the firm's risk.” [White (1983)].
For many companies ex ante bankruptcy costs are associated loss in value resulting from cutbacks in promising investments. [Almeida, (2008)].
In terms of value, ex post or direct bankruptcy costs are estimated to be between 3% and 5% of firm value at the moment of distress. [Jerold Warner, (1977), Lawrence Weiss, (1990].
The issue then resides in the fact that ex ante (or indirect) bankruptcy costs are not directly observable. Neverthless Kalaba (1984) argues that, if ex ante costs are large enough, securities prices will be affected thus enabling an assessment to its value. Shapiro and Titman (1985) postulate that these costs may represent about 30% of the firm’s value at the moment of distress, but no evidence is provided making the calculation dubious.
The most frequent method to predict indirect bankruptcy costs is derived by Damodaran (2002):
(22)
The work of Altman and Karlin (2008) is frequently used for measuring the probability of default: the authors derived the correspondence between corporate bond rating with the respective probability of default.
18 WACC vs APV
Sabal (2007) defends that the M&M’s work introduced two alternative methodologies being WACC (or FCFF) and APV. This has been, in fact, a source of discussion among academics and practioners.
Sabal (2007) argues that whenever a target ratio is defined for the long term by a company, is it preferable to use the WACC, notwithstanding the advantages enabled by APV: the convenience for studying smaller companies with unstable debt ratios as well companies inserted in countries that have complex legislation concerning taxation. The author further points APV as a better solution for valuing companies inserted in emerging countries, since the economy here is uncertain and offers a positive scenario when it comes to the use of leverage.
Despite the differences that may arise between the two methods, Sabal (2007) still defends that if WACC is adjusted every period in order to reflect the (eventual) change in the capital structure and the effect it has in terms of corporate taxes, the results yield by the two methods will be similar.
Luehrman (1997) on the other hand defends APV’s greater adequacy by calling it “transparent”, while defending that WACC addresses to tax effects only, thus working better when simple capital structures apply. The author points out that the discount rate associated to the APV method reflects only time value and its riskiness and other components derived from financial maneuvers (risk management, subsidies, and tax savings for instance) cannot be hidden among the adjustments made to that discount rate. While still recognizing some limitations, such as the disregard of costs of financial distress on behalf of some analysts, and the fact that income from stocks may suffer different taxation in relation to bonds, Luerhman (1997) still believes APV as being “a better tool for valuing operations”.
Fernandez (2008) supports the equivalency of the methods, based on the assumption that both analyze the “same realities under the same hypothesis”, and differences can be found only in terms of the present value of tax shields computation.
Ultimately both methods have pros and cons; WACC has the advantage of being an easier and simpler approach when the assumption of a constant capital structure is valid but if D (Debt is constant) then APV should be applied. [Fabrice Bienfait]
19
In terms of cons, the WACC is considered by Jenter (2003) as little flexible, and in cases where Debt is risky and contains other effects of financing (or different types of debt such as hybrid securities”, APV is a better option. Further the professor adds that when errors are made regarding the effect of a company’s liabilities, the entire valuation can be jeopardized, since WACC mixes up the effects of assets versus liabilities.
II - Relative Valuation
“Relative Valuation estimates the value of an asset by looking at the pricing of comparable assets relative to a common variable such as earnings, cash flows, book values or sales”, [Damodaran (2002)].
Goedhart et al. (2005a) infers on the importance of multiples to overcome obstacles in the level of accuracy of a valuation of a company. Multiples will be more effective in the comparison with competitors on indicators of performance, and additionally, their analysis allows the company to identify whether is positioned to create more value than the remaining players of that industry. On the other hand, multiples are sometimes times badly used by analysts, leading to wrong conclusions.
There are different multiples, which can be grouped in two types: Enterprise Value (EV) Multiples and Equity Value Multiples.
Their difference can be explained in terms of their components: regarding EV Multiples which relates to the firm’s total value (Equity and Debt) i.e., concerning all stakeholders, whereas in the case of Equity Value Multiples their value is relevant to equity holders only. Hence, the denominator in this first case is meant to be computed before interest expense on Debt, preferred dividends and minority expenses, which is equivalent to say that this denominator will be a proxy for the free cash flow to the firm. For the case of Equity Value multiples, the opposite applies and the denominator must incorporate the referred expenses.
20
Table 1 – Enterprise and Equity Value Multiples
Enterprise Value Multiples Equity Value Multiples
EV/EBITDA P/EPS
EV/EBIT E/BV
EV/Sales PER
PEG
EV/EBITDA and EV/EBIT are two of the most commonly used metrics, since EBIT and EBITDA are considered good proxies for FCFF. One of the advantages on using these indicators is that they enable a comparison between firms with different capital structures. EBIT may be more complete since it considers charges as depreciation and amortization, which are however non-cash expenses.
Regarding EV/EBITDA it is important to mention the need of adjustment for non-operating items as not doing so may mislead results. [Goehdart et al (2005)]. EV/Sales have the advantage of being very quick to compute; on the other hand sales may not be representative of the firm’s value for large sales do not necessarily mean large profits.
From the Equity Value Multiples side we stress PER and PEG, the latter being an adjustment of the first.
PER translates in Price to Earnings Ratio, which can be expressed as: (23)
PER is linked to Gordon’s Model since Price (Equity Value/Shares Outstanding) can be written in terms of the Net Present Value (NPV) of a company’s future dividends (see formula x above). Consequently one can say that the PER is a function of (i) the expected payout ratio (future Dividend per share, DPS), (ii) the cost of equity , and (iii) the perpetual growth on the DPS, g.
In the case EPS are negative, taking into consideration both the GDP growth and the inflation rate, the PEG ratio can be computed:
21
The appeal of the relative valuations lies within the easiness of application plus the fact that no assumptions are required on the analyst’s behalf.
However, by being based on the company’s Income Statement one of the drawbacks of this analysis is related with eventual manipulations companies can make. For instance, multiples related with earnings are subject to the values reported on depreciations, provisions, among others.
Furthermore, as the inputs for multiples valuation, such as the price for a stock, are retrieved from a public capital market, the valuation may suffer in terms of accuracy, since the market itself can be wrong.
III - Contingent Claim Valuation
“Contingent Claim Valuation uses option pricing models to measure the value of assets that share option characteristics”, [Damodaran (2002)]. Due to the complex character of this type of valuation plus the fact that CTT is not valuated based on option theory, this type of valuation will not be further discussed.
Final remarks
After analyzing different methodologies that aim to provide a realistic value for a company, it is important to infer on their equivalences, for conclusion purposes.
As put by Holt et al. (1999) “the more approaches there are, the weaker the message”. The authors mean to advice the reader on how to react when facing the so called “valuation overload”. Firstly it is important to bear in mind that “every popular valuation approach is simply a different way of expressing the same underlying model”.
This means that if the mathematics and assumptions are akin between models then we should be able to express one in terms of the other. This can be perceived as an advantage, since it gives the analyst an opportunity to present different (yet similar) perspectives of the same company, as long as they share the same levels of consistency, comparison, uniqueness and consistency without uniformity.
22
CHAPTER II – Company Presentation: CTT and its Latest
Accomplishments
I. Introduction
CTT – Correios de Portugal is a 495 year old publicly listed company operating in the Portuguese logistic sector.
CTT holds for the concession Universal Service Obligation13 (USO) until 2020 in Portugal, which contributes to a number one position the in postal sector, with a market share of 95% (Source: ANACOM).
Table 2 – USO,
Source: CTT’s Offering Memorandum.
USO Other Postal Services
Correspondences up to 2kg Express Mail Services Catalogues, Books, Newspapers and Other
periodicals up to 2kg
Catalogues, Books, Newspapers and Other periodicals above 2kg
Postal Parcels up to 10kg Postal Parcels up to 10kg Postal Parcels received from other EU
member states, up to 20kg
Direct Mail (for Advertising, Marketing and Publicity purposes
Services for registered items and insured items
CTT is the principal operator of the postal network, which includes the postal distribution network and the retail network. The first concerns simultaneously the distribution of mail and other USO products which CTT operates directly, plus both the Portuguese and Spanish express and parcels networks operated via outsourcing and a franchise model respectively. The retail network allows CTT to serve retail and small corporate consumers (in terms of mail and parcels distribution) as well as financial services.
13
23
It is important to clarify the following distinction: Postal Market refers to both Mail and E&P industry, whereas Mail market refers only to mail distribution, covering addressed mail and USO parcels.
Table 3 – CTT’s business unit organization (2015) Source: CTT data.
Mail Business Solutions Express & Parcels
(E&P) Financial Services
Transactional Mail; Press Mail; Advertising Mail; USO Parcels International Mail Documental Production (Mailtec Communication, market leader) Information Technology (Mailtec Consultancy) Portugal – CTT Expresso Spain – Subsidiary Tourline Express (Franchise Model) Mozambique – CORRE Correios de Moçambique (Joint Venture) Savings; Insurance; Payment Solutions; Money Transfers
II. Market Performance
Figure 1– CTT Stock performance versus PSI 20 Index (2014-2015);
Source: Bloomberg, retrieved May the 22nd , 2015. Red line corresponds to CTT, and grey line to the PSI 20 Index.
CTT is the first Portuguese publicly traded company with 100% free float which translates into high liquidity stocks, thus allowing its price to grow from the IPO offering price range 4.10€ to 5.52€, to 9.92€ which corresponds to the stock price on the
29th of May, 2015. Since November 2014 CTT market performance has been superior to
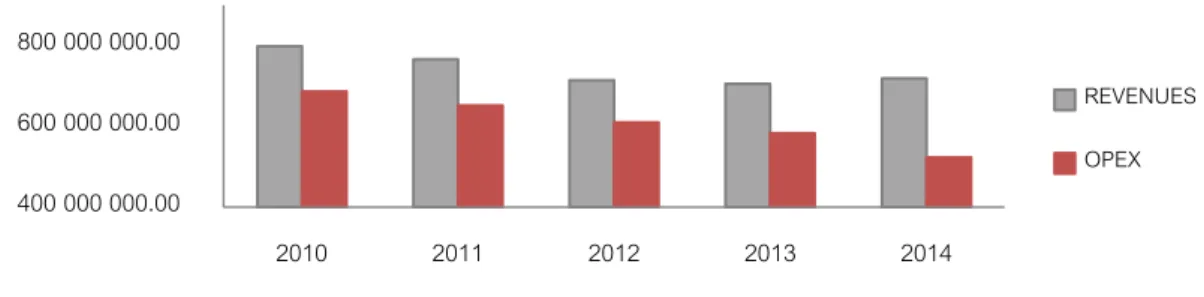
24 400 000 000.00 600 000 000.00 800 000 000.00 2010 2011 2012 2013 2014 REVENUES OPEX
III. Operational Performance
P&L efficiency
In 2014 CTT was able to invert a 5-year-old trend of decreasing revenues, obtaining a 718 million euro value in total revenues. This can be explained by the growth in Financial Services (+23% in 2014) which now account for a bigger percentage in the company’s total revenues, as well as a 2 million euro growth in Mail, which was accomplished by a price increase policy to offset mail volume decline.
Operating Costs (Opex) decreased by 10% in 2014, mostly due to the Transformation Programme, and the revision of the healthcare plan, which offset both the incentives to performance given to employees and the increase in remunerations.14
Figure 2 - Revenues versus Opex Evolution, 2010-2014; Source: CTT data.
In terms of EBITDA CTT maintains strong margins: 19% in 2014 and 17% in 2013. As for Mail, EBITDA grew by 11.6% due to the aggregate effect of price increase policy, slowdown of mail volume decrease, improving of the cost mix and cost optimization. Regarding E&P, EBITDA margin suffered a small (-1.2%) decrease caused by the reduction of the average price mix (B2C grew but is has a lower price), and operating costs increase.
EBITDA margins are the strongest in Financial Services (50.6% in 2014 and 45%) since the costs it has are supported by Mail business unit, representing the economies of scale CTT gets from its large network.
14
As a private company, CTT does no longer have to comply with government imposed restrictions.
25 77% 3% 20% EBITDA 2014 72% 6% 22% EBITDA 2013
Figure 3 – EBITDA contribution by sector, 2013 versus 2014; Source: CTT data.
Transformation Programme
CTT has implemented a transformation programme in early 2013 which followed a cost reduction programme that lasted from 2009 to 2012.
The programme aims to provide the flexibility needed to face the changing paradigm of the sector caused by the emerging e-commerce and technological dependence.
Based on three platforms, (improvement of operations, namely the integration and reorganization of the distribution networks and models; optimization of the retail network which includes re-sizing plus the expansion of the range of services offered; and lastly the optimization process related with human resources), the programme is expected to be complete by 2015 with full benefits in 2016.
Staff
In 2014 the value of the Balance Sheet’s Employee Benefits decreased about 7% mainly due to the aggregate effect of the (i) revision of the healthcare plan which resulted in a €83m total savings, (ii) the discount rate associated with these responsibilities coming down from 4% to 2.5% and finally by the (iii) changing in the retirement age going from 65 to 66 years-old.
Overall there was in 2014 a non-recurrent gain regarding costs with employees - the real value of 83M€, offset the increasing cost of 20m€, mainly due to increase of
Postal Market (Mail and Business Solutions) Express & Parcels
26
salaries. For 2015 it is expected a salary increase of 2% to be offset by these new negotiations.
Balance sheet optimization
The continuous efforts regarding the balance sheet optimization have shown stronger impacts during the year of 2014 with total assets growing by 7.4%. To this effect contributed several items from the BS, namely goodwill15 and deferred tax assets which reduced long term assets; a significant increase in in Cash and Cash Equivalents motivated by the development of Financial Services; on the other hand, the company’s liabilities also rose by 13% due to the latter development whereas in equity, the growth in the CTT’s net profit offset (by 16 million euros) the actuarial gains/losses plus the respective deferred taxes that arose from the revision of the healthcare plan.
Regarding financing, the values for 2014 were positive with a Net Cash16 position of €(275) million, and a Net Debt17
value of €(75) million, which are positive indicators of the company’s low need of capital/investment, since as internal funds continue to grow. CTT’s liquidity ratio was 135%.
IV. Future goals and strategic lines
By overviewing the developments CTT has been subject to one can understand that the company is trying to capture the growing trends in Financial Services and Express & Parcels as well as keeping costs efficiency levels high. In fact CTT has defined some goals for 2015: expected structural decline regarding mail volume aligned with price increases and the clarification of the regulatory framework; double digit growth in volumes for E&P driven by e-commerce and B2C with corresponding EBITDA margins between 10-14%; mid-single digit EBITDA growth.
Moreover CTT expects to keep delivering profitability as the integration of the Mail and E&P distribution network continues to drive costs down.
15
Alienation of EAD and Tourline’s participation.
16
Net Financial Debt = Short term and Long term Debt of €4mi + Net Financial Services Payables of €386mi – Cash and Cash Equivalents of €665mi = €(275)mi.
17
Net Debt is given by: Employee Benefits of €277mi + Share Incentive Plan of €1.4mi – Employee Benefits Tax Assets of €78mi – Net Cash/Net Financial Debt of €275mi = €(75)mi.
27
Hence, CTT’s strategy for the future lays on four guidelines: 1. Preserve Mail business:
2. Take advantage of the growth opportunities in e-commerce; 3. Asset leverage;
4. New projects: Postal Bank, Memoradum with Altice and BNP Paribas
partnership, enhancing Financial Services and revenue growth correspondingly. Also driving CTT’s growth is the expected pick up in the Portuguese economy18
.
18
28
Chapter III – Industry and Business Overview: Understanding the
Value Drivers of CTT
V – Industry
According to PostEurop (2014, based on the European Commission), the European postal industry takes an active role in the development of the European economy, which can be translated into a turnover of circa 150 billion euros, or put in other words, about 1% of the European Union and national GDPs’ evolution.
The organization points the reinvention of the postal business “in a rapidly changing globalized communication market” as the major future challenge for postal operators. It further refers the main variables that are currently defining the industry: the decline of core mail business, aggravated by difficult financial situations, against the effect of electronic substitution, namely the development of e-commerce, driving parcels growth. Second to these factors, it is also referred the threat of new competitors (non-USO) and the high costs borne by companies.
Adding up to these it is stressed the importance of GDP growth, especially regarding domestic consumption, the quality of the service, namely in parcels business, and the evolution of the regulatory framework.
The European Mail Market
According to a study prepared by Wik-Consult/ ITA Consulting for the European Comission, the European postal sector (includes Mail and E&P) decreased its worth by 3 billion euros between 2007 and 2011, going from 94 to 91 billion euros. During the period of 2007-2010 mail volumes declined on average 4.3% per year, and revenues decreased at a rate of 5.2% per year. Starting in 2010 postal operators have been increased prices in an attempt to offset the volume decline.
29
Table 4 – Addressed Mail Volume CAGR 10-14 and EBITDA margins as of 2014 per Postal Operator
Source: Companies’ data; “European Postal Markets 2015 – an Overview” by Post NL, based on CIA World Factbook, Eurostat, IPC, OECD, WIK (2013), the WorldBank, and Post NL’s team analysis.
* - computed with EBIT values; ** - the group changed its name from Itella to Posti Group Corporation in early 2015.
Country Postal Operator CAGR 10-13 CAGR 10-14 EBITDA margin % (2014) PT CTT – Correios de Portugal -5.6% -5.6% 16.8% NL Post NL -7.1% -7.8% 9.2% UK Royal Mail -7.9% -7.2% 9.9% FR La Poste -2.3% -3.0% 4.5% AU Österreichische Post AG -1.1% -1.6% 14.1% DE Deutsche Post -1.1% -1.2% 5.2%* BE bpost -2.4% -2.8% 23.0% FI Posti Group Corporation** -2.9% -4.4% 2.7% IT Posteitaliane -7.6% - - SE Post Nord -2.9% - - DK Post Nord -8.7% - -
From the graph we conclude that bpost has best-in-class EBITDA margin, followed right after by CTT. Regarding mail volumes, the UK, the Netherlands and Portugal rank no. 1, 2 and 3 in the most dramatic evolutions, respectively.
30
As mentioned, the strategy that most of these companies are adopting to face the current situation of mail decline is pricing review. According to International Letter Survey prepared by the Deutsche Post on march 2014, 14 of the 28 European countries analyzed have increased their letter prices in comparison to previous studies namely from 2013.
On average, postage rates for domestic letters have been increasing by 0.03€ per year, whereas rates for “within Europe” letter mail have risen by 0.07€ (comparing with 2013); for domestic letter mail, the EU average is now 0.62. Concerning cross-border mail, the so called “mail within Europe the average price for the EU is now 1.07€. The following graph shows the letter prices per country, adjusted for the macroeconomic factors of labor costs and purchasing power. The values presents are the overall result of such considerations.
Figure 4 - Weighted consolidated postage rates, 2014, (€)
Source: The Deutsche Post - “Letter prices in Europe – up-to-date international letter price survey, March 2014. 1.64 1.51 1.41 1.34 1.14 1.12 1.11 1.05 1.03 1.01 1.01 0.99 0.96 0.86 0.86 0.83 0.8 0.72 0.71 0.63 0.62 0.61 0.6 0.6 0.6 0.58 0.57 0.48 0.47 0.47 0.4 0 0.2 0.4 0.6 0.8 1 1.2 1.4 1.6 1.8 Bulgaria Slovakia Romania Iceland Finland Czech Republic Italy Switzerland Germany Cyprus Slovenia Average = 0.86€ (+0.04€ than 2013)
31 Mail market in Portugal
With the approval of the Postal Law on April 2012, the Portuguese postal market has been fully open to competition. Nonetheless CTT still holds the concession of some USO reserved activities until 2020.
The concession contract celebrated between CTT and the Portuguese regulator IPC-ANACOM was revised last August, on which were established some guidelines CTT are to endure in the next three years, namely in terms of pricing.
The Portuguese mail market comprises four main segments being Transactional Mail, Social Mail, Press Mail and Advertising Mail19.
Pricing
As mail volumes have been declining, CTT has been increasing prices on some items. In 2014 the items whose volume decreased less were also the more expensive ones, allowing an increase in revenues (for example, Registered mail volume only decreased by 1.7% for example as Advertising mail volume dropped by 12,6%).
Pricing criteria regarding USO postal service was reviewed November 2014, which resulted on an update from the price agreement established in 2008.
The new conditions for pricing apply to the period of 2015-2017, and set a price cap on the basket of non-bulk letter mail, editorial mail and parcels which shall not exceed, in nominal terms, the following:
(25)20
The pricing on the remainder items falling within the scope of USO must be proposed to IPC-ANACOM, being subject to its approval.
For simplification purposes21, this price increase will be referred as concerning the product mix, applicable to overall addressed mail volume. Their evolution has been the following:
19
Appendix 3
20
IPC – Consumer Price Index; FCIPC – Adjustment factor for IPC; FQC – Adjustment factor do volume.
21
32
€0.45 €0.45 €0.46 €0.46 €0.47 €0.49 €0.51
0.7% 0.5% 1.0% 2.2% 4.3% 4.1%
2008 2009 2010 2011 2012 2013 2014 Revenue per item Average Price Increases (Mix)**
1124 1052
962.4 892.3
841.3
2010 2011 2012 2013 2014
Addressed Mail Volume (Thousand objects)*
Figure 5 – Addressed Mail Volume versus Revenue per item, 2010-2014, Source: CTT data.
* - Addressed Mail volume - Transactional Mail, Social Mail, Press Mail, and about 75% of Advertising Mail, 25% concerns Unaddressed Mail.
E-substitution effect
Similar to the analysis made by PostEurop, the International Post Corporation (IPC) also sees in e-commerce an opportunity for the postal sector. According to the latter, “Postal Operators are not Mail companies anymore” and the focus is now on Parcel Market as e-commerce boosts revenues for this business area: the share of the European e-commerce in the EU’s GDP is estimated to be 3.5% and expected to double and triple by 2016 and 2020, respectively (source: EC, e-commerce-europe.eu);
E-substitution effect in Portugal
According to the Institute of Market Research (2012) The Portuguese E&P market was worth 350 million euros, and B2B accounted for 79% of the market.
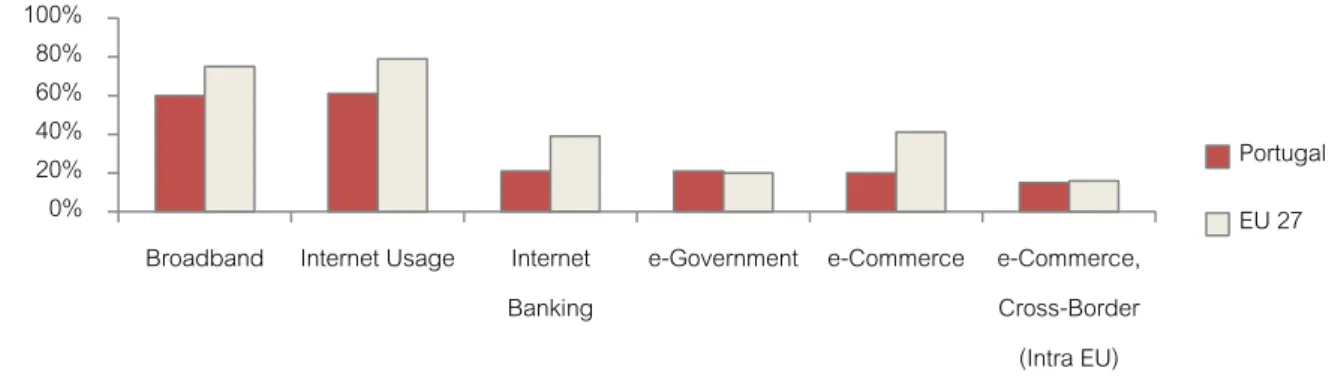
However, in Portugal the numbers are not so optimistic, which is partially offset by the considerable market share CTT holds on E&P Market (31% according to ANACOM). Figure 6 – Internet statistics – Portugal versus European Union 27,
Source: “Main developments in the Postal Sector 2010-2013 – Country Reports, WIK Consult GmbH, 2013; CTT Offering Memorandum, 2013.
33 Spain SEUR ASM NACEX TIPS TNT
Regarding Spain, where CTT holds a market share of 4%22, it is ranked no. 4 in the top 10 e-commerce countries in turnover, with e-sales of circa 13 billion euros in 2012. In fact, e-commerce in southern Europe where both Portugal and Spain are included has been showing an average growth rate of 23% since 200923.
In Portugal although e-commerce is still low, there is still a growth opportunity as it approaches the European average, which is also aligned with the objectives of the European Commission Digital Agenda Scoreboard24. Regarding Spain, it is fair to say that the country is well developed in terms of e-commerce but the intense competition CTT faces is rather discouraging and can result in lower revenues.
Figure 7 – E&P Market in Portugal versus Spain, 2014, Source: ANACOM and IMR, respectively;
CTT’s market share for the Postal Market – 94% | CTT’s market share for the E&P Market (PT) – 31% | CTT’s market share for the E&P Market (ES) – 4%.
22
Source: Institute of Market Research, IMR.
23
Source: e-commerce-europe.eu, based on EMSEC.
24 Appendix 4. 0% 20% 40% 60% 80% 100%
Broadband Internet Usage Internet Banking
e-Government e-Commerce e-Commerce, Cross-Border (Intra EU) Portugal EU 27 Portugal CTT Expresso Chronopost Rangel GLS SEUR NACEX URBANOS DHL Others
34
VI - Business Units
Mail and Business Solutions
Since CTT covers almost the entire mail Market in Portugal and an overview of its performance has already been conducted topics such as mail evolution and pricing will not be repeated. Nevertheless, some numbers regarding this business in the past years are exposed on Appendix 3:
Following up on what is explained above, the key drivers for this business unit are postal volumes and pricing, namely addressed mail volume and the revenue per item. Initiatives and contributions to value growth:
Until 2020 CTT has the concession for USO, which is an opportunity for the company to consolidate its market position;
Boldron et al. (2010) and Flores et al. (2001) have studied the correlation between GDP growth and mail volume evolution, concluding that the first has a positive impact on the latter. As the Portuguese economy is expected to recover this it can be an important step to partially slowdown mail volume decline. Price increases will be tolerable and in line with the industry.
Risks to value growth:
As seen previously, prices can go up only until a certain point, causing the revenues not to be granted.
The e-substitution effect threats the long term revenues as people adapt to technological developments and rely less on traditional mail.
Express and Parcels
In 2014, Portuguese revenues accounted for 60% of total E&P revenues, whereas Spain and Mozambique were responsible for 39% and 1%, respectively.
Table 5 - E&P revenues breakdown 2010-2014 (€million); Source: CTT data, own calculations.
35
2010 2011 2012 2013 2014 CAGR
10-14
CAGR 12-14
Express & Parcels Revenues 143.8 133.9 128.0 129.5 129.0 -2.1% 0.3%
Portugal 90.4 80.5 74.5 75.1 76.9 -3.2% 1.1%
Spain 53.1 52.3 51.6 52.8 50.2 -1.1% -0.9%
Mozambique 0.23 1.1 1.8 1.6 1.8 48.2% -0.2%
Total Items Processed (million
items) 24,4 23,1 22,9 25,4 27,7
2.6% 6.6%
The conservative growth in revenues in both Portugal and Spain is mainly due to the decrease of the revenue (per item) which is explained by CTT as being due to the lower profitability B2B products have in comparison to the remaining portfolio. As B2B is the most growing segment and is expected to grow even further derived by e-commerce, the profitability levels and revenue per item is also expect to decrease25. Thus the key drivers for E&P are: parcels volumes and pricing.
Initiatives and contributions to value growth:
Intention of growing a strong B2B market in Mozambique which can represent an opportunity to leverage the company’s position in that country.
Reorganization of the commercial activity enhancing cost control which consequently could result in better price offerings.
CTT’s new initiatives in order to take large advantages from E-substituion
effect and e-commerce development: Amplification of the Pick-Up/Drop-Off
(PuDo) network achieved via a new partnership with Worten, and enhanced by CTT’s store network; Launch of the “Express Surf” service, responsible for the transportation of surf boards; Development of on-line tools enabling customers to “track and trace” their parcels.
25
36
Intention to expand its Iberian offer, having created an “e-commerce area” within the company that aims to promote the last mile26.
Finally CTT made available in 2014 the same product solutions for delivery for Portugal and Spain, unifying and integrating its Iberian portfolio.
Risks to value growth:
The business is set to grow namely due to B2C and e-commerce; however these are low cost products which means that even if the traffic grows very much, profit does not do so in the same scale.
Even though there is room to grow in both Portugal and Spain in terms of e-commerce and consequently, parcels traffic, the e-business is still far behind European average.
Financial Services
Financial services are responsible for boosting revenues for CTT in the past years as seen on chapter II. Its business segments include Savings and Insurance, Transfers and Money Orders and Payment Solutions.
In terms of performance, apart from what was assessed on chapter II, it is important to refer that despite the fact that Financial Services revenues grew 6% in 2013 and 23% in 2014, not every segment shown the same behavior; the only segment increasing its turnover was Savings and Insurance, with a growth rate of 114% in 2014 (82% in 2013), motivated by the increase in saving and insurance flows which grew by 86% in 2014 (16.7% in 2013).
Both Payment Solutions and Transfers & Money Orders decreased their revenues by 5.9% and 6.5% respectively, which has been happening since 2012.
As such the main driver for growth in FS is Savings and Insurance segment, which depends on the Portuguese behavior towards saving, and, consequently, concerns GDP evolution and disposable income. Initiatives and contributions to value growth:
26
“Last mile is a term used in supply chain management and transportation planning to describe the movement of people and goods from a transportation hub to a final destination in the area.” Source: Wikipedia.
37 0 5 10 15 20 4Q00 1Q00 2Q01 3Q02 4Q03 1Q03 2Q04 3Q05 4Q06 1Q06 2Q07 3Q08 4Q09 1Q09 2Q10 3Q11 4Q12 1Q12 2Q13 3Q14
Portugal Euro Area
Partnerships with important insurance companies, Mapfre and Fidelidade, boosting insurance product offering.
New PPR27 offering, enhanced by the partnership with IGCP, allowing CTT to
sell public debt products, which are highly profitable.
Partnership with BNP Paribas an important step towards the improvement of the product portfolio. Furthermore recurrent revenues are expected until 2019 derived from the font-fee agreed with the entity.
Apart from CTT’s internal developments that contribute to the development of Financial Services we point some few studies that lead to believe that this business unit is set for growth:
Families have been increasing saving rates:
Figure 8 – Families saving rate, 2000-2014 (% of disposable income); Source: Bank of Portugal
Post-crisis saving habits
A Cetelem Observator28’s study (2014) recently concluded that the economic crisis is partially responsible for creating awareness among Portuguese consumers. The numbers point to 66% as a percentage of the Portuguese who “put money aside” instead of spending it (against 67% European average), and 95% is the corresponding percentage of the Portuguese who intent to limit their spending in the long-term, (against 87% European average).
27
In portuguese PPR corresponds to Planos Poupança Reforma, and it translates to Savings and Retirement Plans.
28
38
Further it is referred Postal Bank as a main contributor of the development of Financial Services, despite the fact that it won’t be considered for valuation purposes directly. Risks to value growth:
E-substitution that can make payment solutions business obsolete in the future as people’s attention to e-payment channels such as MBnet grows stronger. According to SIBS29, in 2013 2 billion purchases were made via MBnet, comparing to 1.6 billion (2012) and 1.4 billion (2011).
In conclusion, E&P and Financial Services are important units when it comes to guaranteeing CTT’s long term success. Boosting the company’s overall performance (regarding turnover mostly), there are some initiatives that not only contribute to a positive future scenario but also leverage the strong network CTT owns:
Partnership with Coca-Cola (initiated in 2012), enhancing CTT’s ability of being associated with major projects and global brands.
Partnership with Toys R Us, envisioning the selling of toys in CTT’s stores. Partnership with SONAE, envisioning the selling of office material in about 127
CTT stores.
“Citizen Stores” booths within CTT’s stores, explained on Appendix 6
29
39
CHAPTER IV – Valuation: Finding CTT’s value according to its
Market reality and Business Drivers.
Overall Assumptions
Hence items forestry and respective explanation will be assessed individually based on the contents and conclusions exposed on chapter III:
D/E = 0
Medium and (i) Long Term Debt represent only 4 million euros [4 million euros / (Market Price (9.92€) x 150 million Shares Outstanding) = 0.02%], (ii) CTT has a strong Cash position and (iii) presents a negative net debt value;
Forecasts until 2018
Most forecasts will be made until 2018 since it is expected that in three years the e-substitution effect affecting CTT’s entire business will be fully established in Portugal, causing both Mail volume decline and growth in E&P to stabilize.
DPS Growth
During the Conference call of March the 5th 2014, the company expressed the goal of growing DPS in a stable way instead of guaranteeing the highest payout ratios possible. As no further information was disclosed, the payout ratio will be 90% in line with the recent years.
40
Revenues
Mail & Business Solutions Part I – Addressed Mail
Firstly it is important to remind that Addressed Mail corresponds to Transactional Mail, Press Mail and 75% of Advertising Mail. Hereupon, after assessing the values for the addressed part, we still have to account for the remaining 25% of Advertising Mail (unaddressed), which can be seen on appendix 8, as it represents a very small portion of Mail total revenues (%).
Two drivers were used to predict the future behavior of this segment; volume and pricing/revenue per item.
Figure 9 – Addressed Mail Volume 1st Forecast (# of objects), Source: own calculations and ANACOM data.
Real mail traffic per quarter corresponds to the numbers given by ANACOM, whereas forecasted Volume results from a regression with an r2 of 0.91.
During the 2014’s results presentation (march 5th
, 2015) CTT presented some numbers regarding mail volume decline; the company expects the slowdown seen in the last quarter of 2014 to continue and points a -3% to -5% annual growth rate in volume.
- 50 000 000.00 100 000 000.00 150 000 000.00 200 000 000.00 250 000 000.00 300 000 000.00 350 000 000.00 400 000 000.00 1T05 4T05 3T06 2T07 1T08 4T08 3T09 2T10 1T11 4T11 3T12 2T13 1T14 4T14 3T15 2T16 1T17 4T17 3T18 2T19 1T20 4T20 Forecast - Addressed Mail Traffic per Quarter Addressed Mail Traffic per Quarter
CAGR 15-20 -5.6%
41 0.00 0.20 0.40 0.60 0.80
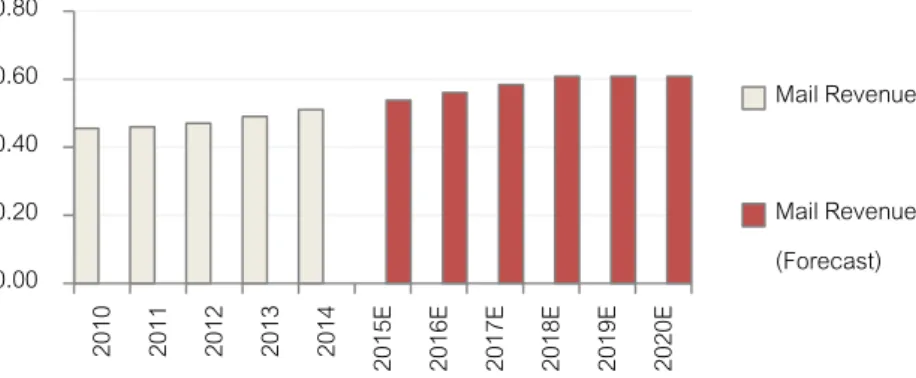
2010 2011 2012 2013 2014 2015E 2016E 2017E 2018E 2019E 2020E
Mail Revenue per Item Mail Revenue per Item (Forecast)
Because addressed mail volume and the Portuguese GDP growth are strongly correlated, the values advanced by CTT and the ones obtained through the above regression are compared, in order to achieve a more realistic evolution of volume, by considering both economic recovery and historical behavior.
Further, we rely on the assumption (2): As such, from 2018 onwards a smaller YoY growth rate regarding the evolution of mail was imposed.
To predict the theoretical revenue per item we lie on inflation levels expected for Portugal, which results on an average price increase (on average mix of products) of 4% until 2018.30
These calculations are assumed to be in lieu with the criteria exposed on chapter III, giving that (i) formula (x) allows some adjustments to volume decrease; (ii) prices remain unchanged from 2018 onwards since ANACOM’s price agreement ends in 2017.
Figure 10 - Addressed mail revenue per item, forecast (€)
Combining the two drivers, the revenue forecast is the following:
30
42
Table 6 – Transactional, Press and Advertising Mail Revenue Forecast
Total Revenue = Addressed Mail (Transactional, Press and 75% of Advertising Mail) + Unaddressed Mail (25% of Advertising Mail)
Part II – Other
Revenues comprising USO Parcels, Philately, Retail, Other and Business Solutions can be assessed on Appendix 8.
Express & Parcels (E&P)
E&P revenues are divided in three referring to the three countries the segment operates: Portugal, Spain and Mozambique.
Portugal
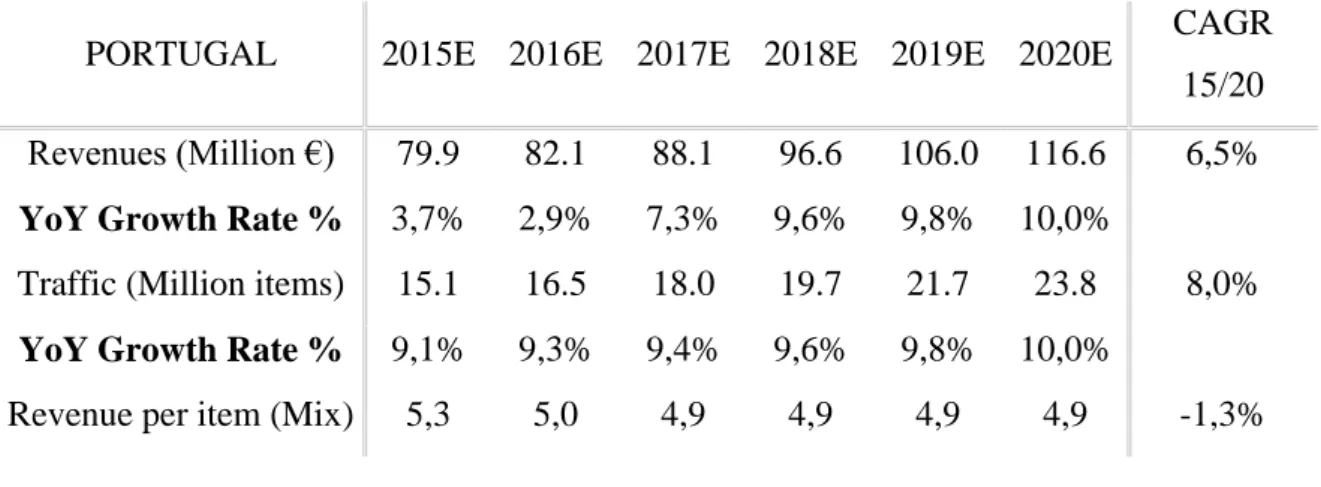
It is in Portugal revenues are predicted to grow the most since CTT has a significant market share in this business. Traffic is predicted by picking upon the last growth rates observed (the ones that reflect the trend of growth, expected in the future) and adding the economic driver that is GDP; consequently we achieve a combined effect to drive parcels volume upwards, which results in a CAGR 15-20 of 8%. We still assure a conservative approach (the volume evolution only reaches double digit growth in 2017) based on the fact that e-commerce is not yet very present in Portugal and there we have to consider the risk of underdevelopment.
MAIL REVENUES (Part I) 2015E 2016E 2017E 2018E 2019E 2020E CAGR
15/20
Adressed Mail Revenues (Million €) 438.0 434.7 430.8 427.5 409.2 393.7 -1.8%
YoY Growth Rate % -3.1% -0.8% -0.9% -0.8% -4.3% -3.8%
Mail Revenue per Item (€) 0.54 0.56 0.58 0.61 0.61 0.61
Unadressed Mail Revenues (Million €) 7.9 7.9 7.9 7.9 7.9 7.9
Total Revenue
43
Concerning price per product mix is expected to decrease revenue per item not only B2C, the most growing segment, happens to be the cheapest, which negatively affects the product mix, but also because CTT must not increase its prices in order to maintain a competitive position in the market.
Table 7- Portuguese Market revenue forecast, 2015-2020, Source: own calculations.
PORTUGAL 2015E 2016E 2017E 2018E 2019E 2020E CAGR
15/20
Revenues (Million €) 79.9 82.1 88.1 96.6 106.0 116.6 6,5%
YoY Growth Rate % 3,7% 2,9% 7,3% 9,6% 9,8% 10,0%
Traffic (Million items) 15.1 16.5 18.0 19.7 21.7 23.8 8,0%
YoY Growth Rate % 9,1% 9,3% 9,4% 9,6% 9,8% 10,0%
Revenue per item (Mix) 5,3 5,0 4,9 4,9 4,9 4,9 -1,3%
Spain
The rationale for predicting revenues in Spain is exactly the same used for Portugal31 but since Spanish business is less profitable (as explained in chapter III) and the market is far more conservative so are the forecasts: a CAGR 15-20 of 5% regarding volume growth and a CAGR 15-20 of 1.7% regarding revenues growth.
Table 8- Spanish Market revenue forecast, 2015-2020, Source: own calculations.
SPAIN 2015E 2016E 2017E 2018E 2019E 2020E CAGR
15/20
Revenues (Million €) 79.9 82.1 88.1 96.6 106.0 116.6 6,5%
YoY Growth Rate % 3,7% 2,9% 7,3% 9,6% 9,8% 10,0%
Traffic (Million items) 15.1 16.5 18.0 19.7 21.7 23.8 8,0%
YoY Growth Rate % 9,1% 9,3% 9,4% 9,6% 9,8% 10,0%
Revenue per item (Mix) 5,3 5,0 4,9 4,9 4,9 4,9 -1,3%
31