Sustainability Evolution of North and Alentejo Vineyard
Regions
1Evolução da Sustentabilidade nas Regiões Vitícolas do Norte e
Alentejo
Micael Santos
micaels@utad.pt
University of Trás-os-Montes e Alto Douro (UTAD)
Centre for Transdisciplinary Development Studies (CETRAD)
A. Galindro
anibalg@utad.pt
University of Trás-os-Montes e Alto Douro (UTAD)
Centre for Transdisciplinary Development Studies (CETRAD)
C. Santos
cisantos@utad.pt
University of Trás-os-Montes e Alto Douro (UTAD)
Centre for Transdisciplinary Development Studies (CETRAD)
A. Marta-Costa
amarta@utad.pt
University of Trás-os-Montes e Alto Douro (UTAD)
Centre for Transdisciplinary Development Studies (CETRAD)
V. Martinho
vdmartinho@esav.ipv.pt
Polytechnic Institute of Viseu (IPV)
Agricultural School (ESAV)
Abstract/ Resumo
1 This work was supported by the R&D Project INNOVINE & WINE – Vineyard and Wine Innovation Platform - Operation NORTE -01-0145-FEDER-000038, co-funded by the European and Structural Investment Funds (FEDER) and by Norte 2020 (Programa Operacional Regional do Norte 2014/2020).
The authors acknowledge the suggestions provided by the participants at the “24th APDR Congress” (Covilhã, Portugal, 2017) in which a previous version of this paper has been discussed.
The wine sector currently lacks nuclear fea-tures, which makes Portugal’s producing per-formance drift away from the frontline world-wide wine producers. The aim of this paper is to evaluate the evolution of the Portuguese wine industry’s performance through the world and national available statistical data. Also, this work tries to evaluate the sustainability dyna-mic regarding the North and Alentejo,
O setor vitivinícola carece atualmente de ca-racterísticas nucleares que fazem o desempenho produtivo do país afastar-se dos líderes da pro-dução mundial de vinho. O objetivo deste traba-lho consiste em avaliar a evolução do desempe-nho do setor vitivinícola português através dos dados estatísticos disponíveis, a nível mundial e nacional. Pretende-se ainda avaliar a dinâmica da sua sustentabilidade, no Norte e Alentejo,
1. INTRODUCTION
Portugal is the 11th world wine producer, 9th world exporter in value and the 5th largest pro-ducer in the EU in terms of value and volume (OIV, 2016). The importance of the wine sec-tor in this country is quite visible in the exten-sive and important demarcated regions like Douro and Alentejo, which produce wines with higher quality over time and are identified as Protected Denomination of Origin (PDO) (IVV, 2017b). Nonetheless, the sector current-ly lacks nuclear features, which makes Portu-gal’s producing performance drift away from the frontline of worldwide wine producers.
This situation may threaten the positive re-lationship between the wine sector and the regional competitiveness, found by Hall & Sharples (2008) and Viassone et al. (2016), since the sector contributes directly with em-ployment supply, economic growth, tourism development and infrastructure, which all im-prove the overall social well-being. The growth of this sector in conformity with the principles of sustainable development is be-coming a priority; nonetheless the inherent strategic development needs frequent adapta-tion, as pointed out by Capri & Pomarici (2014), Misso & Borrelli (2013) and Zucca et al. (2009). A business strategy based on sus-tainability, which perceives social responsibi-lity as an opportunity, may offer a source of competitive advantage to sustainable oriented firms (Porter & Kramer, 2007).
Sustainability is progressively gaining im-
portance in the agri-food sector (Jones, 2012) and plays a very important role in the wine business (Ohmart, 2008). Related to the wine industry, Flint et al. (2011) define - as the abil-ity of a business to be successful in the long term. It also means specifically that the busi-ness should be resilient to significant competi-tive forces in this marketplace. The sustainabil-ity literature (e.g. Elkington, 1998; Ohmart, 2008; Marta-Costa, 2010; Marta-Costa et al., 2012; Mencarelli & De Propris, 2014) evi-dences it through a three-dimensional concept based on the economic performance of the various sectors of activity, alongside the envi-ronmental and social impacts directly related to the triple bottom line approach.
This subject plays an important role on viti-culture since it is a business which depends on scarce natural resources; therefore the agricul-tural practices may have a positive or a nega-tive impact on the environment (Marta-Costa, 2010; Marta-Costa et al., 2012). Generally, there is an increasing concern about the nega-tive environmental impacts of the wine sector through the vineyard and wine-making opera-tions alongside the wine tourism activities (Gabzdylova et al., 2009; Silverman et al., 2005; Sinha & Akoorie, 2010). Regarding singularly the agronomic activity, Marta-Costa (2010) identifies a great diversity of farming systems, from the harmless nature-friendly approaches that are based on scarce labour, to the bulky and intensive input-oriented systems. Those two have keenly different impacts on the environment. The soil and water manage- using the Portuguese Farm Accountancy Data
Network from 2001 to 2012. From the sustain-nability indicators, the results show that Alente-jo presents the best performance in terms of environmental sustainability. The North has an increasing economic dimension of sustainabil-ity and good social performance. The conclu-sions suggest that academic research can im-prove the wine industry’s overall orientation to sustainability.
Keywords: Alentejo, North, Performance,
sus-tainability, wine sector.
JEL Codes: Q01,Q15, Q19
através dos dados da Rede de Informação de Contabilidade Agrícola de 2001 a 2012. Dos indicadores de sustentabilidade obtidos verifi-ca-se que o Alentejo obtém o melhor desempe-nho em termos de sustentabilidade ambiental. O Norte tem uma tendência para melhorar a di-mensão económica da sustentabilidade e revela bom desempenho social. As conclusões suge-rem que a investigação académica pode melho-rar a orientação geral desta indústria para a sua sustentabilidade.
Palavra-chave: Alentejo, Norte, desempenho,
sustentabilidade, setor vitivinícola.
ment, solid waste, energy and agrochemical use, greenhouse gas emissions and water con-tamination have been the main collateral da-mages of this industry and are associated with the most negatively remarkable environmental impacts (Colman & Paster, 2009; Ohmart, 2008).
However, the viticulture endeavours also affect other environmental issues such as the climate. Bosco et al. (2013) identified that the vineyard phase represents about 22% of the overall carbon emissions relating to wine pro-duction, and production logistics seem to be responsible for around 50% of the emissions associated with wine production (Christ & Burritt, 2013). This situation alarms the grape growers, since grape production is very vul-nerable to temperature changes and that hazard may affect the survival of some varieties of grapes (Blackmore & Goodwin, 2009). The work of Cichelli et al. (2016) emphasizes the strong link between climate and vine and they argue that the effects of climate change on viticulture could be more significant in moun-tainous ecosystems, such as the Douro region.
The balance between environmental issues and their relationship with economic perfor-mance of viticulture and the social context of the activity can be assessed through the con-cept of agricultural sustainability. To prove this relationship, Klassen & McLaughlin (1996) and Russo & Fouts (1997) have shown a positive correlation between environmental management initiatives and financial perfor-mance of companies. For example, in New Zealand some producers have implemented environmental management systems to diffe-rentiate their wines and they gained a competi-tive advantage (Hughey et al., 2005). This product differentiation occurs because con-sumers consider products to be more valuable when they originate from more sustainable practices (Flint & Golicic, 2009; Woodruff, 1997). Therefore, it allows the companies to tag a premium price on them (Hill et al., 2014). This paper aims to briefly characterise the Portuguese wine industry performance in in-ternational and national context, through sector statistical data, and evaluate the evolution of sustainability indexes from Alentejo and North regions using the available data of Portuguese Farm Accountancy Data Network from 2001 to 2012 (PTFADN, 2001-2012) in three
dimen-sions: economic, social and environmental. For the development of the Portuguese wine sector it is important to study its dynamics and to identify the faults that can be improved be-cause depletion of resources or a low level of competitiveness can jeopardize their sustaina-bility.
After the brief introduction of this first sec-tion, the article features three more. Section two provides a statistical analysis of the Portu-guese wine sector in both a worldwide and internal context. A brief revision of the sus-tainability assessment literature in agricultural activities is offered in section three and the evolution of some sustainability indicators for the North and Alentejo regions of Portugal are described in section four. Finally, the last sec-tion summarizes the work discussion and con-clusions.
2. BRIEF ANALYSIS OF
PORTU-GUESE WINE SECTOR
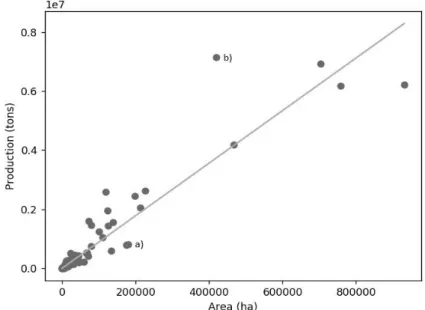
Different countries have numerous reasons for bulky wine production, such as historical factors, favourable environment and climate, which produces distinctive wine and highlights comparative advantages against other coun-tries. Spain, Italy and France are the best wine exporting countries, scoring an aggregate value of nearly 50% of the worldwide wine exports over the last five years (FAOSTAT, 2017). In 2014 and according to this Food and Agricul-ture Organization’s (FAO) data, the worldwide harvesting area for grape production was roughly 7 million ha, which has significantly diminished since the 1960s, when the world-wide harvesting area was floating between 9 and 9,5 millions ha. Nonetheless, despite smaller harvesting area, the grape industry has managed to improve productivity in order to maintain the same production levels. To seek information about the distribution of the productivity among the countries we consider the most recent available FAO data (FAO-STAT, 2017) from 90 wine producing coun-tries for 2014. Figure 1 and Table 1 show the relationship between grape production (tonnes) and harvested area (ha), through an Ordinary Least Squares (OLS) regression, explained extensively in Greene (2000).
Figure 1: Grape production per area plot of the 90 considered countries in 2014
(a) Portugal; (b) United States of America (Source: Own elaboration with FAOSTAT (2017) data)
The analysis of Figure 1 shows a positive slope line as the visual output of the OLS re-gression (Table 1). Portugal appears signifi-cantly below the prediction line, which means smaller area productivity (grape per hectare) compared to the mean of the countries consi-dered in the sample. On the other hand, the
United States stands as a great outlier conten-der way above the line, showing an outstand-ing grape output per harvested area. While the scatter plot tells us about how countries place individually regarding those two features, the OLS regression (Table 1) allows us to find a general remark.
Table 1: Regression results for dependent variable (Grape production, Tonne)
Parameters Estimation T-value P-Value (Pr(>|t|))
𝛽1(Harvested Area) 8,9041 27,742 0,000*
* Statistically significant results for 1% level of significance. The low p-value (< 0,01) indicates that we can reject the null hypothesis even for 1% of significance.
R-Square – 0,896. The high-valued R-squared (0,896) states that roughly our model explains 90% of the response variable movements. Source: Own elaboration.
The coefficient 𝛽1 of Table 1 tells us that in average the grape production increases by 8,9041 tonnes per each additional hectare (in harvested area). Portugal produced approxi-mately 4.575 tonnes of grape per ha, a signifi-cantly distant value from the worldwide ave-rage.
After a concise presentation about the point at which Portugal’s wine sector stands among other countries, we will present the context of the sector among the Portuguese regions. Ac-cording to the available data on IVV (2017a, 2017b), Table 2 presents the vineyard area and production of wine, from 2000 to 2015, in Portuguese regions.
According to Table 2, from 2000 to 2015, Portugal’s mainland vineyard area declined 17% during this period. Alentejo was the only region that countered the decreasing trend, scoring a significant 35% area growth. Regar-ding the production of wine, Alentejo and Se-túbal presented a voluminous growth, 165% and 53% respectively, while the other regions saw their production decay or swing steadily around zero. Even though this type of study allows us to pinpoint general trend from each region, it is also worth gathering information about which type of wines those regions are producing.
Table 2: Vineyard area (ha) and production of wine (hl) in Portuguese regions, from 2000 to 2015 Regions 2000 2015 Growth rate of area Growth rate of produc-tion Area (ha, %) Production (hl, %) Area (ha, %) Production (hl, %) Trás-os-Montes e Douro 67.638 (28%) 1.715.186 (26%) 59.972 (30%) 1.725.077 (25%) -11% 1% Beiras 57.200 (24%) 1.202.146 (18%) 53.100 (27%) 908.250 (13%) -7% -24% Alentejo 16.123 (7%) 434.173 (7%) 21.816 (11%) 1.152.184 (16%) 35% 165% Minho 34.035 (14%) 880.865 (13%) 20.433 (10%) 874.491 (13%) -40% -1% Lisboa 21.875 (9%) 1.305.665 (20%) 20.359 (10%) 1.202.711 (17%) -7% -8% Tejo 29.765 (13%) 744.062 (11%) 13.589 (7%) 611.183 (9%) -54% -18% Península de Setúbal 9.283 (4%) 329.404 (5%) 7.556 (4%) 504.129 (7%) -19% 53% Algarve 2.154 (0,9%) 13.817 (0,2%) 1.858 (0,9%) 13.630 (0,2%) -14% -1% Mainland Portugal 238.073 6.625.318 198.683 6.991.655 -17% 6%
Source: IVV (2017a, 2017b).
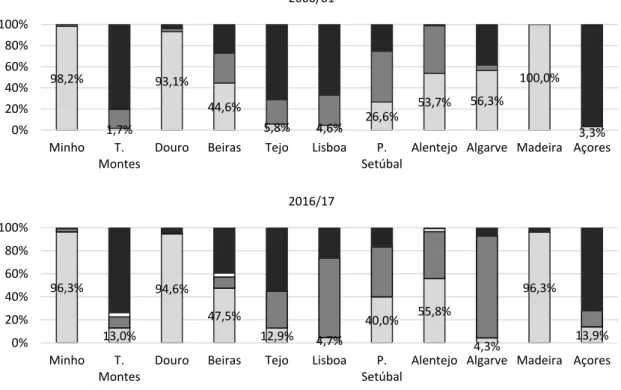
Figure 2 displays each region according to their type of wine production, using data from
IVV (2017b), for the first (2000/2001) and last (2016/2017) year available.
Figure 2: Wine type production of the Portuguese regions in 2000/01 and 2016/17
Source: Own elaboration with IVV (2017b) data 98,2% 1,7% 93,1% 44,6% 5,8% 4,6% 26,6% 53,7% 56,3% 100,0% 3,3% 0% 20% 40% 60% 80% 100% Minho T. Montes
Douro Beiras Tejo Lisboa P. Setúbal
Alentejo Algarve Madeira Açores 2000/01 96,3% 13,0% 94,6% 47,5% 12,9% 4,7% 40,0% 55,8% 4,3% 96,3% 13,9% 0% 20% 40% 60% 80% 100% Minho T. Montes
Douro Beiras Tejo Lisboa P. Setúbal
Alentejo Algarve Madeira Açores 2016/17
Observing Figure 2, Minho, Douro and Madeira produces a majority of PDO wine (more than 90% of the production). In contrast, Trás-os-Montes and Açores produce mainly wine without any classification (without Pro-tected Geographical Indication (PGI) or PDO), which represents more than 70% of their wine production. In general, all regions increased or maintained their representativeness of PDO wine production, except in Algarve, which production of PDO wine production decreased significantly from 56,3% to 4,3%, starting to produce essentially PGI wine. The production of PDO wine in Lisboa remained steady from 2000/01 to 2016/17, but the wine without any classification decreased, while the PGI wine increased. In short, all regions essentially pro-duce wines with better classifications, so this analysis suggests that Portugal has endea-voured to improve the quality of wines and to have this quality recognized.
Concerning the studied regions of this work, the North region (comprises Trás-os-Montes e Alto Douro and Minho) is the Portu-guese vineyard region with highest wine pro-duction (25%, Table 2) and with the largest vineyard area (despite the decrease, 30%, Ta-ble 1), while the Alentejo region has evolved in recent years with an increase of 35% in wine production and an amazing increase of 165% in vineyard area. Despite the evolution of Alentejo, this region has not made great efforts to increase the amount of wine with denomina-tion of origin. However, the North region has invested heavily in the production of wine with a designation of origin with the exception of Trás-os-Montes and Douro regions.
3. SUSTAINABILITY ASSESSMENT
IN FARMING SYSTEMS
Sustainability is a visionary development paradigm that emerged as an attempt to bridge the gap between environmental concerns from the increasingly evident ecological conse-quences of human activities, and socio-political concerns about human development issues (Robinson, 2004). The need for farming systems to become more sustainable made their sustainability assessment imperative, and the theme has gained interest as a common topic of discussion by societies all over the world (Marta-Costa & Silva, 2013; Petronilho et al., 2013).
However, due to the complexity and lack of
consensus around the sustainability concept, very different approaches have been taken in sustainability assessments and their develop-ment has been neither easy nor consensual and many problems have been identified for as-sessing sustainability in the agricultural sector (Marta-Costa & Silva, 2013, Saltiel et al., 1994). The multifunctionality of the agricul-ture, the scales to adopt, the indicators selec-tion, the linkages and the integration of indica-tors, and the application of the results in the systems are the main problems cited by Marta-Costa & Silva (2013), Binder & Wiek (2007) and Smith & McDonald (1998). The complexi-ty of the sustainabilicomplexi-ty assessment is empha-sized by Masera et al. (2000) and the authors argue that a multidisciplinary effort and the multi-criteria models supported by qualitative and quantitative indicators are essential re-quirements for the process that should have a broad temporal analysis (Masera et al., 2000).
The main methodologies that have been de-veloped to assess sustainability in the agricul-tural sector are indicators or tools-based inde-xes that obey integrative assessment approach-es in rigorous and complex frameworks. With-in this structure, Marta-Costa & Silva (2013) identified the Framework for the Evaluation of Sustainable Land Management (FESLM; FAO, 1993); Sustainability Solution Space for Deci-sion Making (SSP; Wiek & Binder, 2005);
l’Exploitation Agricole Durable (ARBRE;
Pervanchon, 2007); Response-Inducing Sus-tainability Evaluation (RISE; Häni et al., 2007); Sustainability Assessment of Farming and the Environment (SAFE; Van Cauwen-bergh et al. 2007); and Indicateur de Durabilité des Exploitacions Agricoles (IDEA; Vilain, 2008). These methodologies have a rigorous framework that can be applied to the farming systems with a set of well-defined and prede-fined indicators that are embedded in the sus-tainability concept and its environmental, so-cial and economic dimensions. Masera et al. (2000) developed the Framework for the Eva-luation of Natural Resources Management Systems via Sustainability Indicators (MES-MIS), that is differentiated from the others methods through its relative and subjective character of the sustainability indicators that are identified according the systems under evaluation. In fact, as stated by the document of the Organisation for Economic Co-operation and Development (OECD, 2002), in agricul-ture there is no single path to sustainability and
no unique model of sustainable economic ac-tivity that could be applicable to all geograph-ic, economic and social environments. The specificities of the local culture, society and economy have to be taken in account to im-plement and articulate sustainability at a local level (Zanoli, 2007; Borsellino et al., 2016).
The different approaches of sustainability assessment had been studied in a comparative way (e.g. Gaviglio et al., 2017; Olde et al., 2016; and Marta-Costa & Silva, 2013). Gavi-glio et al. (2017), with a study case for South Milan Agricultural Park through IDEA, RISE, SAFE, Analysis of Farm Technical Efficiency and Impacts on Environmental and Economic Sustainability (SOSTARE) and Monitoring Tool for the Integrated Farm Sustainability (MOTIFS), verified that it is possible to cons-truct a sustainability assessment methodology, taking into account the object of study, the context and the available data. Olde et al. (2016) compared four indicator-based metho-dologies (RISE; Sustainability Assessment of Food and Agriculture systems – SAFA; Public Goods – PG; and IDEA) for sustainability assessment at farm level in five Danish farms, and concluded that RISE was the most relevant tool for assessing the sustainability of the farm. However, some limitations were identified for all of them concerning the application of more sustainable practices in the decision-making process.
Generally, sustainability assessment metho-dologies have been used to evaluate both or-ganic and conventional farms. This was done by Astier & Hollands (Eds.) (2005) and Gavi-glio et al. (2017) and their results showed that organic farms have better results in environ-mental indicators and in the majority of social indicators than conventional farms. The con-ventional farms seem to have better economic performance. This result shows the trade-off of the economic and the environmental dimen-sions of sustainability.
The environmental component of sustaina-bility typically dominates discussions of sus-tainability assessments of productive systems, which has given rise to advancement of as-sessments approaches that only consider one or two of the categories of the triple bottom line (Saltiel et al., 1994; Von Wirén-Lehr, 2001; Darnhofer et al., 2010; Santiago-Brown et al., 2014). For instance, the carbon footprint as-sessments (Saltiel et al., 1994, Koohafkan et
(LCA; Keoleian, 1999) focused on the envi-ronmental dimension as well as the cost-benefit analysis, commonly used to evaluate initiatives in economic and social terms (Espi-nosa et al., 2008). However, assessments that only consider one or two of the categories of the triple bottom line are insufficient to fully evaluate sustainability, as sustainability is a systemic concept (Von Wirén-Lehr, 2001, Santiago-Brown et al., 2014).
Linear programming tools, multi-objective and multi-attribute models constitute other group of methodologies that are used to com-plement the sustainability assessment, usually to drive stakeholders to the goal that has been settled (Rezaei-Moghaddam & Karami, 2008; Xavier et al., 2017; and Marta-Costa, 2010).
Rezaei-Moghaddam & Karami (2008) ap-plied a multi-criteria decision-making tech-niques with analytic hierarchy process to eva-luate the sustainable agricultural development of two models based on ecological moderniza-tion and demodermiza-moderniza-tion theories in Fars, province of Iran. Xavier et al. (2017) analysed the importance of different sustainable indica-tors in agroforestry using the extended goal programming model in Portugal. These two different methodologies allow the ordering of sustainability indicators according to their importance given by the stakeholders. Rezaei-Moghaddam & Karami (2008) showed that the stakeholders consider the environmental indi-cators more important and the results of Xavier et al. (2017) give relevance to the economic dimension. Yet, Marta-Costa (2010) used the multi-objective programming to plan a Portu-guese farm that was capable of reaching a compromise between the economic and envi-ronmental sustainability.
Generally, the economic dimension of the sustainability assessment methods is concre-tized by the adoption of indicators related to the production, productivity, income, value added and employment, among others. The wise use of resources, product quality, agro-chemicals used and management of water, waste, soil and organic matter are the variables used for environmental dimension. The parti-cipation in associations, cooperation, training, education and equity are some of the social indicators to assess the agricultural sustainabil-ity, but these are the least used in the sustaina-bility literature (Gaviglio et al., 2017; Marta-Costa, 2010; Marta-Costa et al., 2012;
Rezaei-2017).
Efforts must be made to find more sustain-able solutions that allow a balance between their dimensions. Santini et al. (2013) and
Sil-verman et al. (2005) identify three drivers that motive firms towards sustainability, which are internal, external and strategic drivers. The internal factors integrate managerial attitudes, concerns about employee safety, company
culture, concern about environmental impacts and the state of the environment, land prote-ction and social responsibility (Gabzdylova et al., 2009; Grimstad, 2011; Silverman et al., 2005). External drivers are related to customer demand, investor, community and public pre-ssure, competitors and compliance with regula-tions (Gabzdylova et al., 2009; Grimstad, 2011; Silverman et al., 2005). Finally, the stra-tegic factors are the competitive advantage, differentiation, marketing benefits, public ima-ge, brand reputation, product quality and cost savings (Alonso, 2010; Gabzdylova et al., 2009; Grimstad, 2011; Silverman et al., 2005).
4. SUSTAINABILITY DYNAMICS
BETWEEN 2001 AND 2012
With the Portuguese wine industry layout and production having been described in the previous section we follow up trying to answer the core of this empirical work and seek infor-mation about how sustainable this industry is currently. We use the database from PTFADN (2001-2012) for quality wines, available only for North and Alentejo regions, for the period from 2001 to 2014. However, the methodology of this database changed in 2013, so we pre-sent the evolution of sustainability indicators for both Portuguese regions only until 2012.
Following the list of quality criteria for a sustainability indicator and its dimensions defined for Herrera et al. (2016), Marta-Costa et al. (2012) and Martinho (2017), the analysed indicators or indexes will be organized in three groups, highlighting the economic, social and environmental (Annex I) contexts, in a sustain-nability perspective.
Economic indicators (Annex I) were those parameters which were designed to assess the economic profitability of the systems or to influence them directly (Marta-Costa et al., 2012). This dimension is very important be-cause it influences the maintenance of the ac-tivity and the permanence of the farmers, which is essential for the protection of the en-vironment and to preserve the landscape and natural resources. Besides satisfying food de-mand, viticulture must promote appropriate
returns for the family-holding, minimize risk aversion, reduce and promote the efficient use of external inputs and lead to self-sustaining and viable long-term systems.
All data in monetary terms was deflated using the prices index calculated by the Na-tional Statistics Institute (INE; 2002-2012) data from Portugal, with 2001 settled as the reference year.
From the economic indicators of Annex I it is possible to find that the utilized agricultural area (UAA) is greater in Alentejo with a de-creasing evolution from 29,45 ha (on average by farm) in 2001 to 19,92 ha in 2012. In con-trast, the North presented smaller average areas of around 7 and 8 ha but with some increases in the period 2001 to 2012.
The productivity of the UAA manifested by gross margin and agricultural production is higher in the North with an increasing trend after 2008 and slight decrease between 2011 and 2012. On the other hand, Alentejo had a strong decrease from 2001 to 2012.
The current subsidies per ha increased du-ring the period in both regions from 2001 to 2012 and North received more subsidies on average per farm than Alentejo in all periods.
The intermediate consumption decreased slightly in the North and strongly in Alentejo from 2001 to 2012, with the North being the region with more intermediate consumption on average by farm in 2012.
The levels of agricultural capital by ha pre-sent signs of correlation (more in Alentejo than in North) with the levels of investment and the investment subsidies by ha that are, also, greater in the North. The levels of invest-ment/ha in the North experimented a decreas-ing evolution until 2008 but afterwards in-creased until 2012. Those levels dein-creased drastically in Alentejo after 2003 (similar trend happens in the region for the productivities, maybe the intercalary CAP reform of 2003 had some effects) but seem to display some signs of increasing after 2008.
The competitiveness (net value added/ AWU) decreased in the Alentejo between 2001 and 2012 due to a drastic decrease in 2002 and there was a decreasing evolution in North in the same period, looking namely for the values
in the beginning and end of the period. In 2012, the North had a slightly better competi- tiveness indicator.
The technical inefficiency of factor variable (the ratio among the intermediate consumption and the agricultural production) seems to follow an increasing evolution in the two re-gions, with irregular evolutions across the pe-riod. These indicators for the technical ineffi-ciency of variable factor were built considering their relationships with the average productivi-ty in the theory of production, following, for example, the considerations of Blancard & Martin (2014) and EUROSTAT (2016). It was considered, in our work, that when average productivity increase, the technical ineffi-ciency of variable factor decreases. On aver-age, the North has more TE with lower ratios of technical inefficiency (32,78% in 2012) as opposed to Alentejo (33,48% in 2012).
The social dimension of sustainability is re-lated to the search for equality between the various social sectors, in terms of employment opportunities, access to resources and services. Equality between societies should be promo-ted, essentially, for an improvement in the quality of life (Marta-Costa et al., 2012). In this sense, for this work and according the available data, we select as social indicators (Annex I) the type of labour used in the system (AWU/ha) and salaries paid (€/AWU).
From Annex I, regarding social indicators, the data shows that North is the region with more labour per ha, which is interesting from a social perspective (not so good from an eco-nomic point of view), because it reveals more jobs in the farms. By 2012, the North had 0,23 AWU/ha in average by farm and Alentejo 0,07 AWU/ha. The salaries paid by AWU are higher in the North but with a decreasing evo-lution (3.388,09 in 2001 and 2.680,25 in 2012). In the Alentejo, salaries decreased from 2001 to 2012 with a strong decrease in 2005.
Finally, environmental indicators are those that provide information on the capacity of the proposed systems and strategies to be envi-ronmentally productive and sustainable (Mar-ta-Costa et al., 2012). We select the indicators exposed in Annex I that represent the respect of grapes production for the ecological rules and for the harmony of the economic and envi-ronmental dimensions.
From an environmental approach (Annex I), the consumption of fuel and lubricants by ha
less, a constant rate in the North between 2001 and 2012, with the North taking the lead in the majority of the period. For the fertilizers and crop protection consumption by ha between 2001 and 2012, the North presents the higher values. Both regions present, in general, a de-creasing evolution for use of fertilizers and crop protection consumption. The electricity, fuel and water/ha, from 2001 to 2012, de-creased strongly in the North and inde-creased (considering namely the values in the begin-ning and in the final of the period) in the Alentejo (with the lower values). Alentejo seems to be the most environmentally sustain-able region, which again is associated with the structural characteristics of this Portuguese zone, namely those related with the kind of agricultural activities produced here, with the climate availability of water and dimension of the farms.
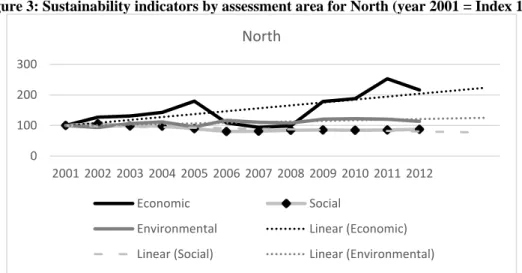
The dynamics of the selected indicators are synthesized in Figures 3 and 4 in a compara-tive way, where the year 2001 assumes the index 100. This procedure uses the contribu-tion of each indicator for the sustainability where more is better (e.g. profits) or less is preferable (e.g. crop protection). In the last case an inverse relationship is calculated. The value for each assessment sustainability di-mension was the average of all the indicators exposed in Annex I.
The analysis of Figures 3 and 4 allows two brief observations. First, there is a growing trend of economic indicators only in the North region, despite a decreasing peak between 2005 and 2008 reaching its 2001 level. In the Alentejo region the economic dimension expe-rienced a slight drop from 2001 to 2012. Se-cond, the environmental and social indicators have fewer oscillations in the North. However, in Alentejo, the social indicators show a downward tendency for the future and the en-vironmental indicators show an increasing trend (through linear tendency line).
Figure 5 shows the relation between the sustainability indicators, by assessment area, for both regions under study, where North assumes the index 100.
According to Figure 5, it becomes evident the great differences are essentially among the environmental indicators, where Alentejo has much better environmental indicators than the North. Economic indicators began to be the most disparate between the two regions, from
approximation and the dimension moved to around the 100 level (between 88 and 114).
Social indicators are generally present with greater weakness for the Alentejo region.
Figure 3: Sustainability indicators by assessment area for North (year 2001 = Index 100)
Source: Own elaboration with PTFADN (2001-2012) and INE (2002-2012) data)
Figure 4: Sustainability indicators by assessment area for Alentejo (year 2001 = Index 100)
Source: Own elaboration with PTFADN (2001-2012) and INE (2002-2012) data
Figure 5: Sustainability indicators by assessment area for Alentejo (North = Index 100)
Source: Own elaboration with PTFADN (2001-2012) data
0 100 200 300 2001 2002 2003 2004 2005 2006 2007 2008 2009 2010 2011 2012 North Economic Social
Environmental Linear (Economic)
Linear (Social) Linear (Environmental)
0 50 100 150 200 250 2001 2002 2003 2004 2005 2006 2007 2008 2009 2010 2011 2012 Alentejo Economic Social
Environmental Linear (Economic)
Linear (Social) Linear (Environmental)
334 118 224 125 114 98 96 108 113 112 88 107 288 282 225 337 417 369 354 263 459 410 225 236 2001 2002 2003 2004 2005 2006 2007 2008 2009 2010 2011 2012 Economic (Alentejo/North) Social (Alentejo/North) Environmental (Alentejo/North) North
5. CONCLUSION
This paper characterised and evaluated the Portuguese wine industry performance, con-sidering some sector statistical analysis and a few sustainability indexes from the wine farms.
In a world context, Portugal seems to have much to improve regarding the production of grapes obtained with the available harvesting area. However, Portugal seems to have gained some efficiency production in recent years; despite having lost vineyard area, it gained in wine production. Relative to Portuguese re-gions, Trás-os-Montes and Alto Douro are the most important vineyard regions in terms of vineyard area and wine production, but Alente-jo is the region with better evolution in the last years, where vineyard area increased 35% and production increased 165% from 2000 to 2015. The sustainability indicators for the North and Alentejo allow us to conclude that Alente-jo has farms with more area on average than in the North of Portugal. The North and Alentejo are very similar in economic dimensions after 2004, but the North has an increasing
tenden-cy. Relative to social indicators of sustainabi-lity, the North is more labour intensive and pays higher wages than Alentejo. Finally, rela-tively to environmental indicators of sustaina-bility, Alentejo uses fewer resources that can harm the environment, comparative to the North. So we conclude that North is more so-cially sustainable and with greater progress in the economic dimension and Alentejo is more environmentally sustainable. These results suggest that these two regions could improve these overall sustainable indicators to achieve better competitiveness.
Despite the previous conclusions, it has to be mentioned that indicators may be a tricky subject since their selection and following results always depend on the researcher’s sen-sibility upon their construction. There is also a clear lack of sustainability data on Portugal that should be taken into account in order to improve future studies and policy suggestion regarding this important industry. However, the sustainability assessment is always a good attempt for the improvement of the decision management of the farms.
REFERENCES
Alonso, A.D. (2010), “How “green” are small wineries? Western Australia's case”, British Food Journal, Vol. 112, N.º 2, pp. 155-170.
Astier, M. & Hollands, J. (Eds) (2005),
Sus-tentabilidad y Campesinato: Seis Experiencias Agroecologicas en Latinoameria, México,
GIRA A. C. and Mundi Prensa.
Binder, C. & Wiek, A. (2007), “The role of transdisciplinary processes in sustainability assessment of agricultural systems” in: Häni, F., Pintér, L. & Ferren, H. (Eds.), Proceedings
and Outputs of the First Symposium of the International Forum on Assessing Sustainabi-lity in Agriculture (INFASA), Bern
(Switzer-land), pp. 33-48.
Blackmore, K.L. & Goodwin, I.D. (2009),
Analysis of Past Trends and Future Proje-ctions of Climate Change and Their Impacts on the Hunter Valley Wine Industry, Hunter
and Central Coast Regional Environmental Management Strategy, Newcastle upon Tyne.
Blancard, S. & Martin, E. (2014), “Energy efficiency measurement in agriculture with
imprecise energy content information”, Energy
Policy, N.º 66, pp. 198-208.
Borsellino, V., Migliore, G., D’Acquisto, M., Franco, C.P. Di, Asciuto, A. & Schimmen-ti, E. (2016), “Green Wine through a Respon-sible and Efficient Production: A case of a Sustainable Sicilian Wine Producer”,
Agricul-ture and Agricultural Science Procedia, N.º 8,
pp. 186-192.
Bosco, S., Bene, C., Galli, M., Remorini, D., Massai, R. & Bonari, E. (2013), “Soil or-ganic matter accounting in the carbon footprint analysis of the wine chain”, International
Journal of Life Cycle Assessment, Vol.18, N.º
5, pp. 973-989.
Capri, E. & Pomarici. E. (2014), “Modelli di sostenibilità a confronto nel settore vitivini-colo italiano”. Il Corriere Vinivitivini-colo, N.º 9, pp. 16-17.
Christ, K.L. & Burritt, R.L. (2013), “Criti-cal environmental concerns in wine produc-tion: An integrative review”, Journal of
Clean-er Production, N.º 53, pp. 232-242.
(2016), “Sustainability in Mountain Viticul-ture. The Case of the Valle Peligna”,
Agricul-ture and Agricultural Science Procedia, N.º 8,
pp. 65-72.
Colman, T. & Päster, P. (2009), “Red, white, and ‘green’: the cost of greenhouse gas emissions in the global wine trade”, Journal of
Wine Research, Vol. 20, N.º 1, pp. 15-26.
Darnhofer, I., Fairweather, J. & Moller, H. (2010), “Assessing a farm’s sustainability: Insights from resilience thinking”,
Internatio-nal JourInternatio-nal of Agricultural Sustainability, Vol.
8, N.º 3, pp. 186-198.
Elkington, J. (1998), “Partnerships from cannibals with forks: The triple bottom line of 21st‐century business”, Environmental Quality
Management, Vol. 8, N.º 1, pp. 37-51.
Espinosa, A., Harnden, R. & Walker, J. (2008), “A complexity approach to sustainabi-lity-stafford beer revisited”, European Journal
of Operational Research, Vol. 187, N.º 2, pp.
636-651.
EUROSTAT (2016), Agri-environmental indicator – energy use. Available on http://ec.europa.eu/eurostat/statistics-explaine d/index.php/Agri-environmental_indicator_-_energy_use, accessed on 27/02/2017.
FAO (Food and Agriculture Organization of the United Nations, 1993), FESLM: An
In-ternational Framework for Evaluating Sus-tainable Land Management, World Soil
Re-sources Reports, N.º 73, Rome, FAO.
FAOSTAT (Food and Agriculture Organi-zation of the United Nations Statistics, 2017), Area harvested and Grapes Production in Crops Production, available in http://www.
fao.org/faostat/en/#home, accessed on
27/02/2017.
Flint, D.J. & Golicic, S.L. (2009), “Search-ing for competitive advantage through sustain-ability: A qualitative study in the New Zealand wine industry”, International Journal of
Physi-cal Distribution & Logistics Management, Vol.
39, N.º 10, pp. 841-860.
Flint, D.J., Golicic, S.L. & Signori, P. (2011), “Sustainability through resilience: the very essence of the wine industry”, in: 6th
AWBR International Conference, Bordeaux
Management School (France). Available in
http://academyofwinebusiness.com/wp- content/uploads/2011/09/8-AWBR2011-Flint-Golicic-Signori.pdf, accessed on 27/02/18.
Gabzdylova, B., Raffensperger, J.F. & Castka, P. (2009), “Sustainability in the New Zealand wine industry: drivers, stakeholders
and practices”, Journal of Cleaner Production, Vol. 17, N.º 11, pp. 992-998.
Gaviglio, A., Bertocchi, M. & Demartini, E. (2017), “A tool for the sustainability assess-ment of farms: selection, adaptation and use of indicators for an Italian case study”,
Re-sources, Vol. 6, N.º 4, pp. 60.
Greene, W. H. (2000), Econometric
analy-sis, Upper Saddle River, N.J, Prentice Hall.
Grimstad, S. (2011), “Developing a frame-work for examining business-driven sustaina-bility initiatives with relevance to wine tourism clusters”, International Journal of Wine
Busi-ness Research, Vol. 23, N.º 1, pp. 62-82.
Hall, C.M. & Sharples, L. (2008), Food and
wine festivals and events around the world: Development, management and markets,
Routledge.
Häni, F., Stämpfli, A., Gerber, T., Porsche, H., Thalmann, C. & Studer, C. (2007). RISE: A Tool for Improving Sustainability in Agri-culture. A Case Study with Tea Farms in Southern India, in: Häni, F., Pintér, L. & Ferren, H. (Eds.), Proceedings and Outputs of
the First Symposium of the International Fórum on Assessing Sustainability in Agricul-ture (INFASA), Bern (Switzerland), pp.
121-148.
Herrera, B., Gerster-Bentaya, M. & Knierim, A. 2016), “Stakeholders’ perceptions of sustainability measurement at farm level”,
Studies in Agricultural Economics, Vol. 118,
pp. 131-137.
Hill, C.W., Jones, G.R. & Schilling, M.A. (2014), Strategic management: theory: an
integrated approach, Cengage Learning.
Hughey, K.F., Tait, S.V. & O' Connell, M.J. (2005), “Qualitative evaluation of three ‘envi-ronmental management systems’ in the New Zealand wine industry”, Journal of Cleaner
Production, Vol. 13, N.º 12, pp. 1175-1187.
INE (Instituto Nacional de Estatística, 2002-2012), “Taxa de Variação do Índice de Preços no Consumidor”, available in http://www.ine.pt/, accessed on 22/06/2017.
IVV (Instituto do Vinho e da Vinha, 2017a), “Evolução da Área de Vinha”, availa-ble in www.ivv.min-agricultura.pt/np4/3 5/, accessed on 27/02/17.
IVV (Instituto do Vinho e da Vinha, 2017b), “Evolução da Produção Nacional de Vinho por Região Vitivinícola”, available in www.ivv.min-agricultura.pt/np4/35/, accessed on 27/02/17.
Jones, G.V. (2012), “Sustainable vineyard developments worldwide”, Bulletin de l’OIV, Vol. 85, N.º 971-972-973, pp. 49-60.
Keoleian, G. (1999), “Overview of LCA and its Application to Sustainable Agricul-ture”, in: Aistars, G. (Ed.), Proceedings of
Workshop of Life Cycle Approach to Sustaina-ble Agriculture Indicators, University of
Michigan, 7 p.
Klassen, R.D. & McLaughlin, C. P. (1996), “The impact of environmental management on firm performance”, Management science, Vol. 42, N.º 8, pp. 1199-1214.
Koohafkan, P., Altieri, M.A. & Gimenez, E.H. (2012), “Green agriculture: Foundations for biodiverse, resilient and productive agricul-tural systems”. International Journal of
Agri-cultural Sustainability, Vol. 10, N.º 1, pp.
61-75.
Marta-Costa, A.A. (2010), “Application of Decision Support Methods for Sustainable Agrarian Systems”, New Medit, Vol. IX, N.º 2, pp. 42-49.
Marta-Costa, A.A. & Silva, E. (2013). “Approaches for sustainable farming systems assessment” in: Methods and Procedures for
Building Sustainable Farming Systems,
Ne-therlands, Springer, pp. 21-29.
Marta-Costa, A., Torres-Manso, F. & Tibé-rio, L. (2012), “Sustainability diagnosis of an agroforestry system”, Regional Science Inquiry
Journal, Vol. IV, N.º 2, pp. 111-124.
Martinho, V.J.P.D. (2017), “Efficiency, to-tal factor productivity and returns to scale in a sustainable perspective: An analysis in the European Union at farm and regional level”,
Land Use Policy, N.º 68, pp. 232-245.
Masera, Ó., Astier, M. & López-Ridaura, S. (2000), Sustentabilidad y Manejo de Recursos
Naturales. El Marco de Evaluación MESMIS,
México, GIRA A.C. and Mundi-Prensa. Mencarelli, F. & De Propris, L. (2014), “Mappa dei modelli di produzione sostenibile: gli indicatori della sostenibilità del vino, in: Forum per la Sostenibilitàdel Vino (Ed.),
Pri-mo Rapporto sulla Sostenibilità del Vino, pp.
35-61, available in http://www.vinososteni bile.org/wp-content/uploads/2014/10/Primo-Ra
pporto-Sostenibilita-del-Vino-Ottobre-2014.pdf, accessed on 19/01/2015.
Misso, R. & Borrelli, I.P. (2013), “Wine system e identità territorial”, Economia &
Di-ritto Agroalimentare, N.º 18, pp. 97-113.
OECD (Organisation for Economic Co-operation and Development, 2002), “Adoption
of technologies for sustainable farming sys-tems”, Wageningen Workshop Proceedings, available in http://www.oecd.org/greengrowth/ sustainable-agriculture/2739771.pdf, accessed on 25/01/2017.
Ohmart, C. (2008), “Innovative outreach increases adoption of sustainable winegrowing practices in Lodi region”, California
agricul-ture, Vol. 62, N.º 4, pp. 142-147.
OIV (International Organisation of Vine and Wine, 2016), “OIV Statistical Report on World Vitiviniculture: World Vitiviniculture Situation”, available in http://www.oiv.int/pub lic/medias/5029/world-vitiviniculture-situation -2016.pdf, accessed on 28/01/2016.
Olde, E.M., Oudshoorn, F.W., Sørensen, C.A., Bokkers, E.A., & De Boer, I.J. (2016), “Assessing sustainability at farm-level: Les-sons learned from a comparison of tools in practice”, Ecological Indicators, N.º 66, pp. 391-404.
Pervanchon, F. (2007), “When farmers in-tegrate sustainable development in their strate-gy thank a tree: the sustainable farm tree” in: Häni, F., Pintér, L. & Ferren, H. (Eds.),
Pro-ceedings and Outputs of the First Symposium of the International Forum on Assessing Sus-tainability in Agriculture (INFASA), Bern
(Switzerland), pp. 111-120.
Petronilho, S., Barros, A.S., Coimbra, M.A., & Rocha, S.M. (2013), “Efficient use of non-renewable natural resources for quality wine through sustainable viticulture” in: Raza, A. (Ed.), Agricultural Systems in the 21st Cen-tury, Nova Science Publishers, Inc., pp.
195-230.
Porter, M.E. & Kramer, M.R. (2007), “Strategy and society: The link between com-petitive advantage and corporate social respon-sibility”, Harvard Business Review, Vol. 85, N.º 6, pp. 136-137.
PTFADN (The Portuguese Farm Account-ancy Data Network, 2001-2012), “Resultados médios por exploração”, available in http://www.gpp.pt/index.php/rica/rede-de-informacao-de-contabilidades-agricolas-rica, accessed on 23/03/2017.
Rezaei-Moghaddam, K. & Karami, E. (2008), “A multiple criteria evaluation of sus-tainable agricultural development models using AHP”, Environment, Development and
Sus-tainability, Vol. 10, N.º 4, pp. 407-426.
Robinson J. (2004), “Squaring the circle? Some thoughts on the idea of sustainable
de-velopment”, Ecological Economics,Vol. 48, N.º 4, pp. 369-384.
Russo, M.V. & Fouts, P.A. (1997), “A re-source-based perspective on corporate envi-ronmental performance and profitability”,
Academy of management Journal, Vol. 40, N.º
3, pp. 534-559.
Saltiel, J., Bauder, J.W. & Palakovich, S. (1994), “Adoption of sustainable agricultural practices: Diffusion, farm structure, and profit-ability”, Rural Sociology, Vol. 59, N.º 2, pp. 333-349.
Santiago-Brown, I., Jerram, C., Metcalfe, A. & Collins, C. (2014), “What does sustaina-bility mean? Knowledge gleaned from apply-ing mixed methods research to wine grape growing”, Journal of Mixed Methods
Re-search, Vol. 11, N.º 3, pp. 232-251.
Santini, C., Cavicchi, A. & Casini, L. (2013), “Sustainability in the wine industry: key questions and research trends”,
Agricul-tural and Food Economics, Vol. 1, N.º 1, pp.
1-14.
Silverman, M., Marshall, R.S. & Cordano, M. (2005), “The greening of the California wine industry: Implications for regulators and industry associations”, Journal of Wine
Re-search, Vol. 16, N.º 2, pp. 151-169.
Sinha, P. & Akoorie, M.E. (2010), “Sus-tainable environmental practices in the New Zealand wine industry: An analysis of per-ceived institutional pressures and the role of exports”, Journal of Asia-Pacific Business, Vol. 11, N.º 1, pp. 50-74.
Smith, C.S. & McDonald, G.T. (1998), “Assessing the sustainability of agriculture at the planning stage”, Journal of Environmental
Management, Vol. 52, N.º 1, pp. 15-37.
Van Cauwenbergh, N., Biala, K., Bielders, C., Brouckaert, V., Franchois, L., Cidad, V., Hermy, M., Mathijs, E., Muys, B., Reijnders, J., Sauvenier, X., Valckx, J., Vanclooster, M., Van Der Veken, B., Wauters, E. & Peeters, A. (2007), “SAFE – A Hierarchical Framework
for Assessing the Sustainability of Agricultural Systems”, Agriculture, Ecosystems and
Envi-ronment, N.º 120, pp. 229-242.
Viassone, M., Vrontis, D. & Papasolomou, I. (2016), “The relationship between wine sec-tor and regional competitiveness”, Global
Business and Economics Review, Vol. 18, N.º
3-4, pp. 259-276.
Vilain, L. (2008), La Méthode IDEA.
Indi-cateurs de Durabilité des Exploitations Agri-coles: Guide d'Utilisation, Dijon, Educagri
éditions.
Von Wirén-Lehr, S. (2001), “Sustainability in agriculture - an evaluation of principal goal-oriented concepts to close the gap between theory and practice”, Agriculture, Ecosystems
& Environment, Vol. 84, N.º 2, pp. 115-129.
Wiek, A. & Binder, C. (2005), “Solution spaces for decision-making – a sustainability assessment tool for city-regions”,
Environmen-tal Impact Assessment Review, N.º 25, pp.
589-608.
Woodruff, R.B. (1997), “Customer value: the next source for competitive advantage”,
Journal of the Academy of Marketing Science,
Vol. 25, N.º 2, pp. 139-153.
Xavier, A, Freitas, M., Fragoso, R. & Rosá-rio, M. (2017), “Uma Abordagem Baseada na Programação Por Metas Para a Gestão de Sis-temas Agroflorestais Com Múltiplos Stakehol-ders”, Revista Portuguesa de Estudos
Regio-nais, N.º 46, pp. 57-70.
Zanoli, R., (2007), “Quale futuro per l’agricoltura sostenibile?” Rivista di Economia
Agraria N.º 62, pp. 371-382.
Zucca, G., Smith, D.E. & Mitry, D.J. (2009), “Sustainable viticulture and winery practices in California: what is it, and do cus-tomers care?” International Journal of Wine
63
ANNEX A - Economic, Social and Environmental Indicators for the Wine Farms over the North (N) and Alentejo (A) Regions (2001-2012)
Indicators 2001 2002 2003 2004 2005 2006 2007 2008 2009 2010 2011 2012 \ECON O M IC N
Utilized agricultural area (ha) 7,86 7,83 7,77 8,22 7,7 8,31 7,86 7,64 8,09 8,56 8,72 8,23 Gross margin (€/ha) 2983,67 2337,68 2049,38 2128,36 2095,12 1906,40 1822,77 1838,99 2195,41 2300,89 2339,28 2161,58 Agricultural production (€/ha) 4014,87 3304,63 2744,40 2778,95 2697,63 2564,31 2450,79 2349,89 2778,49 2942,63 2891,27 2619,07 Current subsidies (€/ha) 141,39 160,24 174,43 214,79 250,06 225,06 182,70 226,49 333,98 286,84 332,12 498,18 Intermediate consumption (€/ha) 979,32 1041,73 737,26 726,33 803,58 786,06 734,96 630,58 791,66 817,91 778,56 858,64 Agricultural Capital (€/ha) 10896,11 10769,39 10239,29 9749,14 11814,85 11465,21 10736,68 9576,79 10142,56 10045,49 12661,26 13227,51 Investment (€/ha) 744,31 710,16 570,47 488,93 495,15 672,63 284,15 192,13 595,24 627,33 528,08 703,58 Investment subsidies (€/ha) 17,27 81,13 85,60 100,50 162,21 37,40 29,27 30,48 145,78 163,04 266,40 188,15 Competitiveness indicator 10848,9 6925,40 6564,00 7185,63 7089,66 8261,14 7539,03 7881,02 8293,84 9442,80 9280,27 7898,06 Technical inefficiency (%) 24,39 31,52 26,86 26,14 29,79 30,65 29,99 26,83 28,49 27,80 26,93 32,78
A
Utilized agricultural area (ha) 29,45 30,19 24,16 25,04 26,14 22,6 24,43 20,84 26,55 24,01 20,48 19,92 Gross margin (€/ha) 3385,88 1792,41 4236,83 2661,99 792,76 828,12 768,75 1307,96 1021,08 957,88 1038,02 801,51 Agricultural production (€/ha) 3869,64 3330,83 5325,81 3290,26 809,30 875,32 952,66 1396,79 1104,70 926,70 1078,07 678,79 Current subsidies (€/ha) 154,2 98,80 95,74 96,25 48,59 90,04 62,47 168,82 111,08 158,04 254,61 274,30 Intermediate consumption (€/ha) 712,87 1637,08 1644,13 631,31 197,40 270,35 305,55 444,73 237,94 218,17 429,93 227,28 Agricultural Capital (€/ha) 5904,31 5522,60 6961,25 6195,99 3496,84 3576,46 5562,68 6237,32 4756,39 3687,21 7281,74 4419,23 Investment (€/ha) 986,14 622,36 1477,90 116,25 122,25 43,26 218,84 68,23 91,70 147,76 260,83 252,67 Investment subsidies (€/ha) 306,97 60,83 561,12 14,59 0 22,61 0 22,76 14,53 81,59 146,04 117,76 Competitiveness indicator 45104,15 14489,94 23790,82 21601,00 9537,02 8370,85 5709,09 16139,25 12237,76 10159,73 7034,36 7804,43 Technical inefficiency (%) 18,42 49,15 30,87 19,19 24,39 30,89 32,07 31,84 21,54 23,54 39,88 33,48
SO
CIAL
N Labour (AWU/ha) Salaries paid (€/AWU) 0,24 0,27 0,25 0,24 0,21 0,17 0,18 0,18 0,22 0,21 0,21 0,23 3388,09 3344,31 3126,68 3231,18 3096,31 3040,07 2958,58 3179,55 2670,68 2761,39 2810,09 2680,25 A Labour (AWU/ha) Salaries paid (€/AWU) 0,06 0,1 0,12 0,1 0,04 0,05 0,06 0,05 0,06 0,07 0,09 0,07
2799,54 3052,15 3452,76 3814,02 182,48 304,85 1832,77 1630,50 1812,22 396,43 1399,13 496,20 ENVI RO NM EN TAL N
Fuel and lubricant (€/ha) 76,95 84,05 69,00 71,13 99,019 71,63 70,42 81,66 58,10 72,14 77,90 77,29 Fertilizers (€/ha) 61,33 81,53 71,47 57,01 59,03 51,63 56,14 71,11 55,72 65,16 63,09 58,86 Crop protection (€/ha) 142,88 143,86 131,62 112,29 116,38 116,12 146,83 160,40 149,67 129,83 135,37 130,24 Electricity, fuel and water (€/ha) 24,37 22,72 20,19 23,72 31,40 20,54 19,32 15,05 16,88 13,72 13,55 17,26 A
Fuel and lubricant (€/ha) 49,96 46,10 53,05 43,66 40,24 42,98 46,05 69,97 49,23 64,15 110,70 57,76 Fertilizers (€/ha) 35,82 69,39 22,99 12,56 10,40 14,06 23,56 11,31 20,50 22,20 16,35 26,75 Crop protection (€/ha) 92,36 66,27 105,24 34,72 27,68 39,99 64,14 96,08 46,63 53,25 112,73 48,60 Electricity, fuel and water (€/ha) 3,62 3,71 6,07 5,82 7,27 3,16 2,43 10,94 1,50 1,38 4,21 5,36
Source of data: PTFADN (2001-2012)
Observation: All data in monetary terms was deflated using the prices index calculated with INE (2002-2012) data, with 2001 settled as the reference year.
Su stainab ility Ev ol ut ion of Nort h and Al entejo Vin eyard Regi on s