Master Thesis
“The impact of the emission scandal of Volkswagen on its
credit rating”
Student: Christoph Komischke
Student number: 24976
Professor: Miguel Ferreira
Table of Contents I. TABLE OF FIGURES 3 II. TABLE OF TABLES 3 III. ABSTRACT 3 IV. EXECUTIVE SUMMARY 4 1. INTRODUCTION 5 2. VOLKSWAGEN GROUP 6 3. THE S&P RATING METHODOLOGY 6 3.1 BUSINESS RISK 6 3.1.1 INDUSTRY RISK 7 3.1.2 COUNTRY RISK 10 3.1.3 COMPETITIVE POSITION 13 3.2 FINANCIAL RISK 15 3.2.1 CASH FLOW 16
3.2.2 CAPITAL STRUCTURE AND LEVERAGE 17
3.2.3 LIQUIDITY 18
3.3 OTHER FACTORS 18
3.3.1 INVESTORS 18
3.3.2 DIVERSIFICATION 19
3.3.3 CORPORATE GOVERNANCE 19
3.4 THE FINAL RATING 20
4. ALTMAN Z-SCORE MODEL 21 5. DISTANT TO DEFAULT MODEL 22 6. ANALYSIS OF THE IMPACT ON THE RATING 23 6.1 EMISSION SCANDAL 23 6.2 THE IMPACT 24 7. CONCLUSION 26 V. APPENDIX 28 VI. SOURCES 29 VII. DISCLAIMER 30
I.
Table of Figures
FIGURE 1: GLOBAL CAR SALES FORECASTS BY REGION 7
FIGURE 2: MARKET PERFORMANCE COMPARED TO THE AUTOMOTIVE INDUSTRY 9
FIGURE 3: EBITD COVERAGE OF VW 16
FIGURE 3FFO/DEBT RATIO OF VW 16
FIGURE 5: DEBT/EBITDA RATIO OF VOLKSWAGEN 17
FIGURE 6: S&P'S CREDIT RATING MATRIX 26
II.
Table of Tables
TABLE 1: REVENUES AND EBITDA MARGIN DURING RECESSIONS 9
TABLE 2: CAR SALES BY REGION 10
TABLE 3: GROSS MARGIN AND OPERATING MARGIN OF THE CAR INDUSTRY 15
TABLE 4: ROE AND ROA OF THE CAR INDUSTRY 15
TABLE 5: EBITDA COVERAGE AND FFO/DEBT OF THE INDUSTRY 16
TABLE 6: DEBT/EBITDA RATIO AND DEBT/TOTAL CAP RATIO OF THE INDUSTRY 17
TABLE 7: VOLKSWAGEN'S RESULTS OF Z-SCORE 21
TABLE 8: Z-SCORE AND PD OF DD CONVERSION TABLE 22
TABLE 9: RESULTS OF THE NAIVE DD 23 TABLE 10: RESULTS OF AN ALTERNATIVE SCENARIO WITHOUT THE SCANDAL 25
III. Abstract
Credit ratings are used to assess the probability of default of a company. There are different approaches using a quantitative, qualitative or a hybrid method for evaluating the creditworthiness. In this thesis, the impact of the emission scandal of Volkswagen on the credit rating will be determined. Therefore, three approaches will be conducted, namely the S&P rating, which is a hybrid method, as well as the two quantitative concepts Z-Score and Distant to Default, will be conducted. The results will be compared with each other before as well as after the emission scandal.IV. Executive summary
• Volkswagen is the second biggest car manufacturer in the world with the main markets being Europe (45%) and Asia (40%) • Those markets all have a solid rating • Volkswagen is a conglomerate of 11 different brands with the most important ones being Volkswagen Passenger Cars (50% of sales), Audi AG (27% of sales) and Porsche (10% of sales) • Porsche is the best unit of Volkswagen in regards of efficiency followed by Audi and Volkswagen Passenger Cars • The business risk of Volkswagen can be classified as satisfactory due to the high cyclicality of the industry • The financial risk is modest, however, the negative impact of the scandal lowers the FFO/Debt ratio and Debt/EBITDA ratio • The overall rating with the method of S&P is BBB • Using the Z-Score, the rating of Volkswagen is B. This is due to the low EBIT, which decreased tremendously in year 2015 • The DD model rates the company BB. Main differences to the previous year are the higher volatility and the lower return on equity, which is both caused by the crisis • All three methods downgrade Volkswagen from year 2014 to 2015. However, it can be assumed that this is only temporary since the sales and revenue already recovered from the impact of the scandal S&P Model Z-Score DD Year 2014 2015 2014 2015 2014 2015 Rating AAA BBB+ BB B A BB1. Introduction
The following master thesis will analyze the impact on the credit rating due to the emission scandal of The Volkswagen Group starting at the end of 2015. This is done by conducting three independent credit ratings. The main credit rating of this thesis is the model of Standard & Poor. Please note, that this credit rating is not exhaustive. Only entities that contribute more than 10% to the revenues will be analyzed, leaving the brand Volkswagen, Audi and Porsche. Furthermore, Volkswagen Financial Services will be excluded from this rating, since it interacts in the financial sector, thus would need a separate industry analysis, which would go beyond the scope of this thesis (cf. S&P, 2016).
The rating consists of two main parts, the business on one side and on the other the financial analysis. The business part will be conducted for each of the three entities, namely Volkswagen (49,8% of the revenues), Audi (27,4%) and Porsche (10,1%) and is divided into industry risk, country risk and competitive position. Note, that many aspects are mentioned in one paragraph, however the rating is conducted individually for each unit. After determining the results, the weighted average will be formed, which will reflect the business rating for the entire group. The second part of the analysis will focus on the financial aspects. Instead of doing the research for each entity, the entire group will be analyzed, due to the fact the weighted average of each individual unit would yield the same results as the holistic concept. However, since the penalty fees and provisions concern the entirety of the company, the holistic approach is more suited. (cf. S&P, 2016 and cf. Volkswagen, 2015)
The combination of the two analyses will result in an overall rating of the company, which will be further adapted depending on various aspects such as corporate governance or the investment structure. (cf. S&P, 2016)
The other two ratings included in this paper are the Z-score and the Distant to Default, which are both quantitative methods and only focus on the results from the financial statement.
Lastly the impact of the emission scandal will be analyzed, therefore we compare the status quo with a potential situation minus the negative impact of the scandal such as fines or reputational loss and consequently decline in sales. (cf. Moody’s, 2006)
Please note that in order to analyze the capital structure in all approaches, the entity Volkswagen financial services’ balance sheet is adjusted since it is a financial institution, thus would dilute the overall results negatively. (cf. S&P, 2016)
Also, since every method uses different input, the final ratings can differ from each other
2. Volkswagen Group
Volkswagen is a German multinational car manufacturer. The company was founded 1937 in Wolfsburg where the headquarter is located. It is the second biggest in its sector after Toyota and is ranked 7th in the 2016 Fortune Global 500 of the world’s largest companies. (cf. Volkswagen, 2015 and cf. Fortune. 2016 and cf. Tharawat magazine. 2016)
Over the years VW bought seven other car manufacturers such as Audi or Porsche, which belong to the passenger car division. The other part of the auto motive division consists of MAN, Scania and Neoplan and VW Commercial Vehicles. The other sector VW collaborates in is the financial services (cf. Volkswagen, 2015).
In total, the company operates in more than 150 countries with over 100 different facilities that are spread over 25 different countries (cf. Volkswagen, 2016).
3. The S&P rating methodology
The first rating will be conducted using the approach from S&P. Hence, the business risk will be assessed initially (S&P, 2016).
3.1 Business Risk
A company’s business risk is assessed by analyzing the three components industry risk, country risk and competitive position (S&P, 2016).
3.1.1 Industry Risk
VW operates in two different areas, with one being the car industry and the other one the financial service area. The latter one will not be part if this inquiry as mentioned before (cf. Volkswagen, 2015).
The automotive industry faces only little risk regarding new competitors. This is caused by high entry barriers. The fact that the automotive industry requires a huge amount of initial investments for production facilities as well as the technology complicates entering this market. (cf. Nieuwenhuis, 2003, pp. 232) Furthermore, the advancing consolidation of the market created strong brands such as Toyota, Volkswagen or General Motors that dominate the industry (cf. Clarke, 2006, p 52). Especially for durable goods, such as cars, it is crucial to have a strong brand in order to generate profit, making it even harder for start-ups to succeed. Another upside of the industry is the continuing growth trend of the past years. The automotive industry is in a very stable phase with sales, as of now, of more than 80 million a year. These numbers will grow continue to grow. However, it is predicted that the percentage of electronic and hybrid cars will increase over the next years. By 2040 almost 120 million cars will be sold, of which are 35% non-fossil fueled (cf. Bloomberg,
2016).
Especially in Asian the demand for cars will increase, whereas Europe and North America will have small a incremental upward trend, as shown in figure 1 (cf. Nikkei, 2013). Thus, it will be crucial to adapt to
the market and possibly undergo alliances with local providers to raise market share and brand awareness. (cf. Nikkei, 2013)
Aspects such as the power of supplier however, became less favorable for the car manufacturer over the past years. This is due to the shift of roles of the manufacturer. More and more parts are not produced in-house anymore but rather outsourced to specialized suppliers and merely assembled by the manufactures. Hence, most of the value creation is done by the suppliers, which establishes a high dependency and potential conflicts when it comes to negotiation. One of these conflicts mounted in August 2016 when VW had to pause the production due to a shortage in supplies form the Bosnian company Prevent. The discontinuity of production caused a damage of roughly 100 million euros and a reputational damage that cannot be quantified (cf. Spiegel, 2016).
Additionally, the increasing regulations regarding the emission of 𝐶𝑂# elevated the pressure on the profit margin, since it is difficult to pass on the extra costs to the customer. As an example, the European union, as an example, agreed, fueled by the emission scandal of Volkswagen, to further reduce the 𝐶𝑂# emission by additional 25% to 95g/km by the end of 2020 (cf. European
Commission, 2013).
Furthermore, the possibilities of substitutes can put a moderate tension on the industry. Over the decades, people became more and more reliant on cars. Only the peeking oil prices in 2008 indicated a future shift to alternatives such as public transportation. However, after the financial crisis in the US and later Europe, the prices for a barrel of oil plummeted and has only recovered slightly. This trend got emphasized by the booming fracking industry in the US which will continue under the future government of the newly elected President Donald Trump who favors fossil fuels. Rather than switching to public transportation, the industry trend will go towards hybrid or electric cars whose technology will advance in the upcoming years. Now however, since the pressure of the increasing oil prices is minor in the short run, costumers favor combustion cars again. Eventually the trend to alternative solutions can only be postponed. This means that rather than having a thread of substitutes, companies need to invest in new
technologies to be able to establish a profitable alternative to the combustion engines (cf. Bloomberg, 2016).
An important aspect of the business risk is the cyclicality, which describes the fluctuation of income, value, or earnings of a company in correlation to the overall economy. It measures how big the company’s sales decline during a recession. For investors, this is crucial since fix costs need to be covered continuously (cf. Investopedia, 2016).
A first indicator for the cyclicality is the beta of a company. Cyclical industries or companies have a beta above 1 which is the case
for the main car manufacturer such as VW (1,5) or GM (1,4). Only Toyota has a beta below 1 with merely 0,7. Though this can reflect the cyclicality at a certain point of time, the entire horizon needs to be analyzed as well.
This can be done by comparing a proxy, such as S&P 500 (green) with the performance of the industry average (yellow) as shown in figure 2(cf. Financial Times, 2016)(cf. Yahoo finance, 2016).
The third assessment for the degree of cyclicality is observing the revenue and EBITDA margin during recessions. Historical data of various automotive companies indicates that during a recession the revenues and the EBITDA margin declines on average
by -16,5% and 38% respectively, as shown in table 1(cf. S&P, 2016) These values imply a big risk for the industry and could lead to financial distress for companies that already have a high leverage ratio. (cf. S&P, 2016).
Period Revenue EBITDA margin 1952-1955 -10,3% -18,1% 1956-1958 -24% -22,8% 1959-1962 -5,8% -4,6% 1968-1971 -16,9% -34,1% 1972-1975 -15,7% -49,5% 1979-1982 -30% -79,5% 1989-1992 -8,2% -39,9% 2000-2002 -6,9% -27,9% 2007-2009 -30,7% -65,4% Average -16,5% -38% Table 1: Revenues and EBITDA margin during recessions Figure 2: Market performance compared to the automotive industry
3.1.2 Country Risk
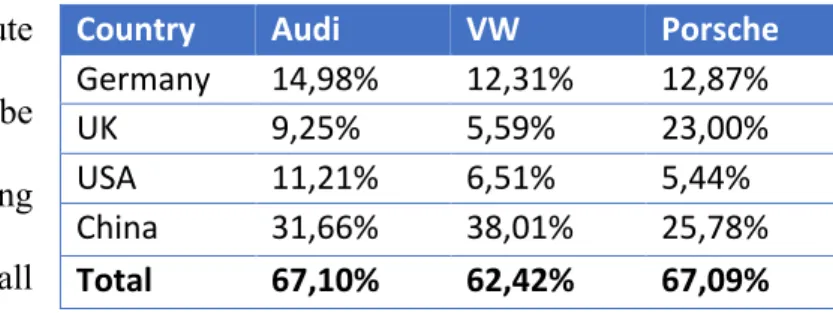
For this analysis countries that contribute more than 5% of the total sales will be analyzed. The three car-producing entities, VW, Audi and Porsche, all operate on the same main markets,
namely China, Germany, UK and USA, in which they generate more than 60% of their revenues, as shown in table 2 (cf. Volkswagen, 2015) Especially China plays an increasingly important role in sales.
The countries will be analyzed in the five aspects political risk, business risk, economic risk, financial risk and monetary risk. (Volkswagen, 2015)
Germany
Germany, which is the home market of all three entities, proves to have a stable economy with a small but steady GDP growth of 1,7 in 2015. The country recovered from its latest recession in 2013 during which the GDP shrank by 0,3% in 2013 due to the euro crisis. The tendency is supposed to continue with a growth rate well above 1% for the next 3 years. In combination with the solid fiscal policy, the debt/GDP ratio keeps decreasing continuously to 72% after having reached 81% in 2010. Also, the rule of law as well as the payment culture are favorable for businesses (cf. Statistisches Bundesamt, 2016).
Germany has one of the most efficient government, which is partly due to the minimal corruption. However, the country is highly reliant on the euro zone which has reduced the monetary flexibility. Additionally, the euro zone is facing political conflicts with Turkey and Ukraine and has to handle political instabilities like in Italy and the UK. These occurrences could burden Germany with additional costs in the future (cf. the Global Economy, 2016 and cf. Congressional Research Service, 2016)
Country Audi VW Porsche
Germany 14,98% 12,31% 12,87% UK 9,25% 5,59% 23,00% USA 11,21% 6,51% 5,44% China 31,66% 38,01% 25,78% Total 67,10% 62,42% 67,09% Table 2: Car sales by region
UK
The UK has a solid economy which is backed up by a strong financial sector. The GDP growth ranges between 1,3% and 2,2% over the past 6 years and is predicted to stay above 1% for the next three years. However, the debt burden of the country increased steadily from 75,7% in 2010 to 88,9% in 2015. It is forecasted that the trend will continue in a slower manner and reach 91% in 2019. Thus, the interest burden will increase as well even though the rates are very low as of now. The export structure is diversified and the country has proven to have an efficient government with a low ranking of corruption. However, after the referendum for the Brexit, the political situation has become less stable. This is due to the uncertainty in regards of the trading agreements with the EU. This could have a heavy impact on banking sector. In case the pass porting, which allows banks located in the UK to operate in the European union, is not father granted, they would need to relocate in order to continue operating in the European Union. This uncertainty correlates with devaluation of the pound, which will improve the export for a short term. Depending on the contract with the EU however, there might be some tall charges that could impede the trade and nullify this trend.
The Brexit also bears the upside if giving the UK more political and financial freedom. This reflects positively on the monetary risk. As shown in the European credit crisis, the UK adjusted exchange ratios, giving the country more stability by providing a more competitive environment.
USA
The United states has the world’s largest economy with a high GDP per capita. It is forecast, that the economy will keep growing by more than 2% over the next years. The country is rich in resources such as oil and gas, which will gain in importance in the near future. Additionally, the country is politically stable, even though the impact of the election of Donald Trump as a president cannot be completely foreseen. However, it is predicted, that the emphasis of his agenda will be the strengthening of the domestic economy. This bares a certain risk, since the national debt is already above 90% of the GDP and might increase in the short run due to some
investments and the planned reduction in taxes. Additionally, the interest rates will eventually increase, hence the interest burden will continue to rise. It is estimated that 9,2% of the revenues will be used to cover the interest payments. Furthermore, there is a lack of skilled workers and a broad labor force, which is one of the reasons for the structural unemployment (cf. World Bank, 2016 and cf. S&P, 2016).
The governmental corruption is very low and together with the high ranking in rule of law it provides a good environment for businesses (cf. Global Economist, 2016).
China
China is the riskiest out of the four markets in which the three entities operate. Even though it has a huge domestic market, due to its population over 1,4 bn. with a continuing high GDP growth rate of 6%, it is facing several problems. The GDP growth has been decreasing faster than predicted. Over the past years the growth rate fell by 380 bp. to 6,9%. However it is predicted to go futher down but not below the mark of 6%. In order to counter react, the Chinese government loosened the monetary policy, which led to an excessive corporate debt of 171% of the GDP. Nevertheless, the monetary policy is considered credible since China has maintained a steady inflation rate between 1% and 3%. The national debt/GDP is stable at 45% and is predicted to only fluctuate around this value. (cf. World Bank, 2016 and cf. S&P, 2016)
Corruption and governmental inefficiency are quiet high, which makes the market less attractive for business (cf. Global Economy, 2016).
Due to the excessive expansion, the environment has suffered tremendously, which not only has an impact on the economy, but also raises concern among the citizens. Furthermore, China is facing increased geopolitical tension e.g. with Japan, which creates uncertainty and further lowers the attractiveness for business. (cf. Euler Hermes, 2016).
3.1.3 Competitive position
The competitive position of the analysis focuses on the comparison between each entity and other car manufactures. Various points need to be considered such as the brand, profitability, the scope or the diversification. (cf. S&P, 2016)
The Brand and Positioning
Audi is the most valuable brand in the VW conglomerate with a brand value of 9,5 bn. However, this only grants the company from Ingolstadt rank #7. Toyota is ranked #1 with more than three times the value. The target group of Audi is the premium sector, which is the same target group as BMW or Mercedes. However, these two brands are ranked #2 and #3 respectively. (cf. Statista, 2016)
Porsche also aims to be leader in quality but in this case in the higher price segment. Over the years Porsche has become the second strongest brand in the Volkswagen AG which can be observed by the high brand value of 4,44 bn. (cf. Statista, 2016)
VW also aims to build a strong brand by emphasizing the quality of German engineering and expand greatly in the emerging markets such as China, which by now is its biggest market. VW is one of the most successful brands in the Asia, which gives the company a competitive advantage. Furthermore, VW advertises itself as “The people’s car”. Thus, it aims for the middle class. However, the reputation has suffered a lot during the emission scandal that started at the end of 2015. VW also loses competitive edge due to the lack of switching costs to other brands. Combined with the fact that is not listed in the higher ranks of the most valuable car brands indicates a weaker position on the market than the other two entities (cf. Volkswagen, 2016).
Scale, Scope and Diversity
The VW group is the second largest global car producer with 13,5% market share. This gives each entity the possibility to use economy of scale. The large amount of sales is reached by penetrating the global market. However, the VW group attempted to further penetrate the
American market with the diesel engine which failed due to the strict regulations of emissions. This affects VW as well as Audi since these two entities are involved in the scandal. (cf. Tharawat magazine, 2016 and cf. Volkswagen 2016)
Not only does VW diversify in regards of geography but also in terms of products. VW offers a big variety of cars starting with VW-Up which is suited for single households, to Sharan, which is considered a family car. In total VW offers more than 30 different models (cf. Volkswagen, 2016).
The customer base is also very diverse, since the smaller models are aimed for the lower and middle income class. The upper income segment is targeted partially with the Phaeton model. Porsche only has a limited range of products, namely sports cars and SUVs and only has a small degree of diversification (cf. Porsche AG, 2016).
Audi is similar in its product portfolio as VW and offers cars ranging from smaller over family cars to SUVs (cf. Audi AG, 2016).
Operating Efficiency
Operating efficiency is crucial to increase the company’s profit. Especially in an industry that relies heavily on constant supplies such as the automotive industry. One parameter is the cash conversion cycle (CCC), which measures the number of days that are required to convert resources or inpute into cash. The fewer the days that are needed the more efficient is the entire process is set up. Porsche managed to optimize the CCC to the fullest meaning there are no days required to convert the input into cash. This is followed by Audi with 24 days and Volkswagen with 34 days. The major players in the industry have lower rates e.g. Toyota 102 days and Ford 171 days (cf. Erhard, 2009, p 550 and cf. Gurufocus, 2016).
Other metrics to assess the efficiency margins with one being the gross margin, which is reflects how much the costs of goods sold (COGS) take up of the revenue. The second important metric is the Net profit margin that shows how much profit is left after all the expenses have been paid.
operating margin. Audi even though a bit behind Porsche has the second highest margins with 19% and 7%. Volkswagen on the other hand is well below all the competitors with net operating margin of merely 4,9% (see table 3) (cf. Volkswagen 2015 and cf. Audi
AG, 2016 and cf. Porsche AG, 2016 and cf. Toyota AG, 2016 and cf. General Motors, 2016 and cf. Investopedia, 2016).
Other metrics that should be taken into consideration when analyzing the operating efficiency are the Return on Equity (ROE) and the Return on Assets (EOA). These values reflect on the amount of profit generated compared to the amount of equity or t otal assets that are invested in the company. As
shown in the table VW has the lowest ROE with 9,18%, followed by Porsche with 10,32% and Audi with 13,88% all three far behind GM, who seems to use the equity most efficient. In general, a ROE between 15% and 20% is desired but cannot be reached by neither of the companies of the Volkswagen Group. The Return on Assets on the other hand is dominated by Porsche with 10,96% followed by Audi with 9,21%. Volkswagen is in the lower segment with merely 3,34% (see table 4)(cf. Volkswagen 2015 and cf. Audi AG, 2016 and cf. Porsche AG, 2016 and cf. Toyota AG, 2016 and cf. General Motors, 2016 and cf. Investopedia, 2016).
3.2 Financial Risk
After having assessed the business risk for the three entities, Audi, Porsche and Volkswagen Passenger cars, the financial aspects will now be analyzed (cf. S&P, 2016).
Due to the cyclicality and possibilities of bigger events such as merges and acquisition, it is crucial to analyze not just a single point in time but rather a longer period. Therefore, the analysis
Company Gross m. Operating m.
Audi 19% 7% GM 13,12% 6,38% Porsche 28% 15,50% Toyota 18,64% 5,40% VW 14,40% 4,91% Table 3: Gross margin and Operating margin of the car industry
Company ROE ROA
Audi 12,29% 9,21% GM 13,88% 3,78% Porsche 9,18% 10,96% Toyota 24,37% 3,18% Volkswagen 10,32% 3,34% Average 14,01% 6,09% Table 4: ROE and ROA of the car industry
will be conducted using a five-year horizon combined out of the previous two years, the current year and the forecasts of the upcoming next two years. This will guarantee that an entire business cycle is covered and the distortion is minimized (cf. S&P, 2016).
As of now Volkswagen has accumulated assets worth € 381,939mln. These assets are financed by € 83,270mln. equity, € 145,175mln. noncurrent liabilities and € 148,489mln. current liabilities. However, these numbers include the debt of Volkswagen Financial Services. Since this entity is operating in the banking sector, we need to adjust the debt of the company to not bias the values for further analyses. (cf. Volkswagen, 2015 and cf. S&P, 2016).
3.2.1 Cash flow
One key figure for the analysis of the cash flow is the FFO/Debt ratio. This ratio defines how well a company is able to repay its debts based on the fund from operations (FFO) (cf. S&P, 2016). In case of Volkswagen, it is noticeable that due to the emission scandal the values dropped rapidly in 2015 and will have reached the former state only by year 2018 (figure 3 cf. Volkswagen 2015). However, the five-year average of the company is 48% and indicates that the company is generating enough profit to repay the debt over time.
When compared to its main competitors it is perceptible that the Volkswagen group has the most solid values that are more than 20% above the average.
Company EBITDA/ Interest FFO/Debt GM 39,63 0,40 Toyota 103,54 0,13 VW 11,22 0,53 Average 51,46 0,33 Table 5: EBITDA coverage and FFO/Debt of the Industry 0 0,2 0,4 0,6 0,8 2014 2015 2016 2017 2018 FFO/Debt Figure 4FFO/Debt ratio of VW 0 5 10 15 2014 2015 2016 2017 2018 EBITA Coverage Figure 3: EBITD Coverage of VW
A second measurement to evaluate the cash flow of the company is the EBITDA coverage, which indicates how often the interest of the debt can be repaid by the EBITDA of the company. Volkswagen is a very solvent company and could repay the interest expenses on average 11 times as shown in table 5 (cf. Volkswagen, 2015 and cf. Toyota, 2016 and cf. GM, 2016) This is a positive result for Volkswagen and its investors since it is able to cover up the interests more than enough, however, when looking at the industry Volkswagen is in the lower segment. The industry average is factor 52 which is almost four times as much.
3.2.2 Capital Structure and Leverage
To evaluate a company, it is crucial to assess the capital structure and how much it is levered, meaning what is the ratio between equity and debt. A company that has a high positive cash flow can lever itself higher. Over the past years Volkswagen has maintained a stable debt/EBITDA ratio of 1,8
which can be considered modest. However, during the year 2015 the value peaked putting the company in an unfavorable position. (figure 5 cf. Volkswagen, 2015).
Volkswagen can be considered mediocre when compared with its peers GM and Toyota, However, it is still well above the average, thus there is no threat coming from the capital structure of the Volkswagen group. The
leverage ratio of Volkswagen is constantly around 0,63 with only minor ups and downs. With this ratio it is almost on par with GM and o,1 above the average as shown in table 6 (cf. Volkswagen, 2016 and Toyota,2016 and GM, 2016).
Table 6: Debt/EBITDA ratio and Debt/Total Cap ratio of the industry
Company Debt/EBITDA Debt/total cap
GM 2,23 0,62 Toyota 0,24 0,32 VW 1,81 0,64 Average 1,43 0,52 0 2 4 6 2014 2015 2016 2017 2018
Debt/EBITDA
Figure 5: Debt/EBITDA ratio of Volkswagen3.2.3 Liquidity
Over the years Volkswagen has preserved a sustainable business which can be seen in the current ratio. This ratio indicates if a company is able to pay the upcoming principles and interest. If the ratio is equal to 1, the company has as much cash and cash equivalent as it has current liabilities. Thus, the higher this ratio, the less risk of bankruptcy is the company faces. In the past, Volkswagen always has had a ratio above 1. However due to the emission scandal and the penalties the company is facing the ratio dropped to 0,97.
Another ratio to consider is the Cash/EPS ratio which indicates the company’s ability to pay off debt as well as dividends and other transaction. The higher this rate the better the liquidity of the company. In the past years VW’s ratio was averaging at 40. In 2015 the ratio dropped down to 13,5 which together with the other ratio indicates the increased financial stress that follows from the emission scandal.
3.3 Other Factors
Besides to the business and the financial risk there are other factors that need to be taken into consideration. Even though they are not as relevant, they can change the rating by several notches (cf. S&P, 2016)
3.3.1 Investors
Investors play an important role. They are able to determine who should manage the company and can vote someone out if they are not performing the way the investor wants. If a company is mainly owned by a financial sponsor, the interest for a sustainable business might be lower. In case of VW the main investors are Porsche SE (32,2% of the shares), Qatar Holding LLC (16,4%) and also the state of Lower Saxony (12,7%). Especially the government as well as the Porsche Holding have a high interest in keeping a sustainable business rather than short term profit. Together the two parties have more then 70% of the total voting rights. This secures that the business will be operating sustainably. The institutional investors on the other hand hold
almost 28% of all the shares, however, they only have 9,9% of the voting rights. Thus, an interest in a sustainable business can be assumed (cf. S&P, 2016 and cf. Volkswagen, 2015).
3.3.2 Diversification
VW’s main business is the automotive industry. This can be split into two sub sectors. Namely the commercial vehicles with companies such as MAN or VW Commercial vehicles and Passengers Cars such as Porsche or Audi. However, the correlation between those two is extremely high, thus both react in the same way to business cycles and will not minimize risk. The other sector that Volkswagen operates in is the financial services. However, it is also linked to the sales of cars as well, since loans will be granted for the purchase of cars, thus if lesser cars are sold during a recession fewer loans will be given out to customers (cf. Volkswagen, 2016 and Volkswagen Financial Services, 2016).
The only diversification Volkswagen has is globally with the two main markets Europe and Asia which differ a lot from each other (cf. Volkswagen, 2016).
Due to the fact that there are only two business lines and their correlation, the rating stays unchanged. Even the diversification by different regions is too weak to be considered significant (S&P, 2016).
3.3.3 Corporate Governance
Volkswagen, as a German company, has a typical board structure consisting of the board of management as well as supervising board. The latter one does not have any saying in the decision-making process. This flaw gets even more amplified when looking at the constellation of the board of directors. Five out of the 10 seats in the supervisory board are controlled by the Porsch and Pierch family that own over 31% of the shares. Due to the dual class structure, however, they have 50,7% voting rights (cf. Elson, 2016)
Pierch’s main goal as chairman was to make Volkswagen as powerful as possible and since he and his family had more than 50% of the total voting right he was able to control the actions of
the company. Thus, there was no one to stop the fraudulent behavior in the emission scandal since this would have meant a slow down in the US market penetration (cf. Elson).
The second issue Volkswagen ‘s corporate governance structure is facing is the fact that Lower Saxony is a major shareholder in the company. The main goal of a governmental shareholder is motivated politically rather than economically. Meaning the return on investment is not the highest priority. Due to the fact that the state has two seats on the board and that all major decisions need to be approved with a 4/5 vote, other members of the board are more willing to make compromises to be able to make a deal of their own. This situation might have created a culture that approves and oversees decisions rather than questioning decisions and their impact on the entire company (cf. Elson, 2016).
The third flaw in Volkswagen’s Governance derives from the German Codetermination Act, which determines that companies bigger than 2000 employees must have shareholder as well as employee representatives. The main task of this elected board is to select and supervise a separate board that operates the company. The problem is that the party that is suceptical for shirking is also the party that is supposed to monitor it. Thus, reducing the effectiveness of the control mechanisms (cf. Elson, 2016).
These points mentioned above led to an eroding supervising culture that approved decisions rather than checking for legal and compliance issues. Even though Pierch did resign as a chairman, the structure remained unchanged, hence it still bares the risk of neglecting potential legal and compliance issues. Therefore, the rating will be lowered by one notch (cf. S&P, 2016 and cf. Volkswagen, 2016).
3.4 The Final Rating
The final rating of the Volkswagen group is BBB. The business risk can be classified as satisfactory. The high cyclicality of the industry is the main reason for the lowered rating,
whereas the country risk is favorable for Volkswagen. The financial risk is modest due to the solid capital structure on reliable cash flows (cf. S&P, 2016)
These two components would yield in a BBB+ rating. However, due to the corporate governance structure that led to the scandal the rating gets lowered by one notch to BBB.
4. Altman Z-score model
The Z-score model is an alternative approach to assess the credit worthiness of a company. It was developed in 1968 by Edward Altman. The mathematical approach uses five different ratios from the financial statement that all describe a different aspect of the creditworthiness of the company. The assumption is, that if all different ratios are positive for the company, it will not get insolvent. The formula with the ratios giving the Z-score is the following (cf. Altman, 1995)
Z=1,2 ∗ 𝑋1 + 1,4 ∗ 𝑋2 + 3,3 ∗ 𝑋3 + 0,6 ∗ 𝑋4 + 1 ∗ 𝑋5
X1: 𝐖𝐨𝐫𝐤𝐢𝐧𝐠 𝐂𝐚𝐩𝐢𝐭𝐚𝐥𝐓𝐨𝐭𝐚𝐥 𝐀𝐬𝐬𝐞𝐭𝐬 (𝐖𝐂𝐓𝐀) is a ratio to measure the company’s net liquidity compared to the total capitalization. In case a company is facing financial problem, the current assets will decrease, hence the ratio will shrink.
X2: 𝑹𝒆𝒂𝒕𝒂𝒊𝒏𝒆𝒅 𝑬𝒂𝒓𝒏𝒊𝒏𝒈𝒔𝑻𝒐𝒕𝒂𝒍 𝑨𝒔𝒔𝒆𝒕𝒔 (𝑹𝑬𝑻𝑨) is a measure of leverage of the company. Companies that accumulated a high RE in comparison to their TA did not rely on debt as much to finance their assets.
X3: 𝑻𝒐𝒕𝒂𝒍 𝑨𝒔𝒔𝒆𝒕𝒔𝑬𝑩𝑰𝑻 (𝑬𝑩𝑰𝑻𝑻𝑨 )is a ratio to describe the productivity of a company. It is used since it excludes a bias from tax or leverage.
X4: 𝑩𝒐𝒐𝒌 𝑽𝒂𝒍𝒖𝒆 𝒐𝒇 𝑻𝒐𝒕𝒂𝒍 𝑳𝒊𝒂𝒃𝒊𝒍𝒊𝒕𝒊𝒆𝒔𝑴𝒂𝒓𝒌𝒆𝒕 𝑽𝒂𝒍𝒖𝒆 𝒐𝒇 𝑬𝒒𝒖𝒊𝒕𝒚 (𝑴𝑽𝑬𝑻𝑳 ) is used to analyze how much the value of the equity can decrease before the liabilities excel and the company becomes bankrupt.
X5: 𝑺𝒂𝒍𝒆𝒔
𝑻𝒐𝒕𝒂𝒍 𝑨𝒔𝒔𝒕𝒆𝒔 ( 𝑺
𝑻𝑨)is a ratio for capital-turnover. It measures how much revenue can be
generated based on the assets of the company (cf. Altman, 1995).
Scores below 1,8 indicate that the company might be heading towards bankruptcy. In case of Volkswagen it is noticeable that the emission scandal has a negative impact since the score
Ratio Multiple value 2014 value 2015 △
WC/TA 1,2 0,09 0,01 0,07 RE/TA 1,4 0,46 0,41 0,06 EBIT/TA 3,3 0,23 -0,02 0,24 E/TL 0,6 0,54 0,48 0,06 S/TA 1 0,94 0,90 0,04 Z-Score 2,25 1,78 0,48 Table 7: Volkswagen's results of Z-Score
has decreased by 0,45 (table 7) The main difference is due to the low EBIT of Volkswagen. The reasons are the provision for the emission scandal (cf. Altman).
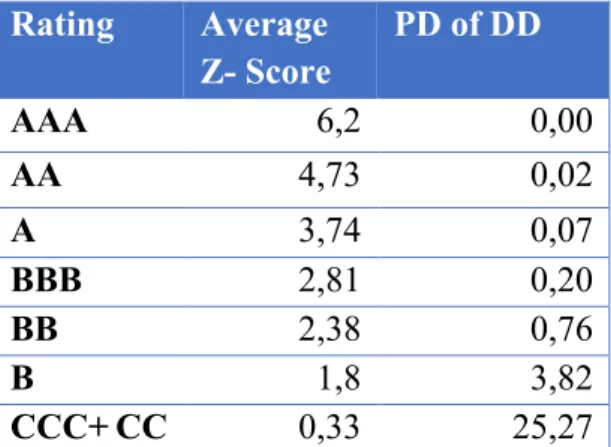
Lastly we convert the Z-Score in a different rating scale, as shown in table 8 (cf. S&P, 2016). By using the Z-Score method we calculated, that before the scandal the company hat a rating of BB. But due to the high provision of VW, the company got downgraded to B (cf. Altman).
5. Distant to Default Model
The third alternative for calculating the probability of default is the KMV-Merton method. It assumes that the equity of a company is considered a call option of the underlying asset. Therefore, the value and its volatility of the assets as well as the equity will be analyzed using the Black-Scholes(BS) option pricing model theory. To do so the following need to be assumed: Debt: homogenous with time of maturity T Capital Structure: VA(t)=D(t)+VE(t) Market perfection: there are no coupons or dividends paid Assets: assets follow the geometric Brownian motion The modified BS formula gives us the three equations (cf.Bharath, 2006) 𝑬 = 𝑽 ∗ 𝑵 𝒅𝟏 − 𝒆aa𝒓𝑻𝑭 ∗ 𝑵(𝒅 𝟐) 𝝈𝑬 = 𝑽𝑬 ∗ 𝑵 𝒅𝟏 ∗ 𝝈𝑽 𝒅𝟏= 𝒍𝒏 𝑽𝑭 e 𝒓e𝟎,𝟓𝝈𝑽𝟐 ∗𝑻 𝝈𝑽∗ 𝑻 These equations need to be solved to calculate the two unknown 𝜎i and V. This is done by using an iterating process. We 𝜎i is assumed initially to solve the equations and recalculated afterwards until the values converge (cf. Bharath, 2006). Alternatively, the naïve DD can be used to calculate the probability of default. This altered approach is a simplified version that does not require an iterative process. Therefore, we use the following variables (cf. RisFinancial Management, 2009). Rating Average Z- Score PD of DD AAA 6,2 0,00 AA 4,73 0,02 A 3,74 0,07 BBB 2,81 0,20 BB 2,38 0,76 B 1,8 3,82 CCC+ CC 0,33 25,27 Table 8: Z-Score and PD of DD conversion table
E: Market Value of the firm`s equity F: Face Value of the firm`s debt sE: Volatility of the equity µ: Equity Return sV=jekj 𝜎j+jekk ∗ 𝜎l sD: 0,05+0,25*sE T: is set to 1 These numbers need to be added to calculate the distance to default as well as the probability of default (cf. RisFinancial Management, 2009) Naive DD=𝐥𝐧 𝑬m𝑭 𝑭 e( 𝝁a𝟎,𝟓∗𝝈𝑽𝟐∗𝑻 𝝈𝑽 ∗ 𝑻 and 𝝅 𝒏𝒂𝒊𝒗𝒆 = 𝑵(−𝑵𝒂𝒊𝒗𝒆 𝑫𝑫)
These values can be compared with the average global default rate to categorize the results (cf. S&P, 2016) When applying these formulas to Volkswagen, we get the following results as seen in table 8. According to the table of S&P, Volkswagen would have the rating of A in year 2014, which decreased to BBB in 2015
6. Analysis of the Impact on the Rating
After having assessed the rating of the Volkswagen Group the impact of a scandal such as the emission scandal will be analyzed.
6.1 Emission Scandal
The emission scandal of VW started in September of 2015. Authorities discovered that some VW diesel engines had a softwear implemented helping the car detect when their emission is being tested for their emissions. As a result, the engine changed its performance which lowered the emission below the regulatory norm (cf. BBC, 2015).
The entirety of the scandal only became visible after a while. Almost 11 million cars are effected globally with the majority being in Europe (8,5 million) followed by the US (0,6 million). Unlike
Input 2014 2015 E 78258 93037 F 165720 163664 vol 30% 33% ROE 11,56% -2% Naive E 0,18 0,20 naive D 0,125 0,1325 DD -1,261 -0,72 p 0,10 0,24 Rating A BB Table 9: Results of the naive DD
initially expected, several brands of the Volkswagen group where effected. Most of the cars were Volkswagen passenger cars (5,6 million). But also, brands such as Audi (2,4 million), Skoda (1,2 million) and Seat (0,7 million) had the softwear installed to alter the engines performance (cf. Volkswagen, 2015).
VW, facing the pressure of increasing the diesel sales in the US, tried to find a way to reduce the costs to get a foothold on the market. In the past companies, have invested heavily into the diesel technology in order to make it more profitable. In 2015 only 1% of all the cars in the US had a diesel engine. This softwear allowed the company to save money on more expansive filter technology, which is used to reduce the emission and would have allowed VW to expand the market by offering lower prices (cf. Bloomberg, 2016).
Next to the damage to the image of the Volkswagen brand, the company must pay large fines to the authorities as well as to the victims who bought the cars. The settlement in the US, on which both parties agreed in Jun 2016, costs almost $15bln. $10bln. will be required to either buy back the affected cars or to recall the cars and repair them accordingly. An additional $2,7bln. will be paid to EPA. Furthermore, VW pledged to invest an additional $2bln. in a cleaner technology. This sum however only involves the American market and does not include other countries such as Australia. Here the lawsuits are still pending leaving VW in uncertainty (cf. Bloomberg, 2016).
6.2 The Impact
In order to asses the rating of the Volkswagen Group several aspects are taken into consideration. One main pillar of the rating is the business risk of a company. A scandal, such as the one that occurred with Volkswagen does not influence the industry nor the country risk. However, the business risk does get impacted. This is due to the fact that the brand plays a role in the rating. However, this is only one aspect out of several that are taken into consideration when assessing the business risk (cf. S&P, 2016).
Even though the scandal impacted not just Volkswagen AG but also four other brands of the group only the image of Volkswagen suffered severely. This is due to the fact that the majority of the manipulated cars (more than 50%) were from the Volkswagen brand. But also, since it was the first company where the softwear got detected (cf. Volkswagen, 2015).
Since the rating of the entire group is the weighted average of each entity, the downgrading of the business risk for Volkswagen does not have an impact on the overall rating and can be neglected.
The other important pillar is the financial aspect of the group. Here the consolidated statements are analyzed. The main ratios are the FFO/DEBT as well as Debt/EBITDA. All three elements of the ratios are impacted.
In order to be able to cover the fees assigned by the state as well as to cover up the recall options the company needs to take an additional amount of debt. The company formed provision worth 17,8 bln that lower the overall rating of the company (cf. S&P, 2015)
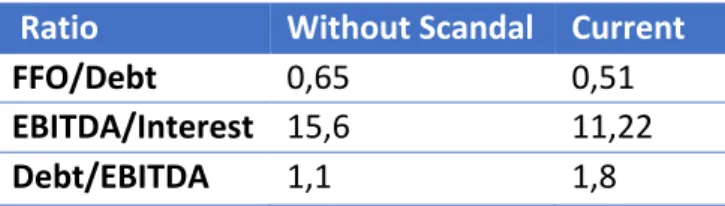
As shown in the table, the values do however change. Without the scandal, all values would have been better.
As of now the company’s financial risks are rated as moderate. Without the additional debt and the decreased EBITDA, the company’s risks would be lowered to minimal. This has an impact on the rating. As seen in the matrix, the rating would be shifted from BBB+ to A/A-.(see figure 6 cf. S&P, 2016).
Furthermore, even though the corporate governance structure did not change, it is questionable if it would have been perceived differently. In this rating, we have lowered the preliminary rating by one node, but before the scandal this was not the case, since analysts agreed that the corporate governance is not an issue for the Volkswagen group. Because of the scandal the focus has changed and will also play an important role for the following years.
Ratio Without Scandal Current
FFO/Debt 0,65 0,51
EBITDA/Interest 15,6 11,22
Debt/EBITDA 1,1 1,8 Table 10: Results of an alternative scenario without the scandal
Figure 6: S&P's credit rating matrix
What also need to be taken into consideration is the fact that this figure will be used for the following ratings since the numbers are the average number of 5 years. Thus, for the next two years Volkswagen will have a lower rating even though the EBITDA has reached the height before the crisis.
The Z-Score method come to a similar conclusion as the first method. The main reason for the downgrading from BB to B is due to the decreased of the ratio X3, EBIT/Total Assets. The Assets stayed almost the same whereas the EBIT became negative. This would not have been the case without the provisions VW formed.
Comparable results come from the DD Model. The two input values for the formula that changed the most are the volatility of the equity as well as the equity return. Both are caused by the negative impact of the scandal. Thus, without it, the downgrading most likely would not have happened.
7. Conclusion
The emission scandal of Volkswagen has a negative impact on its rating, however the rating grading does only differ by two notches when using the S&P model. The company had a solid rating before the scandal and was able the refinance itself easily with new debt and from its existing cash flows.
The damage to the image as well as to the sales can be classified as minimal. In 2009 Toyota sold cars with malfunction breaks that led to accidents. The image of the company suffered as well and Toyota had to pay $2bln in order to recall or repay the damaged cars. This is reflected in the decrease of sales in this period. However, after a short period of time this negative effect nullified. Even though the altitude of the scandal was smaller, it is comparable with the emission scandal (cf. Bloomberg, 2016). This is also the case for Volkswagen. With the increased sales, the EBIT will go up as well, especially considering that there is no deduction due to special items. This will improve the Z-Score. In November Volkswagen was already able to exceed its sales in the US from the previous years. Thus, after the debt has been paid of it can be assumed that the rating will go up as it was in September 2015 (cf. Wall Street 24/7, 2016).
Similar results can be expected from the DD rating. The volatility of the equity increased due to the high selling rate of shares caused by the scandal. Under normal circumstances, the volatility is lower and more favorable for the rating of the company.
Even though all tree approaches had a different final rating, they still had the same tendency of downgrading Volkswagen to a certain extend (cf. Financial Times).
V. Appendix
Forecast In millions 2014 2015 2016 2017 2018 Sales (Units 10,217 10,009 10,189 10,494 10,809 Sales revenue 202,458 213,292 212,243 218,610 227,354 COGS -165,934 -179,382 -173,801 -180,681 -188,692 Gross profit 36,524 33,910 38,441 37,929 38,662 EBITDA 22,464 7,520 23,643 23,328 23,779 FFO 17,512 3,597 17,510 18,186 18,537 EBIT 14,794 -1,301 14,792 15,363 15,660 Capital expenditures and development costs 11,400 12,700 13,716 14,127 14,551 Net Income 11,068 -1,582 11,067 11,494 11,716 Working Capital 15,800 2,600 12,200 16,840 17,127 Total assets 351,209 381,935 403,079 415,171 427,626 Current assents 131,102 145,387 153,436 158,039 162,780 Noncurrent assets 220,106 236,548 249,643 257,132 264,846 Equity 90,189 88,270 92,353 95,124 97,977 Current liabilities 130,706 148,489 156,709 161,411 166,253 Noncurrent liabilities 130,314 145,175 154,715 159,356 164,137 Net debt 24,983 32,421 30,800 29,260 27,797 Interest expenses 1,624 2,107 2,002 1,902 1,807 Debt/EBITDA 1,112 4,311 1,303 1,254 1,169 FFO/debt 0,701 0,111 0,568 0,622 0,667 EBITDA interest coverage 13,833 3,568 11,810 12,266 13,161VI. Sources
E Altman. 1995. “Predicting Financial Distress of Companies: Revisiting the Z-Score and Zeta Models”. Accessed January 5, 2017 http://pages.stern.nyu.edu/~ealtman/PredFnclDistr.pdf
E Altman. “The Use of Credit Scoring Models and the Importance of a Credit Culture”. Accessed January 5, 2017http://pages.stern.nyu.edu/~ealtman/3-%20CopCrScoringModels.pdf
Audi AG. 2016. Accessed January 5 http://www.audi.com/de.html
BBC News. 2015. “Volkswagen: The scandal explained”. Accessed January 5, 2017 http://www.bbc.com/news/business-34324772
S Bharath, T Shumway. 2006. “Forecasting Default with the Merton Model”. Accessed January 5, 2017 http://web-docs.stern.nyu.edu/salomon/docs/Credit2006/T_Shumway.pdf
Bloomberg, 2016 “Electric vehicles to be 35% of global new car sales by 2040”. Accessed January 5, 2017. https://about.bnef.com/blog/electric-vehicles-to-be-35-of-global-new-car-sales-by-2040/
Congressional Research Service. 2016. “The European Union: Current Challenges and Future Prospects”. Accessed January 5, 2017 https://fas.org/sgp/crs/row/R44249.pdf
C Clarke, 2006. “Automotive Production Systems and Standardization” p53. M Erhard, E Brigham. 2009. Corporate Finance: A Focused Approach. p 550 Financial Times. 2016. Accessed January 5 2017 https://www.ft.com Gurufocus. 2016. Accessed January 5 2017
http://www.gurufocus.com/term/CCC/VLKAY/Cash%2BConversion%2BCycle%2B%2528CCC%2529/Volkswagen%2B AG
M Elson. 2016. “The Bug at Volkswagen: Lessons in Co-Determination, Ownership, and Board Structure”. Accessed January 5, 2017 https://papers.ssrn.com/sol3/papers.cfm?abstract_id=2737544
Euler Hermes. 2016. Accessed January 5, 2017 http://www.eulerhermes.com/Pages/default.aspx
European Commission. 2013. “Agreement reached on cutting CO2 emissions from cars further in 2020”. Accessed January 5, 2017. http://ec.europa.eu/clima/news/articles/news_2013062501_en
Fortune. 2016. “The top 10 Fortune 500”. Accessed January 5, 2017. http://beta.fortune.com/global500 General Motors. 2016. Accessed January 5 2017 http://www.gm.com/index.html
Investopedia. 2016. ”Cyclicality”. Accessed January 5, 2017. http://www.investopedia.com/terms/c/cyclical_industry.asp
Moody’s. 2006. “RATING METHODOLOGY - Benchmarking Quantitative Default Risk Models: A Validation Methodology . Accessed January 5, 2017 http://www.rogermstein.com/wp-content/uploads/53621.pdf P Nieuwenhuis, P Wells. 2003. „The Automotive Industry and teh Environment“ pp. 232
Nikkei Asian Review, 2013 “Emerging economies to blame as growth in global auto sales slows“. Accessed January 5, 2017 http://asia.nikkei.com/Business/Trends/Growth-of-global-new-car-sales-slowing-amid-downshifts-of-emerging-economies
Porsche AG. 2016. Accesses January 5, 2017 http://www.porsche.com
Risk Financial Management Journel.2014. “Validation of the Merton Distance to the Default Model under Ambiguity”. Accessed January 5 2017 http://www.mdpi.com/journal/jrfm
S&P. 2016. “Criteria | Corporates | General: Corporate Methodology”. Accessed January 5, 2017https://www.standardandpoors.com/en_US/web/guest/article/-/view/sourceId/8314109. Spiegel. 2016. „VW-Zuliefererstreit betrifft fast 28.000 Mitarbeiter”. Accessed January 5, 2017.
http://www.spiegel.de/wirtschaft/unternehmen/vw-zuliefererstreit-betrifft-fast-28-000-mitarbeiter-a-1108856.html Statista. 2016. “Most valuable brands within the automotive sector worldwide as of 2016, by brand value (in billion U.S. dollars)”. Accessed January 5, 2017 https://www.statista.com/statistics/267830/brand-values-of-the-top-10-most-valuable-car-brands/
Statistisches Bundesamt.2016. Accessed january 5 2017. http://www.bmi.bund.de/DE/Themen/Moderne-Verwaltung/Open-Government/StatistischesBundesamt/statistischesBundesamt_node.html
Tharawat magazine. 2016. “Top 10 Largest Car Companies in the World”. Accessed January 5, 2017. http://www.tharawat-magazine.com/facts/10-largest-car-companies/#gs.LA6M2D4
The Global Economy. 2016. Accessed January 5, 2017 http://www.theglobaleconomy.com The World Bank, 2016. Accessed January 5, 2017 http://data.worldbank.org
Toyota. 2016. Accessed January 5 2017 http://www.toyota.com Volkswagen. 2015. “Annual Report” 2015.
Volkswagen. 2016. Accessed January 5, 2017 https://www.volkswagenag.com
Volkswagen Financial services. 2016. Accessed January 5, 2017 https://www.vwfsag.de/en/home.html Wall street 24/7. 2016.” VW Sales To Rise 5.5% In November” Accessed January 5 2017
http://247wallst.com/autos/2016/11/25/vw-sales-to-rise-5-5-in-november/ Yahoo Finance. 2016. Accessed January 5, 2017. https://finance.yahoo.com
VII. Disclaimer
This project was written by me and in my own words, except for quotations from published and unpublished sources which are clearly indicated and acknowledged as such. I am conscious that the incorporation of material from other works or a paraphrase of such material without acknowledgement will be treated as plagiarism, subject to the custom and usage of the subject, according to the University Regulations on Conduct of Examinations. The source of any picture, map or other illustration is also indicated, as is the source, published or unpublished, of any material not resulting from my own experimentation, observation or