ARTIGOS ORIGINAIS http://dx.doi.org/10.29397/reciis.v12i3.1308
Better food choices among users of the Digital Food Guide: a report
from Brazil
Melhores escolhas alimentares entre usuários do Guia Alimentar Digital:
um relatório do Brasil
Mejores opciones de alimentos entre los usuarios da Guía Alimentaria
Digital: un informe de Brasil
Simone Caivano1,a
simone.caivano@hotmail.com | https://orcid.org/0000-0002-3035-9888 Semíramis Martins Álvares Domene2,b
semiramisdomene@gmail.com | https://orcid.org/0000-0003-3003-2153
1 Universidade Federal de São Paulo, Programa Interdisciplinar em Ciências da Saúde. Santos, SP, Brasil. 2 Universidade Federal de São Paulo, Departamento de Políticas Públicas e Saúde Coletiva. Santos, SP, Brasil.
a Doutorado em Interdisciplinar em Ciências da Saúde pela Universidade Federal de São Paulo. b Doutorado em Ciência da Nutrição pela Universidade Estadual de Campinas.
Resumo
O acesso fácil à informação possibilita a oportunidade de promover escolhas alimentares saudáveis. Este estudo apresenta o Guia Alimentar Digital (GAD), aplicativo para smartphones, e avalia sua capacidade de promover escolhas alimentares saudáveis. Usuários registram sua ingestão alimentar e recebem dados dos grupos alimentares e Índice de Qualidade da Dieta, pontuação associada ao GAD. Este estudo analisou a ingestão alimentar e peso corporal relatados de 442 usuários de ambos os sexos, entre 19 e 50 anos. Após usar o aplicativo, aproximadamente um terço dos participantes melhoraram seu padrão alimentar e 60% perderam peso (p < 0,01). A percentagem de indivíduos que consumiram dieta de qualidade ruim diminuiu 8,5%, aqueles que obtiveram qualidade intermediária aumentaram 6,8% e os de alta qualidade aumentaram 1,6% (p = 0,01). Tecnologias da informação podem ser recursos adicionais, apoiando a educação nutricional e ajudando as pessoas a comerem conscientemente com resultados positivos para a saúde.
Palavras-chave: Promoção da saúde; Prevenção de doenças; Tecnologia médica; Saúde pública; Comportamento alimentar; Alimento; Tecnologia inovadora; Smartphone; Avaliação dietética; Registro móvel de alimentos.
Abstract
Easy access to information provides an opportunity to promote healthy food choices. This study presents the Digital Food Guide (DFG), an application for smartphones, and assesses its ability to promote healthy food choices. Users record their food intake and receive data regarding food groups and Diet Quality Index, a score associated with the DFG. This study analyzed the reported food intake and body weight of 442
users of both genders aged 19 to 50 years. After using the app, approximately one-third of the participants improved their dietary pattern and 60% lost weight (p < 0.01). The percentage of individuals consuming a poor-quality diet decreased by 8.5%, individuals consuming an intermediate-quality diet increased by 6.8% and individuals consuming a high-quality diet increased by 1.6% (p = 0.01). Information technologies may be additional resources by supporting nutritional education, thus helping individuals to eat consciously with positive health outcomes.
Keyword: Health promotion; Disease prevention; Medical technology; Public health; Feeding behavior; Food; Novel technology; Smart phone; Dietary assessment; Mobile food record.
Resumo
Acceso fácil a la información posibilita oportunidad de promover escojas alimentares saludables. Este estudio presenta la Guía de Alimentación Digital (GAD), la aplicación para smartphones, y su capacidad de promover escojas alimentares saludables. Usuarios registran su información y reciben datos de los grupos alimentarios y del Índice de Calidad de la Dieta, pontuación asociada a GAD. Este estudio compara un ingestión alimentaria y un peso corporal relatados de 442 usuarios de ambos sexos, entre 19 y 50 años. Después de usar el programa, aproximadamente un tercio de los dos mejoró su patrón alimentario y 60% pierderon peso (p < 0,01). Un porcentaje de consumo que consumió la dieta de calidad disminuyó un 8,5%, lo que aumentó el 6,8% y aumentó 1,6% (p = 0,01). Tecnologías de la información pueden ser recursos adi-cionales, apoyo a la educación nutricional y ayudar a las personas a comer conscientemente con resultados positivos de salud.
Palabras clave: Promoción de la salud; Prevención de enfermedades; Tecnología medica; Salud pública; Comportamiento alimentario; Comida; Tecnología innovadora; Teléfono inteligente; Evaluación dietética; Registro móvil de alimentos.
INFORMAçõeS DO ARTIGO
Contribuição dos autores: S Caivano e SMA Domene participaram do desenho, planejamento, análise, interpretação e redação
do artigo.
Declaração de conflito de interesses: Os autores não possuem conflitos de interesse ao presente trabalho. Fontes de financiamento: Não houve.
Considerações éticas: O protocolo foi aprovado pelo comitê de ética da Universidade Federal de São Paulo, processo 1823/11. Agradecimento/Contribuições adicionais: Não há.
Histórico do artigo: Submetido: 10.maio.2017 | Aceito: 23.maio.2018 | Publicado: 25.set.2018. Apresentação anterior: Não houve.
Licença CC BY-NC atribuição não comercial. Com essa licença é permitido acessar, baixar (download), copiar, imprimir,
compartilhar, reutilizar e distribuir os artigos, desde que para uso não comercial e com a citação da fonte, conferindo os devidos créditos de autoria e menção à Reciis. Nesses casos, nenhuma permissão é necessária por parte dos autores ou dos editores.
Introduction
It is estimated that 1.5 billion adults are overweight and 500 million of these are clinically obese. Obesity increases the possibility of developing type 2 diabetes and cardiovascular diseases (coronary heart disease, strokes and hypertension), as well as several types of cancer (colorectal, breast, uterine and renal)1. Complications related to excess weight between 1998 and 2008 had represented 17% of the
total cost of hospitalizations2. In Brazil, 50.1% of the adult population is overweight and 12.4% are obese3.
In 2011, obesity-related costs accounted for US$ 269.6 million spent by the Brazilian Unified Health System (Sistema Único de Saúde – SUS), corresponding to 1.86% of all Ministry of Health expenses associated with hospital and outpatient care4.
Among the strongest risk factors related to chronic non-communicable diseases (NCD) are smoking, physical inactivity and dietary habits with excessive alcohol consumption, insufficient fruit and vegetable intake and high consumption of processed and ultra-processed food2,5,6. Ultra-processed food consumption,
including cookies, crisps and other snacks, sugary drinks, and various energy dense products replaces more nutritious food intake in the diet and is an important contributing factor to the rising of NCD7-9. Food made
with low cost ingredients such as sugar, salt and fat are very palatable and exerts influence on feeding behavior regulation10. A recent World Health Organization (WHO) report alerts about marketing strategies
that induce consumers to believe that those products are healthy11.
Improvement in eating habits demands a multifactorial approach to achieve a long-term change. Self-monitoring of food intake can promote progress towards healthier food choices by replacing low nutritional density foods or those associated with health risks, which is recognized as one of the main strategies to prevent NCD12-15. It is already demonstrated that knowing the quality of the food contributes to healthy food
choices16.
The concept of self-care is part of the solution to maintain and improve health, when subjects assume the responsibility of adopting positive food-related attitudes (autonomy) that help prevent and control NCD and disorders17,18. Self-management requires cognitive processes that turn intentions into behaviors
(self-assessment)12. Mobile applications are a new tool for learning activity19, therefore they can be used as
a resource for nutritional education actions, providing access to diet-and-health related information and encouraging conscious food choices. 'Promoting self-care' involves understanding that the processes of forming an attitude and effectively changing consumer behavior are not identical20.
Digital technology may enhance personal 'health care' and can lead individuals to engage in self-management behaviors21–23. The WHO has published a toolkit aligned with the trends observed in human
behavior, regarding how technology is making health systems more efficient and closer to people’s needs and expectations19.
At first, most applications, e-Health apps, were designed to help NCD patients adopt healthy lifestyles21,22,24. The growth of mobile communication technologies allows opportunities for research to be
identified with tools that support health care19,21,23,25,26.
The app used in this study follows the international guidelines for a healthy diet adopted by Harvard School of Public Health27–30 adjusted to Brazilian food habits, in a form of a Diet Quality Index associated
with Digital Food Guide (DQI-DFG), already validated31. This app works as a food registry diary that aims
to incentivize healthy food choices, therefore it is believed that it may help in the habit changing process. The objective of this study is to present the first results of a positive food consumption pattern shift after using this app.
Research design, methods and procedures
Application description: the Nutrabem app was developed in the programming language Objective-C for the iOS (Apple) operational system, and is the first app designed as a Digital Food Guide for Portuguese speakers. The list of food and recipes available in this app has more than 3000 items from the Brazilian table of food composition32, as a priority, and after that, by the nutrient database of United States Department of
Agriculture (USDA)33. Data is transmitted over the mobile phone to a database in a Microsoft SQL Server
(version 10.00.1600.22, 2008, Microsoft®). Users record each food intake and the app calculates portion
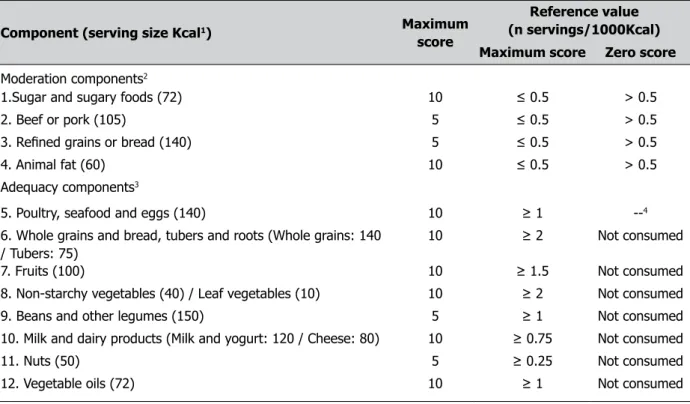
sizes according to the food groups. After the complete record of a day, the result of the Diet Quality Index becomes available. The app informs the user which food groups are being consumed above or below the recommended number of servings of each DFG group, listed in Table 1.
Study design and data collection: the app has been available for use since April 2009. A retrospective cohort study was done accessing the user app database. The first food registry was considered as day 1 (D1) and the closest registry up to the moment of data collection was considered as day 2 (D2). The period between D1 and D2 depends on the initial date of handling the app, and varies between participants. In a pilot study accomplished to know the perception of the users relating to this app34, it was identified that the
first day of use was enough for users to get familiar with the tool. During this period, users are not worried about distributing the food registry of each meal along the day. For this reason, the D1 was established at the first record that contained at least three meals.
Personal data (name, birth date, gender), physical activity and anthropometric self-reported data were collected and the Body Mass Index (BMI) was calculated35. Daily food intake was assessed
by converting the food reported into food groups with the corresponding number of servings, as recommended by the DQI-DFG31.
Diet Quality Index associated with Digital Food Guide (DQI-DFG): the main concept of DQI-DFG is based on the guidelines of the School of Public Health at Harvard University27,31, with adjustments to take
into consideration traditional Brazilian food habits. The main difference between Harvard guidelines dietary and Brazilian food habit is the valorization of beans intake and other legumes. The validation of this index was represented by psychometric properties used from the Health Eating Index – 200528. DQI-DFG
is divided into moderation components, to include food that present a risk to health when consumed in excess, and adequacy components, made up of food groups that seek to ensure nutritional needs. DQI-DFG has a maximum score of 100 points; a score of more than 80 indicates a “high-quality diet,” scores between 50 and 80 were considered as a “moderate-quality diet,” and scores of less than 50 indicated a “poor-diet quality”31. Considering the distribution of points per group for each component that makes up the DQI-DFG
as a standard, an increase by at least 10 points between D1 and D2 of the DQI-DFG score was considered to indicate an improvement of the dietary pattern.
Usage time of the tool: as the usage time of the tool is not the same among the participants, it was decided to categorize the following ranges: “up to three months”, “three to six months”, “between six months and oneyear” and “above one year”.
Inclusion criteria: a software update invited all users from April 2009 to November 2011 to join the study. An informed consent form remained available on the opening screen for six months. Participants of both genders aged 19 to 50 years who had used the app for at least 15 days were included, unless they were professional athletes, pregnant or breastfeeding or had any diseases that required a special diet. Aiming
to reduce the likelihood of analyzing incomplete intake reports, data containing at least three meals were included to select D1.
Statistical treatment: SPSS® (version PASW Statistics 18.0.0, 2009, IBM Software) for Windows was
used for processing the data adopting 5% significance level (p < 0.05). The Kolmogorov-Smirnov test was used for verifying whether the variables were normally distributed and the chi-square test was used for analyzing the categorical variables. The improvement in dietary patterns was further investigated by the binomial test. Changes in food choices before and after exposure to the DFG were assessed by the Wilcoxon, McNemar and chi-square tests. Change in weight and BMI after exposure to the DFG was assessed by the sign-test and Wilcoxon test. The difference between weight change and the period of tool usage was evaluated by the chi-square test.
Table 1 – Components and scores of the Diet Quality Index associated with the Digital Food Guide (DQI-DFG)
Component (serving size Kcal1) Maximum
score
Reference value (n servings/1000Kcal) Maximum score Zero score Moderation components2
1.Sugar and sugary foods (72) 10 ≤ 0.5 > 0.5
2. Beef or pork (105) 5 ≤ 0.5 > 0.5
3. Refined grains or bread (140) 5 ≤ 0.5 > 0.5
4. Animal fat (60) 10 ≤ 0.5 > 0.5
Adequacy components3
5. Poultry, seafood and eggs (140) 10 ≥ 1 --4
6. Whole grains and bread, tubers and roots (Whole grains: 140 / Tubers: 75)
10 ≥ 2 Not consumed
7. Fruits (100) 10 ≥ 1.5 Not consumed
8. Non-starchy vegetables (40) / Leaf vegetables (10) 10 ≥ 2 Not consumed
9. Beans and other legumes (150) 5 ≥ 1 Not consumed
10. Milk and dairy products (Milk and yogurt: 120 / Cheese: 80) 10 ≥ 0.75 Not consumed
11. Nuts (50) 5 ≥ 0.25 Not consumed
12. Vegetable oils (72) 10 ≥ 1 Not consumed
Source:Caivano and Domene31, adapted.
Note: 1Serving sizes considering a 2000 kcal reference diet; 2Dichotomous score; 3The score is proportional to the amount of
food consumed from each group until the number of recommended servings per group is met; 4 To admit the possibility of
vegetarian diets.
Results
Characterization of the subjects: out of 23,137 users, 662 (2.86%) agreed to participate in the study after reading the informed consent term, of whom 34 were excluded because their data was incomplete. Then, 442 subjects met the inclusion criteria. Participants were predominantly women (n = 262; 59%), aged 31 to 50 years (n = 284, 64.3%), had a low level of physical activity (n = 297; 67.2%), and BMI above 25kg/m2
(n = 284; 64.3%). Active subjects account to only 32.8% of the sample.
After exposure to the DFG, 139 (31.45%) individuals, 84 (60.43%) women and 55 (39.57%) men, improved their DQI-DFG score by at least 10 points (p < 0.01). On the other hand, the DQI-DFG scores of 111 individuals (25.11%) dropped (p < 0.01), meaning that their diets worsened. The group of individuals
who improved their diets after the exposure to the app was larger than the group who worsened their diets (p < 0.05). Table 2 contains the number of servings of each food group consumed on D1 and D2. For both genders, there was a significant reduction in the median intakes of sugary food (p < 0.01) and refined grains and bread (p < 0.01), even though the latest reported intakes did not reach the reference values. Males reduced their consumption of beef and pork significantly (p < 0.05) and the new intakes are within the reference values. The intakes of whole grains, fruit, non-starchy vegetables, beans and other legumes, and nuts did not change significantly (except the vegetable intake of males) and continued to be low, especially those regarding legumes and nuts.
We also observed that 265 (60.0%) individuals lost weight, 118 (26.7%) gained weight and 59 (13.3%) did not experience any weight change (p < 0.01). By comparing the weight and BMI changes between D1 and D2 among all participants, a median weight loss of 2.1kg for women and 2.6kg for men was observed, which corresponds to a median loss of 0.16kg/m2 and 0.44 kg/m2, respectively (p < 0.00).
Figure 1 contains the distribution of the differences between BMI loss and gain after exposure to the app. The BMI change (D2 - D1) showed no statistical difference in relation to the application usage time (p > 0.05), as shown in Table 3.
Table 2 – Median of servings by food group consumed before and after exposure to the application (n= 442)
Component Reference value (serving) Before exposure (Percentile) After exposure (Percentile)
Females 25 50 75 25 50 75 P1
Sugar and sugary foods 0-1 0.66 1.88 4.09 0.18 1.49 3.14 <0.01
Poultry, seafood and eggs 0-2 0.11 0.79 1.97 0.06 0.67 1.39 <0.01
Beef and pork 0-1 0.00 0.72 1.90 0.00 0.30 1.73 0.07
Whole grains and bread, tubers and root 4-6 0.24 0.64 1.59 0.00 0.43 1.42 0.08
Refined grains and bread 0-1 1.22 2.39 3.46 0.65 1.74 2.59 <0.01
Fruits 3-5 0.25 1.19 2.25 0.08 0.9 1.89 0.05
Animal fats 0-1 0.00 0.00 1.15 0.00 0.00 0.68 <0.05
Non-starchy vegetables 4-5 0.42 1.08 2.07 0.46 0.92 1.85 0.08
Beans and other legumes 2-3 0.00 0.00 0.89 0.00 0.00 1.12 0.28
Milk and dairy products 1.5-2.5 0.91 1.74 2.85 0.60 1.16 2.11 <0.01
Nuts 0.5-1.5 0.00 0.00 0.00 0.00 0.00 0.00 0.69
Vegetable oils 2-3 0.62 1.24 2.07 0.48 0.87 1.61 <0.01
Males
Sugar and sugary foods 0-1 0.75 2.66 5.20 0.25 1.41 3.28 <0.01
Poultry, seafood and eggs 0-2 0.16 1.38 2.72 0.18 1.01 2.16 <0.05
Beef and pork 0-1 0.00 1.40 3.39 0.00 0.47 2.73 <0.05
Whole grains and bread, tubers and root 4-6 0.00 0.37 1.45 0.00 0.47 1.47 0.83
Refined grains and bread 0-1 1.56 3.66 5.23 0.82 2.02 3.52 <0.01
Fruits 3-5 0.07 0.98 2.30 0.00 1.07 2.34 0.96
Animal fats 0-1 0.00 0.00 1.18 0.00 0.00 0.74 0.33
Non-starchy vegetables 4-5 0.70 1.30 2.54 0.45 1.00 2.17 <0.05
Beans and other legumes 2-3 0.00 0.00 1.29 0.00 0.00 0.89 0.49
Milk and dairy products 1.5-2.5 0.86 2.13 3.58 0.76 1.48 2.59 <0.01
Nuts 0.5-1.5 0.00 0.00 0.00 0.00 0.00 0.00 0.58
Vegetable oils 2-3 0.80 1.51 2.44 0.56 1.10 1.85 <0.01
Source: The authors (2018).
Source: The authors (2018).
Figure 1 – Distribution of the interquartile range of weight and BMI difference after exposure to the Digital Food Guide (n= 442)
Table 3 – Difference between BMI change and time of exposure to the Digital Food Guide (n= 383)
Application usage time BMI change up to three
months
3 to 6 months between 6 months and 1 year
above 1 year Total
loss 68 64 68 65 265
gain 23 25 33 37 118
Total 91 89 101 102 383
Source: The authors (2018). Note: p>0.05
Discussion
Many health-related apps that support self-care are currently available on smartphones. However, when it comes to to food intake, the most common apps are limited to counting calories36,37. Therefore, the
Nutrabem app provides access to useful information of consumers’ daily routine regarding to food choices, helping them to monitor the quality of the diet, and not only caloric intake. Hence, the app under study is innovative in the sense that it encourages people to reflect about food choices based on knowledge of the different food groups. This can be noticed by the shift of eating pattern classification, once in which the percentage of individuals consuming a poor-quality diet decreased by 8.5%, individuals consuming an in-termediate-quality diet increased by 6.8% and individuals consuming a high-quality diet increased by 1.6% (p = 0.01). Food groups belonging to the moderation components (“Sugar and sugary food,” “Beef or pork”, “Refined grains or bread” and “Animal fat”) when consumed in excess bring about health risk, therefore, in the process of changing eating patterns, it is necessary to reduce its consumption. It is important to emphasize the significant decrease in the consumption of “sugary foods” and “refined grains and bread” for both men and women, given that foods rich in carbohydrates with high glycemic index are associated with obesity, type 2 diabetes, metabolic syndrome and cardiovascular disease9,38.
The reduction of “beef or pork” intake in men is significant, despite their consumption being within the proposed reference value. This result is important when taking into consideration that beef and pork intake is associated with the risk of developing colorectal cancer39.
A Finnish study, which has as its main objective users’ weight loss and encourages healthy eating and the practice of physical activity, found that 83% of the users reduced their intakes of added sugar and in-creased vegetables consumption38. An Italian study, that in addition to promoting weight loss also intended
to advise on the properties of the Mediterranean diet and the benefits of consuming fresh local food, found that after three months of use of their tool, 83% of subjects showed improvement in their diet quality: 48% reduced fat intake, 33% decreased the amount of sugar and candy consumption and 17% increased the amount of vegetables intake40.
Chang and collaborators stated that the adherence to a food registry diary has a positive effect on excess weight loss34 which can be facilitated by means of a mobile device. The Finnish study found that users lost
more weight than the control group over a period of 12 months38. The Italian study found that 68% of the
users of their app lost weight over a period of 5 months40. Although the percentage of subjects who lost
weight after exposure to the app is high, single observation does not provide full information about long-term maintenance of weight loss. There was no statistically significant difference when analyzing weight loss in regards to the period of exposure to the app. Despite losing weight being the objective of these users, 26.7% of participants increased their weight by 1.9kg. As there is no direct contact with these participants we could not analyze the reasons. Other studies are needed to clarify both the weight gain and the associa-tions with the tool usage time.
As smartphones become more popular, accessible and easy to use, their platforms become a great way to disseminate apps that support wellbeing22,23. The strength of mobile applications include the ease of
recording food intake data and performing analyses26,36. However, most of the apps are build with
Amer-icans nutritional value. This characteristic differentiates this app from the others because it valorizes the nutritional value and the Brazilian food habits. Food intake assessment is complex and has limitations, notably the quantification of the portion size and the determination of the frequency and the appropriate identification of the food consumed15,41,42. Previous studies have shown that digital data collection is
accu-rate and demands less effort when filling out a dietary record in a faster and reliable way26,36,41-44.
Limitations section: the total numbers of users in the period of data collection (23.137) does not repre-sent the total amount of active users, i.e., individuals who were using the application in a daily basis. This number represents the total number of downloads made – it is impossible to identify the number of active users. It was necessary for the users to connect to the Internet to collect data transmission; during the study period (2012), network difficulty to access the Internet in Brazil may have hampered the accession of volunteers and the complete transmission of data, justifying the low response rate. This application is free and open access to the population, available on the app store for smartphones. Thus, it is possible that individuals who have chosen to experience and use it are already interested in improving their diet and are comfortable with their body weight. This study was conducted according to data already available on the app, therefore whether survey participants were conducting a nutritional follow up with a health profes-sional was not investigated, as well as the reason for weight gain. However, we understand that this tool is a complement to the actions of food and nutritional education. Although the analyzed data are self-reported, which limits the interpretation of this study, this app is for personal use and its members have an interest in providing reliable data to get better results. Another important aspect to be considered for the analysis of data is the collection interval between D1 and D2: the differences in application usage at the start date (D1) and exposure intervals until the last date (D2) may limit the interpretations of the effect of using the app.
Conclusion
The app uses an easy-to-understand interface, provides access to information on diet and health and en-courages consumers to eat more consciously, therefore it can be an additional tool for nutritional education actions. In order to reach a greater number of users, the app has been available for the Android operational system since June 2012, expanding and facilitating access to this technology. This study showed a signifi-cant improvement in dietary pattern and weight loss in most of the app’s users. However, evidences for a consistent benefit of a shift to a better long term diet and to prevent excessive body weight gain remains inconclusive. A randomized controlled trial testing the app is justified as a resource to improve food choices and use of biomarkers to provide a more accurate measurement of its effect on dietary intake.
References
1. Word Health Organization. Obesity and overweight [Internet]. Genebra; c2018 [cited 2018 ago 22]. Available from: http://www.who.int/mediacentre/factsheets/fs311/en/index.html
2. Wang Y, Beydoun MA, Liang L, Caballero B, Kumanyika SK. Will americans become overweight or obese? Estimating the progression and cost of the US obesity epidemic. Obesity [Internet]. 2008 [cited 2018 ago 22];16(10):2323-30. doi: https://doi.org/10.1038/oby.2008.351
3. IBGE. Pesquisa de Orçamentos Familiares 2008-2009: Avaliação Nutricional da disponibilidade de alimentos no Brasil. Rio de Janeiro; 2010 [citado em 2018 ago 22]. Disponível em: https://biblioteca. ibge.gov.br/visualizacao/livros/liv47310.pdf
4. Oliveira ML, Santos LMP, Silva EN. Direct healthcare cost of obesity in Brazil: An application of the cost-of-Illness method from the perspective of the public health system in 2011. PloS one [Internet]. 2015 [cited 2018 ago 22];10(4):1-15. doi: https://doi.org/10.1371/journal.pone.0121160
5. Steemburgo T, DallÁlba V, Gross JL, Azevedo MJ. Fatores dietéticos e síndrome metabólica. Arq Bras Endocrinol Metab [Internet]. 2007 [cited 2018 ago 22];51(9):1425-33. doi: http://dx.doi.org/10.1590/ S0004-27302007000900004
6. Martins APB, Levy RB, Claro RM, Moubarac JC, Monteiro CA. Increased contribution of ultra-processed food products in the Brazilian diet (1987-2009). Rev Saude Publica [Internet]. 2013 [cited 2018 ago 22];47(4):656-65. doi: https://doi.org/10.1590/S0034-8910.2013047004968
7. Ministério da Saúde (BR). Secretaria de Atenção à Saúde. Departamento de Atenção Básica. Guia alimentar para a população brasileira. Brasília; 2014.
8. World Health Organization. Assessing national capacity for the prevention and control of noncommunicable diseases: report of the 2010 global survey. Genebra; 2012.
9. Katz DL, Meller S. Can we say what diet is best for health? Annu Rev Public Health [Internet]. 2014 [cited 2018 ago 22];35:83-103. Available from: https://www.annualreviews.org/doi/pdf/10.1146/ annurev-publhealth-032013-182351
10. Monteiro CA, Cannon G. The Impact of Transnational "Big Food" Companies on the South: A View from Brazil. PLoS Med. 2012;9(7):1-9.
11. World Health Organization. Ultra-processed food and drink products in Latin America: Trends, impact on obesity, policy implications [Internet]. Washington; 2015 [cited 2018 ago 22]. Available from: http://iris. paho.org/xmlui/bitstream/handle/123456789/7699/9789275118641_eng.pdf
12. Purdie N, McCrindle A. Self-regulation, self-efficacy and health behavior change in older adults. Educ Gerontol [Internet]. 2002 [cited 2018 ago 22];28(5):379-400. doi: https://doi. org/10.1080/03601270290081353
13. Herforth A, Ahmed S. The food environment, its effects on dietary consumption, and potential for measurement within agriculture-nutrition interventions. Food Secur [Internet]. 2015 [cited 2018 ago 22];7(3):505-20. doi: https://doi.org/10.1007/s12571-015-0455-8
14. Gill M, Feliciano D, Macdiarmid J, Smith P. The environmental impact of nutrition transition in three case study countries. Food Secur [Internet]. 2015 [cited 2018 ago 22];7(3):493-504. doi: https://doi.
15. Carter M, Hancock N, Albar S, Brown H, Greenwood D, Hardie L, et al. Development of a New Branded UK Food Composition Database for an Online Dietary Assessment Tool. Nutrients [Internet]. 2016 [cited 2018 ago 22];8(8):480. doi: https://doi.org/10.3390/nu8080480
16. Noronha J, Hysen E, Zhang H. PlateMate: crowdsourcing nutrition analysis from food photographs. In: UIST´11 Proceedings of the 24th annual ACM symposium on user interface software and technology [Internet]. 2011 Oct 16-19. Santa Barbara, CA; Nova Iorque: ACM Siggraph; c2011. p. 1-12. Available from: http://nrs.harvard.edu/urn-3:HUL.InstRepos:8720824
17. Riet J van’t, Sijtsema SJ, Dagevos H, De Bruijn G-J. The importance of habits in eating behaviour. An overview and recommendations for future research. Appetite [Internet]. 2011 [cited 2018 ago 22];57(3):585–96. doi: https://doi.org/10.1016/j.appet.2011.07.010
18. Schwartz C, Scholtens PAMJ, Lalanne A, Weenen H, Nicklaus S. Development of healthy eating habits early in life. Review of recent evidence and selected guidelines. Appetite [Internet]. 2011 [cited 2018 ago 22];57(3):796–807. doi: https://doi.org/10.1016/j.appet.2011.05.316
19. World Health Organization. National eHealth Strategy Toolkit. Genebra; 2012.
20. Chatterjee S, Price A. Healthy living with persuasive technologies: framework, issues, and challenges. J Am Med Informatics Assoc. 2009 [cited 2018 ago 22];16(2):171–8. doi: https://doi.org/10.1197/jamia. M2859 https://doi.org/10.1197/jamia.M2859
21. Blaya JA, Fraser HSF, Holt B. E-Health Technologies Show Promise In Developing Countries. Health Aff [Internet]. 2010 [cited 2018 ago 22];29(2):244–51. doi: https://doi.org/10.1377/hlthaff.2009.0894
22. Holzinger A, Dorner S, Fodinger M, Valdez CA, Ziefle M. Chances of Increasing Youth Health Awareness through Mobile Wellness Applications. LNCS [Internet]. 2010 [cited 2018 ago 22];6389:71–81. Available from: https://pdfs.semanticscholar.org/2423/3020415d0abbb7bb9040ced7618196ff680e.pdf
23. Chou WS, Prestin A, Lyons C, Wen K. Web 2.0 for Health Promotion: Reviewing the Current Evidence. Am J Public Health [Internet]. 2013 [cited 2018 ago 22];103(1):e9–18. https://doi.org/10.2105/
AJPH.2012.301071
24. Boushey C, Wright J, KD L, Ebert D, EJ D. Use of technology in children´s dietary assessment. Eur J Clin Nutr [Internet]. 2009 [cited 2018 ago 22];63(Suppl 1):S50–7. doi: https://doi.org/10.2105/ AJPH.2012.301071
25. Ball MJ, Lillis J. E-health: transforming the physician/patient relationship. Int J Med Inform. 2001;61(1):1-10.
26. Parker AG, Harper R, Grinter RE. Celebratory health technology. J Diabetes Sci Technol. 2011;5(2):319-24. doi: https://doi.org/10.1177/193229681100500218
27. Willett W. Eat, drink, and be healthy: the Harvard Medical School guide to healthy eating. Washington: FreePress; 2011.
28. Guenther PM, Reedy J, Krebs-Smith SM, Reeve BB, Basiotis P. Development and evaluation of the Healthy Eating Index-2005: technical report. Washington, DC: Center for Nutrition Policy and Promotion; 2007.
29. Harvard School of Public Health. Harvard researchers launch Healthy Eating Plate: Guide to eating a healthy meal based on latest science addresses shortcomings in U.S. government’s MyPlate [Internet]. Boston; 2011 Sept 14 [cited 2012 ago 18]. Available from: https://www.hsph.harvard.edu/news/press-releases/healthy-eating-plate/
30. Guenther PM, Casavale KO, Reedy J, Kirkpatrick SI, Hiza HAB, Kuczynski KJ, et al. Update of the healthy eating index: HEI-2010. J Acad Nutr Diet. 2013;113(4):569-80. doi: https://doi.org/10.1016/j. jand.2012.12.016
31. Caivano S, Domene SMA. Diet quality index for healthy food choices. Rev Nutr. 2013;26(6):693-9. doi:
http://dx.doi.org/10.1590/S1415-52732013000600008
32. Universidade Estadual de Campinas. Núcleo de Estudos e Pesquisas em Alimentação.Tabela Brasileira de Composição de AlimentosTACO. Campinas; 2011.
33. Department of Agriculture (USA). Agricultural Research Service. National Nutrient Database for Standard Reference Release 26. Beltsville; 2013. Available from: http://ndb.nal.usda.gov/ndb/search/list
34. Caivano S, Camargo M, Anunciato T, Domene S. Escuta sensível e linguagem digital: aprimorando um guia alimentar a partir da opinião de seus usuários. In: World Nutrition Rio2012; 2012 abr 27-30. Rio de Janeiro; Rio de Janeiro: UERJ; 2012.
35. World Health Organization. Obesity: preventing and managing the global epidemic. Genebra; 2000. 252 p. 36. Liu C, Zhu Q, Holroyd KA, Seng EK. Status and trends of mobile-health applications for iOS devices: a
developer´s perspective. J Syst Softw. 2011;84(11):2022-33.
37. Rusin M, Arsand E, Hartvigsen G. Functionalities and input methods for recording food intake: a systematic review. Int J Med Inform. 2013;1-12. doi: https://doi.org/10.1016/j.ijmedinf.2013.01.007
38. Santos FL, Esteves SS, da Costa Pereira A, Yancy Jr WS, Nunes JPL. Systematic review and meta-analysis of clinical trials of the effects of low carbohydrate diets on cardiovascular risk factors. Obes Rev. 2012;13(11):1048-66. doi: https://doi.org/10.1111/j.1467-789X.2012.01021.x
39. World Cancer Research Fund. American Institute for Cancer. Physical activity and the prevention of cancer: a global perspective. Washington; 2007.
40. Haapala I, Borengo NC, Biggs S, Surakka L, Manninen P. Weight loss by mobile phone: a 1-year effectiveness study. Public Health Nutr. 2009;12(12):2382-91. doi: https://doi.org/10.1017/ S1368980009005230
41. Thompson FE, Subar AF, Loria CM, Reedy JL, Baranowshi T. Need for technological innovation in dietary assessment. J Am Diet Assoc. 2011;110(1):48-51. doi: https://doi.org/10.1016/j.jada.2009.10.008
42. Arab L, Estrin D, Kim DH, Burke J, Goldman J. Feasibility testing of an automated image-capture method to aid dietary recall. Eur J Clin Nutr. 2011;65(10):1156-62. doi: https://doi.org/10.1038/ejcn.2011.75
43. Rossi MC, Perozzi C, Consorti C, Almonti T, Foglini P, Giostra N, et al. An interactive diary for diet managemente (DAI): a new telemedicine system able to promote body weight reduction, nutritional education, and consumption of fresh local produce. Diabetes Technol Ther. 2010;12(8):645-7. doi:
https://doi.org/10.1089/dia.2010.0025
44. Penn L, Boeing H, Boushey CJ, Dragsted LO, Kaput J, Scalbert A, et al. Assessment of dietary intake: NuGO symposium report. Genes Nutr. 2010;5(3):205-13.