Utilization of food outlets and intake of minimally processed
and ultra-processed foods among 7 to 14-year-old
schoolchildren. A cross-sectional study
Elizabeth Nappi Corrêa
I, Anabelle Retondario
II, Mariane de Almeida Alves
III, Liliana Paula Bricarello
IV, Gabriele Rockenbach
V,
Patrícia de Fragas Hinnig
VI, Janaina das Neves
VII, Francisco de Assis Guedes de Vasconcelos
VIIIDepartment of Nutrition, Universidade Federal de Santa Catarina (UFSC), Florianópolis (SC), Brazil
INTRODUCTION
Ultra-processed foods are characterized by high energy density and higher content of free sugars, sodium and total and saturated fat, combined with lower protein and fiber content.1
They have hyper-palatability, are often offered in large-sized portions and are accompanied by aggressive marketing strategies, which leads to overeating.2 There is evidence that increased
intake of ultra-processed foods and reduced intake of unprocessed or minimally processed foods, and concomitant increases in rates of inactivity, are the factors most strongly associated with obesity and other non-communicable chronic diseases.3
In high-income countries, consumption of ultra-processed foods has been widespread for a long time. In middle and low-income countries, there is a rapidly-growing tendency to replace unprocessed and minimally processed foods and meals prepared by traditional culinary methods with commercial ready-to-eat products. This has occurred mainly since the 1980s.4 The typical
dietary intake of Brazilian adolescents is based on excessive consumption of ultra-processed foods.5
Changes in eating habits are widely attributed to environmental characteristics that encour-age excessive nutritional intake.6 The current dietary intake and physical activity profile is
par-tially a result of environmental factors, and particularly the features of the built environment,7
i.e. the environment created by modern societal trends.8
Industrialization, urbanization, economic development and globalized markets have created an environment with great availability and accessibility of high levels of energy-dense foods. Fur-thermore, there is intense social pressure on people to eat these foods.9
IPhD. Dietitian and Assistant Professor,
Department of Nutrition, Universidade Federal de Santa Catarina (UFSC), Florianópolis (SC), Brazil.
orcid.org/0000-0002-2863-4262
IIMSc. Dietitian and Doctoral Student,
Universidade Federal de Santa Catarina (UFSC), Florianópolis (SC), Brazil.
orcid.org/0000-0002-8809-5627
IIIMSc. Dietitian, Universidade Federal de Santa
Catarina (UFSC). Florianópolis (SC), Brazil. orcid.org/0000-0002-9628-7522
IVMSc. Dietitian and Doctoral Student,
Universidade Federal de Santa Catarina (UFSC), Florianópolis (SC), Brazil.
orcid.org/0000-0001-5155-0107
VPhD. Dietitian and Assistant Professor,
Department of Nutrition, Universidade Federal de Santa Catarina (UFSC), Florianópolis (SC), Brazil.
orcid.org/0000-0002-7318-6745
VIPhD. Dietitian and Assistant Professor,
Department of Nutrition, Universidade Federal de Santa Catarina (UFSC), Florianópolis (SC), Brazil.
orcid.org/0000-0002-9348-8513
VIIPhD. Dietitian and Associate Professor,
Department of Nutrition, Universidade Federal de Santa Catarina (UFSC), Florianópolis (SC), Brazil.
orcid.org/0000-0002-9026-9841
VIIIPhD. Dietitian and Professor, Universidade
Federal de Santa Catarina (UFSC), Florianópolis (SC), Brazil.
orcid.org/0000-0002-6162-8067
KEY WORDS: Child. Adolescent.
Environment and public health.
ABSTRACT
BACKGROUND: Access to food retailers is an environmental determinant that influences what people
consume. This study aimed to test the association between the use of food outlets and schoolchildren’s
intake of minimally processed and ultra-processed foods.
DESIGN AND SETTING: This was a cross-sectional study conducted in public and private schools in
Flori-anópolis, state of Santa Catarina, southern Brazil, from September 2012 to June 2013.
METHODS: The sample consisted of randomly selected clusters of schoolchildren aged 7 to 14 years,
who were attending 30 schools. Parents or guardians provided socioeconomic and demographic data and answered questions about use of food outlets. Dietary intake was surveyed using a dietary recall question-naire based on the previous day’s intake. The foods or food groups were classified according to the level of processing. Negative binomial regression was used for data analysis.
RESULTS: We included 2,195 schoolchildren in the study. We found that buying foods from snack bars or
fast-food outlets was associated with the intake frequency of ultra-processed foods among 11-14 years old in an adjusted model (incidence rate ratio, IRR: 1.11; 95% confidence interval, CI: 1.01;1.23). Use of butchers was associated with the intake frequency of unprocessed/minimally processed foods among children 11-14 years old in the crude model (IRR: 1.11; 95% CI: 1.01;1.22) and in the adjusted model (IRR: 1.11; 95% CI: 1.06;1.17).
CONCLUSIONS: Use of butchers was associated with higher intake of unprocessed/minimally processed
Residents of communities with easy access to foods that are considered to be healthy tend to have healthier diets.10 The
avail-ability and accessibility of foods that are considered to be either healthier or less healthy are important factors that influence the eating habits of adolescents and adults.9
One of the most important environmental determinants influ-encing people’s diets is their degree of access to the establishments that sell food in their neighborhoods.10 But a significant
propor-tion of studies investigating food environments only evaluate the availability of establishments that sell food and do not consider whether people actually use them.11
Given that features of the environment can influence people’s nutritional choices, this study aimed to investigate the association between use of food outlets and intake of minimally processed and ultra-processed foods among 7 to 14-year-old schoolchildren.
METHODS
This was a cross-sectional analytical study conducted in the city of Florianópolis, capital of the state of Santa Catarina, in south-ern Brazil.
The procedures that were used for sample size calculation and sampling have been described elsewhere.12 Briefly, we had a
possible sample of 2,506 schoolchildren, stratified according to municipal administrative districts, type of school (public or pri-vate) and age group (7-10 or 11-14 years). We randomly selected 30 schools (19 public and 11 private schools), and schoolchildren from each school through clusters. Trained researchers collected data between September 2012 and June 2013.
Seven to 14-year-old schoolchildren were recruited after their guardians had signed free and informed consent forms. Individuals with disabilities that prevented assessment and pregnant adoles-cents were excluded. Socioeconomic, demographic and anthropo-metric data and information on the dietary intakes and lifestyles of these schoolchildren and their families were acquired through direct measurement or administration of specific data collection instruments, as described below.
The project was approved by the Human Research Ethics Com-mittee at the Federal University of Santa Catarina (no. 120341/2012).
Socioeconomic and demographic data and use of food outlets
The children’s parents received a questionnaire covering socioeco-nomic and demographic information about the schoolchildren and their families (sex, age and mother’s educational level) and data on where they lived and what type of food outlets they used.
Data on food outlets and their use by schoolchildren and their families were obtained through a questionnaire in which the out-lets were categorized into eight types: restaurants, snack bars/ fast-food outlets, street vendors, supermarkets, mini-markets,
greengrocers/public markets, bakeries and butchers. The children’s parents answered “yes” if they frequently used any of the food out-lets or “no” if they did not.
Socioeconomic status was estimated based on the average income for the weighting area where the schoolchildren lived (each weighting area comprised a cluster of census tracts).13
This infor-mation was obtained from the 2010 Brazilian demographic cen-sus, published by the Brazilian Institute for Geography and Sta-tistics (IBGE).13 The income values were given in reais (R$) by
IBGE, but for the purposes of this study they were converted into dollars (USD) using the mid-price for the dollar in August 2010 (1 USD = R$ 1.75), when data collection for the census began.
Dietary intake assessment and NOVA food classification
Data on dietary intake were obtained from a single dietary recall questionnaire based on the previous day’s intake, known as QUADA-3 (Questionário Alimentar do Dia Anterior). This tool was administered at each school, directly to the children, because the tool was developed specifically for children to be able to understand it. It consists of an illustrated questionnaire cover-ing six eatcover-ing occasions (breakfast, mid-morncover-ing snack, lunch, mid-afternoon snack, dinner, and late-evening snack) in chrono-logical order and includes 21 foods or food groups for each eating occasion. This tool was structured as a record in which the fre-quencies of consumption of different types of food over the pre-vious day were ascertained, but not the quantities.14
This questionnaire was given to the schoolchildren and, with help from the researchers, they indicated which foods they had eaten on the previous day at each of these mealtimes. Because the tool was applied within the school setting and there was no school on Saturdays and Sundays, it was not possible to obtain data representing food consumption for Fridays and Satur-days. By giving the questionnaire to the participating schools on alternate school days, we were able to get information on dietary intake on a selection of different days of the week (including Sun-days). For the purposes of this study, foods covered by QUADA-314 were classified in accordance with the level of processing, as
proposed by the NOVA food classification.4
The NOVA classification is based on types of food process-ing, and food groups, according to the extent and purpose of the processing to which they have been subjected.4 NOVA describes
four categories for food classification, according to processing: 1. unprocessed and minimally processed foods;
2. processed culinary ingredients; 3. processed foods; and
4. ultra-processed foods.4
to be edible parts of animals, plants, fungi or algae that are in the same state as when they were extracted from nature. Minimally processed foods were considered to be unprocessed foods that had been modified through minimal processing after extraction from nature, such as pasteurization, drying, boiling and other processes that do not involve addition of other substances. Pro-cessed foods were considered to be those made by adding cooking ingredients to unprocessed and minimally processed foods, for example, fruit and vegetable preserves, salted seeds and smoked meats. Finally, ultra-processed foods were considered to be man-ufactured preparations containing long lists of ingredients, many of which are utilized exclusively by the industry, such as casein, lactose and hydrogenated fats.4 Processed cooking ingredients
were not included in the categories that were set up, because we were dealing with meals, and not with ingredients (such as salt, sugar, honey, oils and fats).
For the analysis, eight of the 21 foods and food groups inves-tigated using QUADA-314 were defined as ultra-processed foods:
yoghurt, chocolate milk, “treats” (candies, lollipops, biscuits with fillings and ice cream), potato crisps (US: chips) or chips (US: French fries), sugary soft drinks, pizzas, hamburgers, breads and biscuits. The decision to classify bread as ultra-processed food was justified because our tool was not able to specify what type of bread was consumed and, according to the NOVA classification, breads are ultra-processed if they have other ingredients besides wheat, yeast, water and salt.4 In this way, we follow the
adapta-tion proposed by Bielemann et al.15 Twelve foods and food groups
were defined as unprocessed or minimally processed foods: veg-etables, leafy greens, fruit, fruit juice, rice, beans, pasta, vegetable soup, red meat, chicken, fish and seafood, milk and coffee with milk. The processed foods category was excluded because only one food (cheese) belonged to this group.
Statistical treatment
The data were processed using EpiData 3.0, with data quality controlled by means of double entry. Statistical analyses were conducted using STATA version 13.0 (StataCorp, Texas, USA), considering the design effect in all analyses.
Data were expressed using absolute and relative frequencies. Associations between exposures (use of each food outlet) and out-comes (the frequencies at which ultra-processed and unprocessed/ minimally processed foods were consumed during the previous day) were assessed using negative binomial regression analysis for count data with the presence of excess zeros. Initially, a crude anal-ysis model was constructed. The multivariate model was adjusted for sex, mother’s educational level (≤ 8 years or > 8 years) and the income of the weighting area (expressed in terciles). Stratified analysis was conducted according to age (7-10 or 11-14). A sig-nificance level of P < 0.05 was used.
RESULTS
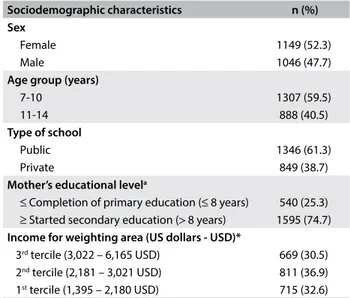
The characteristics of the study population are shown in Table 1. Of the 2,506 schoolchildren, 311 were excluded because lack of an address or its incompleteness prevented their identification. This left 2,195 children (88% of the total sample) available for inclusion. Among the schoolchildren, there were slight majorities of girls (52%), students aged 7-10 years (60%), students enrolled at public schools (61%) and students whose mothers had had at least 8 years of schooling (75%).
Table 2 shows the absolute and relative frequencies of the
schoolchildren’s dietary intake of each type of food, classified as either “unprocessed/minimally processed” or “ultra-processed”. Approximately 99% of the schoolchildren reported that they had eaten both unprocessed/minimally processed foods and ultra-pro-cessed foods on the day before the survey. In the unproultra-pro-cessed/ minimally processed group of foods, more than half of the chil-dren had eaten rice, red meat or chicken, and beans. Among the ultra-processed foods, more than half of the sample had eaten bread or biscuits, sugary soft drinks and chocolate milk.
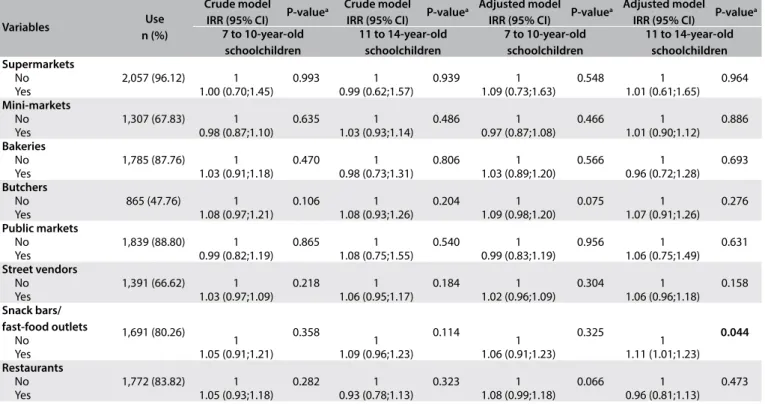
Table 3 lists the prevalence of use of food outlets and the
associ-ation between use of food outlets and intake of ultra-processed foods on the previous day. The food outlets that were most frequented were supermarkets (96.12%), public markets (88.80%) and baker-ies (87.76%). We noted that use of snack bars and fast-food outlets had a positive association with intake of ultra-processed foods in the adjusted model among the children aged 11-14 years (inci-dence rate ratio, IRR: 1.11; 95% confi(inci-dence interval, CI: 1.01;1.23). The association between use of food outlets and intake of unprocessed/minimally processed foods is shown in Table 4.
Sociodemographic characteristics n (%)
Sex
Female 1149 (52.3)
Male 1046 (47.7)
Age group (years)
7-10 1307 (59.5)
11-14 888 (40.5)
Type of school
Public 1346 (61.3)
Private 849 (38.7)
Mother’s educational levela
≤ Completion of primary education (≤ 8 years) 540 (25.3)
≥ Started secondary education (> 8 years) 1595 (74.7)
Income for weighting area (US dollars - USD)*
3rd tercile (3,022 – 6,165 USD) 669 (30.5)
2nd tercile (2,181 – 3,021 USD) 811 (36.9)
1st tercile (1,395 – 2,180 USD) 715 (32.6)
Table 1. Distribution of sociodemographic characteristics among
7 to 14-year-old schoolchildren. Florianópolis, Brazil, 2012-2013
an = 2,135; *Conversion from Brazilian Real using the mid-price for the
An association was found between use of butchers and the fre-quency of intake of unprocessed/minimally processed foods among the children aged 11-14 years in the crude model (IRR: 1.11; 95% CI: 1.01;1.22) and in the adjusted model (IRR: 1.11; 95% CI: 1.06;1.17).
No association was found between use of food outlets and the frequencies of intake of unprocessed/minimally processed foods and ultra-processed foods among the children aged 7-10 years.
DISCUSSION
Almost all of the schoolchildren interviewed stated that they had eaten ultra-processed foods on the previous day. Eating habits that include excessive consumption of ultra-processed foods are increasing, and this has been attributed to factors such as convenience, simplicity, accessibility and shorter preparation times.3 Rises in the incomes of
Brazilian families, particularly among those in low-income catego-ries, have also been identified as a factor that increases poorer families’ access to these products.16 In association with these factors,
ready-to-eat products are marketed aggressively, especially targeting children.17
The dietary intake observed in this study was similar to what has been seen in nationwide studies in Brazil. A study conducted in 2016 among 12 to 17-year-old adolescents found that the most frequently consumed unprocessed/minimally processed foods were rice, beans and beef. Among the ultra-processed foods, bread, biscuits and sugary soft drinks had the greatest prevalence of con-sumption.5 Similar dietary behavior was observed by Levy et al.,18
who found that the most frequently consumed healthy food item was beans, while unhealthy eating was marked by high intake of sug-ary soft drinks and treats. The share of the Brazilian diet accounted for by ultra-processed products has been growing since the 1980s in metropolitan areas and the same pattern was confirmed in the 2000s, independently of socioeconomic status.19
The findings of the present study suggest that there is a pos-itive association between use of snack bars and fast-food outlets and intake of ultra-processed foods. Few studies had explored the relationship between the intake of foods classified according to the level of processing and use of different food outlets.20, 21 Since this
subject is relatively new, it is reasonable to compare the present results with those of studies that investigated the availability and density of food outlets and the intake of foods, but not necessarily using classifications according to the level of processing.
A Canadian study reported that living near fast-food outlets had a marked influence on the eating habits of 11 to 15-year-old adolescents. Those in neighborhoods with moderate or high den-sity of fast-food restaurants had an excessive intake of fast food.22
Similar findings were reported among Danish adolescents of the same age, among whom the boys who had greater exposure to fast-food restaurants in the environs of their schools had higher intake of the foods sold at these establishments than did those who were not exposed to these restaurants.20
Another Canadian study on 810 adolescents aged 11 to 14 found that there was poorer quality of diet, with higher intake of fast foods, among those who lived close to or went to schools close to convenience stores and outlets selling fast foods.23 Similar results
were reported by Laska et al.,24 who found that the sugar-sweetened
beverage intake of 349 American adolescents was associated with living close to fast-food restaurants, convenience or grocery stores or any retail facility. Adolescents who lived close to these retailers were also more likely to buy foods from these outlets when their parents or guardians were not around.24
Our study showed that there was a positive association between the use of snack bars and fast-food outlets and the intake of ultra-processed foods, when stratified by age, among the adoles-cents (from 11 to 14 years). Adolesadoles-cents have more autonomy in relation to purchasing food. In addition to access and autonomy, food choices also reflect an array of personal and social values. Adolescence is an important developmental age accompanied by notable declines in a range of health-related behaviors.24
Foods and food groupsa
Eaten the previous day n (%) 7 to 10-year-old
schoolchildren
11 to 14-year-old schoolchildren
Unprocessed/minimally
processed foods 1,333 (99.5) 840 (98.7)
Rice 999 (74.6) 651 (76.7)
Red meat or chicken 821 (63.0) 604 (70.4)
Beans 848 (63.0) 482 (56.7)
Fruit 688 (51.3) 389 (45.0)
Pasta 664 (48.6) 380 (44.9)
Fruit juice 582 (43.8) 343 (41.5)
Coffee with milk 496 (35.8) 330 (37.2)
Milk 353 (26.1) 209 (23.9)
Vegetables 272 (21.1) 196 (24.3)
Leafy greens 254 (19.9) 204 (24.4)
Vegetable soup 234 (16.2) 57 (6.4)
Fish or seafood 178 (12.4) 97 (10.7)
Ultra-processed foods 1,323 (98.4) 834 (97.6)
Bread or biscuits 1,090 (80.4) 700 (80.9)
Sugary soft drinks 797 (58.8) 497 (59.0)
Chocolate milk 759 (55.9) 422 (49.6)
Treats 603 (45.8) 402 (46.2)
Yoghurt 449 (32.9) 234 (27.2)
Pizzas or hamburgers 328 (23.5) 177 (21.0)
Chips (US: French fries) 255 (17.8) 157 (19.1)
Crisps (US: chips) 235 (16.7) 149 (17.5)
Table 2. Dietary intake on previous day, classified according to foods and food groups and their degree of processing, among 7 to 10-year-old and 11 to 14-year-old schoolchildren. Florianópolis, Brazil, 2012-2013
aThe category identified as “processed food” was excluded because only
Variables Use n (%)
Crude model
IRR (95% CI) P-value
a Crude model
IRR (95% CI) P-value
a Adjusted model
IRR (95% CI) P-value
a Adjusted model
IRR (95% CI) P-value
a
7 to 10-year-old schoolchildren
11 to 14-year-old schoolchildren
7 to 10-year-old schoolchildren
11 to 14-year-old schoolchildren Supermarkets
2,057 (96.12) 0.993 0.939 0.548 0.964
No 1 1 1 1
Yes 1.00 (0.70;1.45) 0.99 (0.62;1.57) 1.09 (0.73;1.63) 1.01 (0.61;1.65)
Mini-markets
1,307 (67.83) 0.635 0.486 0.466 0.886
No 1 1 1 1
Yes 0.98 (0.87;1.10) 1.03 (0.93;1.14) 0.97 (0.87;1.08) 1.01 (0.90;1.12)
Bakeries
1,785 (87.76) 0.470 0.806 0.566 0.693
No 1 1 1 1
Yes 1.03 (0.91;1.18) 0.98 (0.73;1.31) 1.03 (0.89;1.20) 0.96 (0.72;1.28)
Butchers
865 (47.76) 0.106 0.204 0.075 0.276
No 1 1 1 1
Yes 1.08 (0.97;1.21) 1.08 (0.93;1.26) 1.09 (0.98;1.20) 1.07 (0.91;1.26)
Public markets
1,839 (88.80) 0.865 0.540 0.956 0.631
No 1 1 1 1
Yes 0.99 (0.82;1.19) 1.08 (0.75;1.55) 0.99 (0.83;1.19) 1.06 (0.75;1.49)
Street vendors
1,391 (66.62) 0.218 0.184 0.304 0.158
No 1 1 1 1
Yes 1.03 (0.97;1.09) 1.06 (0.95;1.17) 1.02 (0.96;1.09) 1.06 (0.96;1.18)
Snack bars/
fast-food outlets 1,691 (80.26) 0.358 0.114 0.325 0.044
No 1 1 1 1
Yes 1.05 (0.91;1.21) 1.09 (0.96;1.23) 1.06 (0.91;1.23) 1.11 (1.01;1.23)
Restaurants
1,772 (83.82) 0.282 0.323 0.066 0.473
No 1 1 1 1
Yes 1.05 (0.93;1.18) 0.93 (0.78;1.13) 1.08 (0.99;1.18) 0.96 (0.81;1.13)
Table 3. Association between frequency of ultra-processed food intake and types of food outlet frequented by the family among 7 to 10-year-old and 11 to 14-year-old schoolchildren. Florianópolis, Brazil, 2012-2013
aNegative binomial regression.
NOTES: Crude model: intake of ultra-processed foods and use of food outlets. Adjusted model: crude model + sex, mother’s schooling and income in weighting area. Boldface indicates statistical significance (P < 0.05).
Variables Use
n (%)
Crude model
IRR (95% CI) P-value
a Crude model
IRR (95% CI) P-value
a Adjusted model
IRR (95% CI) P-value
a Adjusted model
IRR (95% CI) P-value
a
7 to 10-year-old schoolchildren
11 to 14-year-old schoolchildren
7 to 10-year-old schoolchildren
11 to 14-year-old schoolchildren Supermarkets
2,057 (96.12) 0.456 0.212 0.076 0.114
No 1 1 1 1
Yes 1.04 (0.89;1.21) 1.14 (0.88;1.49) 1.10 (0.98;1.24) 1.22 (0.91;1.64)
Mini-markets
1,307 (67.83) 0.517 0.444 0.635 0.378
No 1 1 1 1
Yes 1.03 (0.90;1.18) 1.07 (0.83;1.39) 1.03 (0.87;1.21) 1.08 (0.86;1.36)
Bakeries
1,785 (87.76) 0.328 0.422 0.376 0.512
No 1 1 1 1
Yes 0.94 (0.80;1.11) 1.10 (0.79;1.54) 0.95 (0.80;1.12) 1.09 (0.74;1.61)
Butchers
865 (47.76) 0.225 0.040 0.261 0.006
No 1 1 1 1
Yes 1.07 (0.93;1.24) 1.11 (1.01;1.22) 1.08 (0.91;1.27) 1.11(1.06;1.17)
Public markets
1,839 (88.80) 0.865 0.728 0.760 0.846
No 1 1 1 1
Yes 0.98 (0.86;1.12) 0.98 (0.81;1.18) 0.99 (0.86;1.13) 0.99 (0.83;1.18)
Street vendors
1,391 (66.62) 0.110 0.153 0.421 0.141
No 1 1 1 1
Yes 0.97 (0.95;1.01) 0.95 (0.88;1.03) 0.98 (0.93;1.04) 0.94 (0.85;1.04)
Snack bars/
fast-food outlets 1,691 (80.26) 0.566 0.328 0.202 0.435
No 1 1 1 1
Yes 1.01 (0.98;1.03) 0.94 (0.80;1.11) 1.02 (0.98;1.05) 0.94 (0.76;1.16)
Restaurants
1,772 (83.82) 0.318 0.688 0.292 0.517
No 1 1 1 1
Yes 1.04 (0.93;1.17) 0.98 (0.82;1.16) 1.05 (0.93;1.18) 0.96 (0.81;1.14)
Table 4. Association between frequency of unprocessed/minimally processed food intake and types of food outlet frequented by the family among 7 to 10-year-old and 11 to 14-year-old schoolchildren. Florianópolis, Brazil, 2012-2013
aNegative binomial regression.
In the present study, use of butchers was associated with higher intake of unprocessed/minimally processed foods, probably because in this type of establishment, fresh meat that needs culinary prepa-ration is sold. However, use of supermarkets was not associated with intake of unprocessed or minimally processed foods. It needs to be borne in mind that supermarkets sell a wide variety of dif-ferent food items, ranging from fresh and unprocessed foods to ultra-processed foods.25
Living at a greater distance from supermarkets in metropol-itan areas reduced the intake of fruits and vegetables among the adult population in a nationwide study in the United States.26
No associations were observed in another study23 that was
con-ducted in London among adolescents (11 to 13 years old). A study conducted in the city of Santos (state of São Paulo, Bra-zil) showed that using supermarkets to purchase fresh products was associated with lower levels of purchases of ultra-processed foods from the supermarket.21 Another study that was
devel-oped among 1,721 children aged 9-10 years, in Norfolk, England, found that higher density of supermarkets was associated not only with higher consumption of fruits and vegetables, but also with more sweets, sugary drinks, breakfast cereals and white bread. Increasing distance from convenience and takeaway food stores was associated with lower intake of crisps, chips, sweets, choc-olate and white bread.27
The cost of foods and its influence on consumption has also been discussed in the literature. The difference in cost between ultra-processed and minimally processed foods in New Zealand supermarkets was studied by Lutein et al.28 No statistically
signifi-cant difference was found in terms of cost, but the authors suggested that ultra-processed products, which made up 83% of the packaged products offered, might have provided time-poor consumers with greater value for money.28 Swiss researchers examining the driving
forces behind increasing consumption of convenience foods iden-tified 15 drivers for purchases of these foods. Among these forces, age, concern for naturalness, nutritional knowledge and cooking skills were the strongest drivers.29
LIMITATIONS
One limitation of this study relates to the dietary intake ques-tionnaire, which assesses frequency of intake rather than quan-tity (qualitative method). This eliminates difficulties relating to children’s assessments of portion sizes and simplifies the memory task through only covering foods eaten the previous day.30 It is
an approach that enables use of a relatively brief questionnaire that is easy for children to answer with minimal assistance.14
However, one day’s dietary intake may not be representative of habitual individual intakes. On the other hand, our results are made more robust by the reasonable sample size and the good coverage of different days of the week, including weekdays and
Sundays.14 Additionally, we recognize that not every type of food
purchased from each type of outlet was evaluated.
The strengths of our study were the sample size and the adjust-ment of the data for sociodemographic and economic control variables. Classification of foods according to degree of process-ing introduces additional evidence to help explain the global epi-demic of non-communicable chronic diseases, including obesity among children and adolescents,31 considering that classification of
foods according to nutritional categories alone has not explained this relationship.3
Many different studies have investigated the availability and presence of food outlets and dietary intake among children and adolescents.32, 33 In the present study, parents and their
chil-dren were asked whether they actually used these establishments, without attempting to identify whether they were located in the vicinities of their schools/homes. Research conducted by Leite et al.34 observed that food retailers that mostly sold
ultra-pro-cessed foods were significantly closer to schools than were those that mostly sold foods with lesser degrees of processing, thus demonstrating the importance of also investigating retailers close to schools.
CONCLUSION
The results suggest that use of butchers contributed towards increasing the intake of unprocessed/minimally processed foods, thus showing the importance of the choices of places to buy foods. In contrast, schoolchildren’s use of snack bars and fast-food out-lets was related to their intake of ultra-processed foods, and this negatively influenced their dietary habits. Future studies should incorporate other features of the environment that influence dietary intake and choices. In addition, mapping of retail food outlets in specific environments could facilitate development of ways to promote healthy eating that are suitable for specific pop-ulations and the environments in which they live. Public health actions should address food labeling to make it easier for con-sumers to understand what they are buying. A means to help direct people towards places that sell fresh and healthy foods so that they avoid outlets for ultra-processed foods is also needed.
REFERENCES
1. Monteiro CA, Levy RB, Claro RM, de Castro IR, Cannon G. Increasing consumption of ultra-processed foods and likely impact on human health: evidence from Brazil. Public Health Nutr. 2011;14(1):5-13. doi:
10.1017/S1368980010003241.
2. Brasil. Ministério da Saúde. Guia alimentar para a população brasileira. 2a ed. Brasília: Ministério da Saúde; 2014.
3. Louzada ML, Baraldi LG, Steele EM, et al. Consumption of ultra-processed
4. Monteiro CA, Cannon G, Levy RB, et al. NOVA. A estrela brilha. [Classificação dos alimentos. Saúde Pública]. World Nutrition. 2016;7(1-3)-28-40. Available from: http://www.cookie.com.br/site/wp-content/
uploads/2016/12/NOVA-Classifica%C3%A7%C3%A3o-dos-Alimentos. pdf. Accessed in 2017 (Dec 8).
5. Souza AM, Barufaldi LA, Abreu GA, et al. ERICA: ingestão de macro e micronutrientes em adolescentes brasileiros [ERICA: intake of macro
and micronutrients of Brazilian adolescents]. Rev Saúde Pública. 2016;50 Suppl 1:5s. doi: 10.1590/S01518-8787.2016050006698.
6. Stanton RA. Food Retailers and Obesity. Curr Obes Rep. 2015;4(1):54-9. doi: 10.1007/s13679-014-0137-4.
7. Kegler MC, Escoffery C, Alcantara I, Ballard D, Glanz K. A qualitative examination of home and neighborhood environments for obesity prevention in rural adults. Int J Behav Nutr Phys Act. 2008;5:65. doi: 10.1186/1479-5868-5-65.
8. Caballero B. The global epidemic of obesity: an overview. Epidemiol Rev. 2007;29:1-5. PMID: 17569676.
9. Brug J, Kremers SP, Lenthe F, Ball K, Crawford D. Environmental determinants of healthy eating: in need of theory and evidence.
Proc Nutr Soc. 2008;67(3):307-16. doi: 10.1017/S0029665108008616. 10. Drewnowski A, Kawachi I. Diets and Health: How Food Decisions Are
Shaped by Biology, Economics, Geography, and Social Interactions. Big Data. 2015;3(3):193-7. PMID: 26487989.
11. Lind P, Jensen PV, Glumer C, Toft U. The association between accessibility of local convenience stores and unhealthy diet. Eur J Public Health. 2016;26(4):634-9. doi: 10.1093/eurpub/ckv242.
12. D’Avila GL, Silva DA, Vasconcelos F de A. Associação entre consumo
alimentar, atividade física, fatores socioeconômicos e percentual de gordura corporal em escolares [Association between dietary intake, physical activity, socioeconomic factors and body fat percentage among schoolchildren]. Ciên Saúde Colet. 2016;21(4):1071-81.
doi: 10.1590/1413-81232015214.13722015.
13. IBGE (Instituto Brasileiro de Geografia e Estatística). Pesquisa de Orçamentos Familiares 2008-2009. Antropometria e Estado Nutricional de Crianças, Adolescentes e Adultos no Brasil. Rio de Janeiro: IBGE;
2010. Available from: https://biblioteca.ibge.gov.br/visualizacao/livros/ liv45419.pdf. Accessed in 2017 (Dec 8).
14. Assis MA, Benedet J, Kerpel R, et al. Validação da terceira versão do Questionário Alimentar do Dia Anterior (QUADA-3) para escolares
de 6 a 11 anos [Validation of the third version of the Previous Day Food Questionnaire (PDFQ-3) for 6-to-11-years-old schoolchildren]. Cad Saúde Pública. 2009;25(8):1816-26. PMID: 19649423.
15. Bielemann RM, Motta JV, Minten GC, Horta BL, Gigante DP. Consumption
of ultra-processed foods and their impact on the diet of young adults. Rev Saúde Pública. 2015;49:28. PMID: 26018785.
16. Hoffmann R. Desigualdade da renda e das despesas per capita no Brasil, em 2002-2003 e 2008-2009, e avaliação do grau de
progressividade ou regressividade de parcelas da renda familiar. Economia e Sociedade. 2010;19(3):647-61. Available from: http://www.
eco.unicamp.br/docprod/downarq.php?id=728&tp=a. Accessed in 2018 (Dec 8).
17. Mallarino C, Gomez LF, González-Zapata L, Cadena Y, Parra DC.
Publicidade de bebidas e alimentos ultra-processados: crianças como população vulnerável [Advertising of ultra-processed foods and beverages: children as a vulnerable population]. Rev Saúde Pública. 2013;47(5):1006-10. PMID: 24626507.
18. Levy RB, Castro IR, Cardoso L de O, et al. Consumo e comportamento alimentar entre adolescentes brasileiros: Pesquisa Nacional de Saúde do Escolar (PeNSE), 2009 [Food consumption and eating behavior among Brazilian adolescents: National Adolescent School-based Health
Survey (PeNSE), 2009]. Ciên Saúde Colet. 2010;15 Suppl 2:3085-97. PMID: 21049149.
19. Martins AP, Levy RB, Claro RM, Moubarac JC, Monteiro CA. Participação crescente de produtos ultraprocessados na dieta brasileira (1987-2009)
[Increased contribution of ultra-processed food products in the Brazilian diet (1987-2009)]. Rev Saúde Pública. 2013;47(4):656-65. doi: 10.1590/ S0034-8910.2013047004968.
20. Svastisalee C, Pagh Pedersen T, Schipperijn J, et al. Fast-food intake and
perceived and objective measures of the local fast-food environment in adolescents. Public Health Nutr. 2016;19(3):446-55. doi: 10.1017/ S1368980015001366.
21. Vedovato GM, Trude AC, Kharmats AY, Martins PA. Degree of
food processing of household acquisition patterns in a Brazilian urban area is related to food buying preferences and perceived food environment. Appetite. 2015;87:296-302. doi: 10.1016/j. appet.2014.12.229.
22. Laxer RE, Janssen I. The proportion of excessive fast-food consumption attributable to the neighbourhood food environment among youth living within 1 km of their school. Appl Physiol Nutr Metab. 2014;39(4):480-6. doi: 10.1139/apnm-2013-0208.
23. He M, Tucker P, Gilliland J, et al. The influence of local food environments on adolescents’ food purchasing behaviors. Int J Environ Res Public Health. 2012;9(4):1458-71. doi: 10.3390/ijerph9041458.
24. Laska MN, Hearst MO, Forsyth A, Pasch KE, Lytle L. Neighbourhood food
environments: are they associated with adolescent dietary intake, food purchases and weight status? Public Health Nutr. 2010;13(11):1757-63. doi: 10.1017/S1368980010001564.
25. Rahmanian E, Gasevic D, Vukmirovich I, Lear SA. The association between
the built environment and dietary intake - a systematic review. Asia Pac J Clin Nutr. 2014;23(2):183-96. doi: 10.6133/apjcn.2014.23.2.08. 26. Michimi A, Wimberly MC. Associations of supermarket accessibility with
obesity and fruit and vegetable consumption in the conterminous United
States. Int J Health Geogr. 2010;9:49. doi: 10.1186/1476-072X-9-49. 27. Skidmore P, Welch A, van Sluijs E, et al. Impact of neighbourhood
food environment on food consumption in children aged 9-10 years in the UK SPEEDY (Sport, Physical Activity and Eating behaviour:
28. Lutein CM, Steenhuis IH, Eyles H, Ni Mhurchu C, Waterlander WE. Ultra-processed foods have the worst nutrient profile, yet they are the most available packaged products in a sample of New Zealand
supermarkets. Public Health Nutr. 2016;19(3):530-8. doi: 10.1017/ S1368980015002177.
29. Brunner TA, van der Horst K, Siegrist M. Convenience food products. Drivers for consumption. Appetite. 2010;55(3):498-506. doi: 10.1016/j.
appet.2010.08.017.
30. Livingstone MB, Robson PJ, Wallace JM. Issues in dietary intake assessment of children and adolescents. Br J Nutr. 2004;92 Suppl 2:S213-22. PMID: 15522159.
31. Bloch KV, Klein CH, Szklo M, et al. ERICA: prevalências de hipertensão arterial e obesidade em adolescentes brasileiros [ERICA: prevalences of hypertension and obesity in Brazilian adolescents]. Rev Saúde Pública. 2016;50 Suppl 1:9s. doi: 10.1590/S01518-8787.2016050006685.
32. Jennings A, Welch A, Jones AP, et al. Local food outlets, weight status, and dietary intake: associations in children aged 9-10 years. Am J Prev Med. 2011;40(4):405-10. doi: 10.1016/j.amepre.2010.12.014. 33. He M, Tucker P, Irwin JD, et al. Obesogenic neighbourhoods: the impact
of neighbourhood restaurants and convenience stores on adolescents’ food consumption behaviours. Public Health Nutr. 2012;15(12):2331-9. doi: 10.1017/S1368980012000584.
34. Leite FH, Oliveira MA, Cremm EC, et al. Availability of processed foods
in the perimeter of public schools in urban areas. J Pediatr (Rio J). 2012;88(4):328-34. doi:10.2223/JPED.2210.
Sources of funding: Conselho Nacional de Desenvolvimento Científico
e Tecnológico (CNPq), Universal Announcement MCTI/CNPq 14/2011 (Procedural no. 483955/2011-6) for research funding; and postgraduate scholarships from Fundo de Apoio à Manutenção e ao Desenvolvimento da Educação Superior (FUMDES/UNIEDU), Programa Ciências sem
Fronteiras, Coordenação de Aperfeiçoamento de Pessoal de Nível Superior (CAPES) and Fundação de Amparo e Pesquisa e Inovação do Estado de Santa Catarina (FAPESC)
Conflict of interest: None
Date of first submission: July 6, 2017
Last received: November 8, 2017
Accepted: December 6, 2017
Address for correspondence:
Elizabeth Nappi Corrêa Departamento de Nutrição
Universidade Federal de Santa Catarina (UFSC) Florianópolis (SC) — Brasil
CEP 88040-900 Tel. (+55 48) 3721-3486
E-mail: [email protected]
© 2018 by Associação Paulista de Medicina